2332
The effect of gadolinium contrast agent on T1 and T2 relaxation of brain in live and fixed zebrafish MRI
Noémie Hamilton1, Claire Allen2, and Steven Reynolds3
1Neuroscience Institute, University of Sheffield, Sheffield, United Kingdom, 2The Bateson Centre, University of Sheffield, Sheffield, United Kingdom, 3Medical School, University of Sheffield, Sheffield, United Kingdom
1Neuroscience Institute, University of Sheffield, Sheffield, United Kingdom, 2The Bateson Centre, University of Sheffield, Sheffield, United Kingdom, 3Medical School, University of Sheffield, Sheffield, United Kingdom
Synopsis
Zebrafish have become a ubiquitous animal model for studying a range of diseases and conditions. Typically, these studies are conducted in transparent juvenal fish where optical imaging techniques can be used. However, this is more difficult in adult zebrafish, restricting their use in longitudinal studies. Brain pathology in adult zebrafish can be imaged by preclinical MRI. Administering gadolinium based contrast agents (GBCA), which can also reduce scanning time, can highlight brain abnormalities such as lesions. T1/T2 values have been reported for gadolinium treated fixed/sacrificed zebrafish, however, this has not been reported for live zebrafish.
Introduction
In accordance with the NC3Rs, neurodegenerative research has steadily transitioned from rodent to zebrafish models. Studying brain diseases, e.g. Parkinson’s, Amyotrophic lateral sclerosis (ALS), use transparent juvenal zebrafish, which are amenable to optical imaging techniques, but restricts longitudinal measurements in the opaque adult. Adult zebrafish brain and heart have been imaged by preclinical MRI in flow chambers1,2. Administering gadolinium based contrast agents (GBCA) can highlight brain abnormalities such as brain lesions. T1/T2 values have been reported for gadolinium treated fixed/sacrificed zebrafish3, however, this has not been reported for live zebrafish. The objectives of this study are to evaluate the use of GBCA in live zebrafish MRI and determine the effect of administration route on T1 and T2 relaxation.Methods and Materials
All zebrafish were raised in an approved aquarium and maintained following standard protocols4. A custom-made zebrafish life support chamber was designed to provide easy access for fish loading and observation. The chamber was designed in open-source Blender modelling software (www.blender.org) and 3D printed using an Ultimaker 2+ Extended 3D printer (Ultimaker, Utrecht, Netherlands), see Figure 1. The fish’s water supply was maintained through a tube inserted into its mouth such that water flowed past the gills, down its flanks and drain through the bottom of the chamber. Water was drawn from a reservoir by two synchronized syringe pumps working in push/pull tandem. Anesthesia was maintained 35mg/L of Benzocaine to ensure long-term safe sedation. MRI scanning was performed on a 9.4T Bruker Avance with a 10 mm T/R volume coil (Bruker Biospin MRI GmbH, Ettlingen, Germany). T1 and T2 relaxation times were determined using a RARE-VTR sequence (T1 and T2: TE 10/30/50/70 ms, TR 1000/1282/1675/2333/5000 ms, NEX 16) in approximately 75 minutes (100x100 mm in plane resolution, 500 mm slice thickness). Further high-resolution scans (50x50μm in plane resolution, 200 or 500 μm slice thickness) were obtained with either MSME or RARE factor 2 scans, both TE/TR 14/1500ms. Gadolinium based contrast agent (Gadovist, 1.0 mmol/ml, Bayer, Berlin, Germany) was administered by either intraperitoneal (IP) injection (GDip; 5 ml; 0.5 mM), or by adding it to the fish tank water (0.03 mM, Gdswm) and allowing an individual animal to swim in it for >2 hours. Controls were IP injection of PBS (Cntrlip) or swimming in standard fish water (Cntrlswm). Post imaging the fish were recovered to ensure no harm was done during scanning. These fish were then sacrificed and fixed in paraformaldehyde. Magnitude image reconstruction was performed by Bruker Paravision 5.1 software. Brain regions of interest (ROI) were manually drawn by one of the authors for all image slices where brain tissue was observed. T1 and T2 maps were generated by fitting to mono-exponentials using a custom Matlab script (Mathworks, Natick, MA, USA). Any fitted T1 values > 7000 ms, T2 values > 300 ms or fit function derived r2 values < 0.98 were rejected. Statistical analysis was performed by one-way ANOVA and Bonferroni post-hoc test using Matlab.Results
Including the development of the chamber design 27 live zebrafish have been scanned with all but two successfully recovered. These two died due to miscalculation of anesthesia concentration. Images (RARE) at 50 mm in plane, 0.2 – 0.5 slice thickness were acquired in 30 – 90 min, see Figure 2. Images were comparable in quality to fixed fish, showing that motion artefacts or water passage did not affect image quality. T1 and T2 maps were obtained for both live zebrafish and the same fixed animals (n=14, see Figure 3). There was a significant reduction in brain T1 and T2 values for fish administered with GBCA compared to controls see Figures 4 and 5 respectively. Furthermore, T1 and T2 for Gdip was significantly lower than Gdswm (median ± IQR).T1(ms): Gdip 1166 ± 1036), Gdswm, 1428 ± 1386; Crtlip, 2656 ± 1357; Crtlswm, 2751 ± 2044.
T2(ms): Gdip 23 ± 5, Gdswm, 32 ± 8; Cnrtlip, 38 ± 9; Cnrtlswm, 33 ± 8.
Although, T1 and T2 values were significantly different for fixed vs live fish, similar changes in T1/T2 with GBCA administration method were found for the fixed fish.
Discussion
The MRI protocol allowed high resolution image acquisition of live zebrafish. The zebrafish chamber performs within design specifications and fish can be ready exchanged in few minutes. The chamber was easy, quick and cheap to produce allowing for replacement or disposal if required.to prevent disease transmission. IP administration requires technical expertise and the small volume used can lead to dosing variation. Treating fish with GBCA directly in water does not harm the animal and could provide a more regulated means of dosing.Acknowledgements
This work has been supported by a European Leukodystrophy Association fellowship (ELA 2016-012F4) and a University of Sheffield Alumni Fund: Flagship Institute Research Award.References
- Koth, J. et al. High-Resolution Magnetic Resonance Imaging of the Regenerating Adult Zebrafish Heart. Sci Rep 7, 2917, doi:10.1038/s41598-017-03050-y (2017).
- Merrifield, G. D. et al. Rapid and recoverable in vivo magnetic resonance imaging of the adult zebrafish at 7T. Magn Reson Imaging 37, 9-15, doi:10.1016/j.mri.2016.10.013 (2017).
- Kline, T. L. et al. Three-dimensional NMR microscopy of zebrafish specimens. NMR Biomed 32, e4031, doi:10.1002/nbm.4031 (2019).
- Nüsslein-Volhard, C. & Dahm, R. Zebrafish : a practical approach. 1st edn, (Oxford University Press, 2002).
Figures
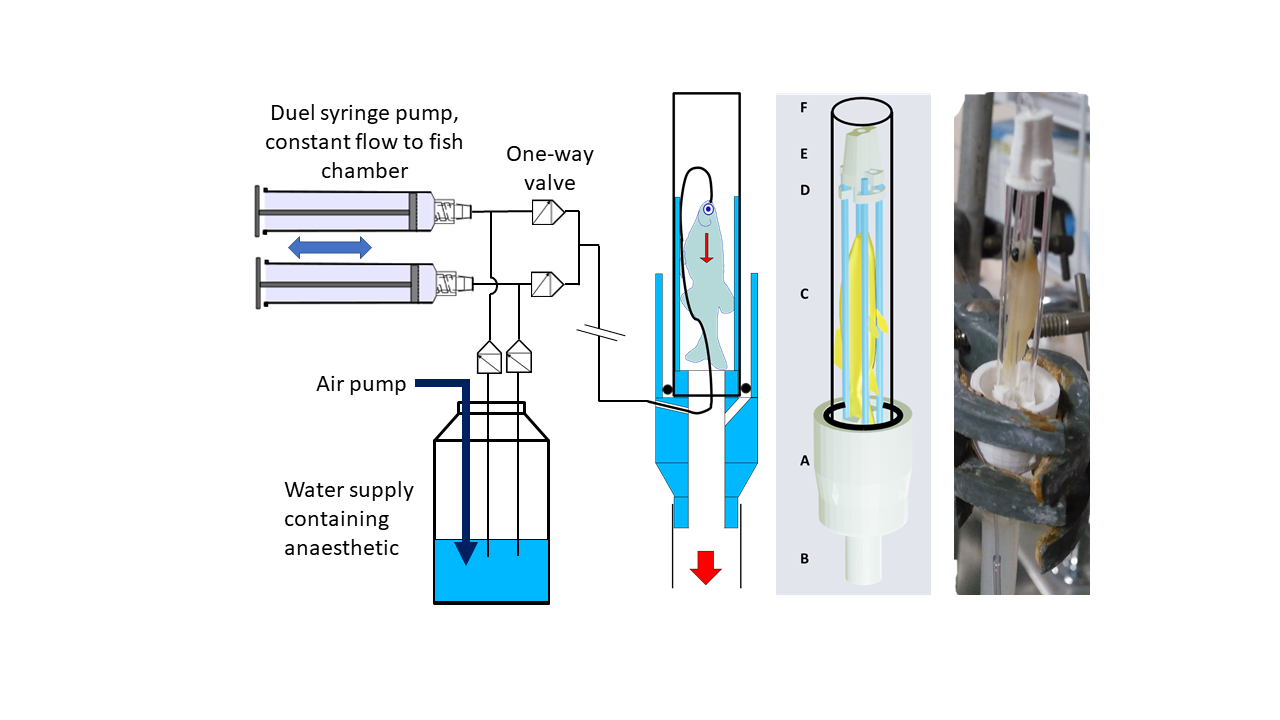
Figure 1: The fish life support
chamber composed of: main body (A), water drainage (B), four flexible fish
support rods (C), retaining plate (D). Water supply passes into the
fish’s mouth via a guide (E). Water tightness is made by a 10 mm glass NMR tube.
Two syringe pumps draw oxygenated water from a main reservoir that contains
anesthetic. The pumps work in tandem so that one is filling as the other
supplies water to the fish.
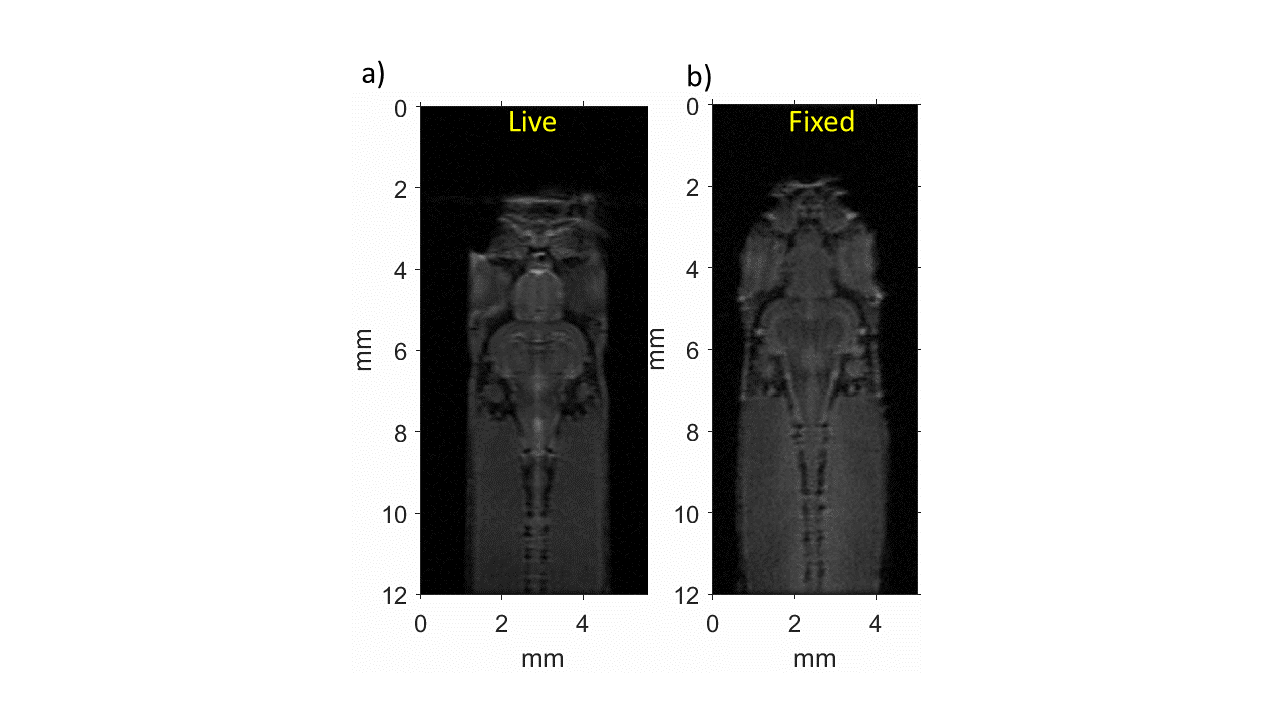
Figure 2: Representative spin
echo images from the same live (left) then fixed (right) zebrafish, with 50x50mm in
plane resolution, 200mm slice thickness, TE/TR 14/1500ms, NEX 64.FOV: live,
12x6mm 96 min scan; fixed, 12x5mm, 80 min scan.
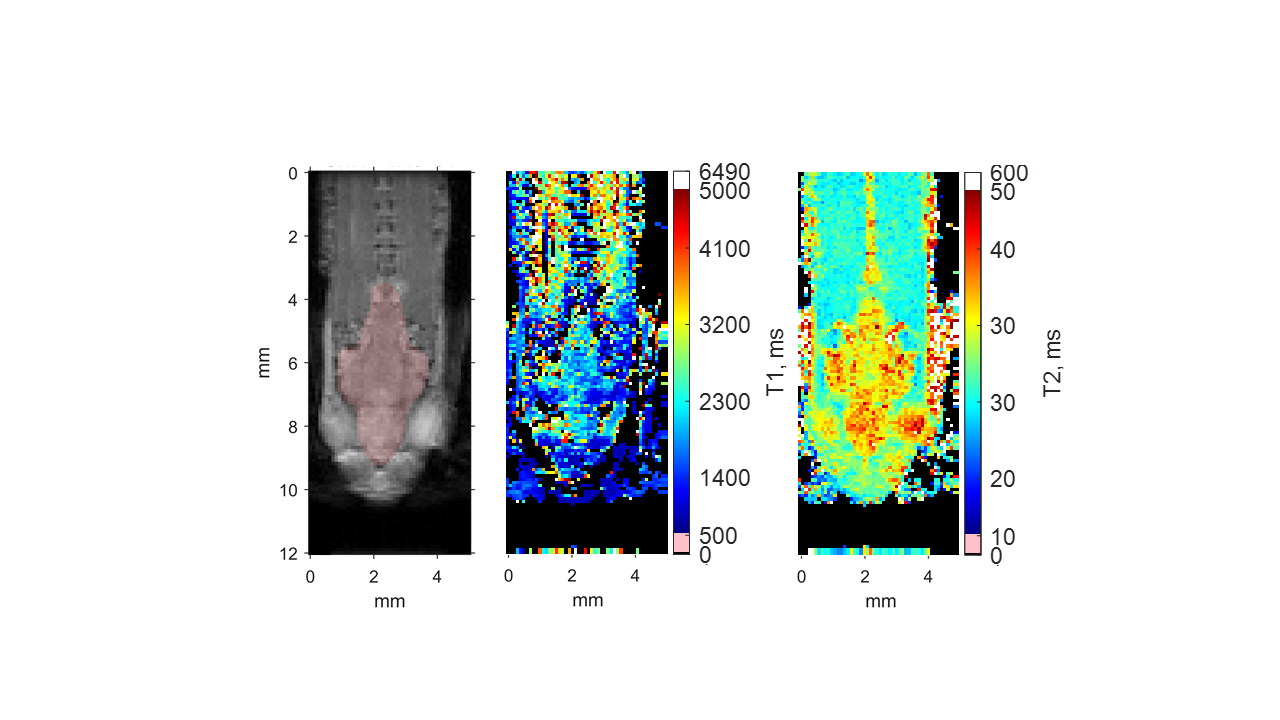
Figure 3: Example RARE-VTR images showing magnitude (left, TE = 10 ms,
TR 10000 s), T1 map (middle) and T2 map (right). The color bars to the right
of the T1 and T2 maps depict the range of values. For clarity, the color range
was restricted such that values greater than 5000 ms (T1) or 50 ms (T2) are all
set to white and values less than 500 ms (T1) or 10 ms (T2) are set to pink.
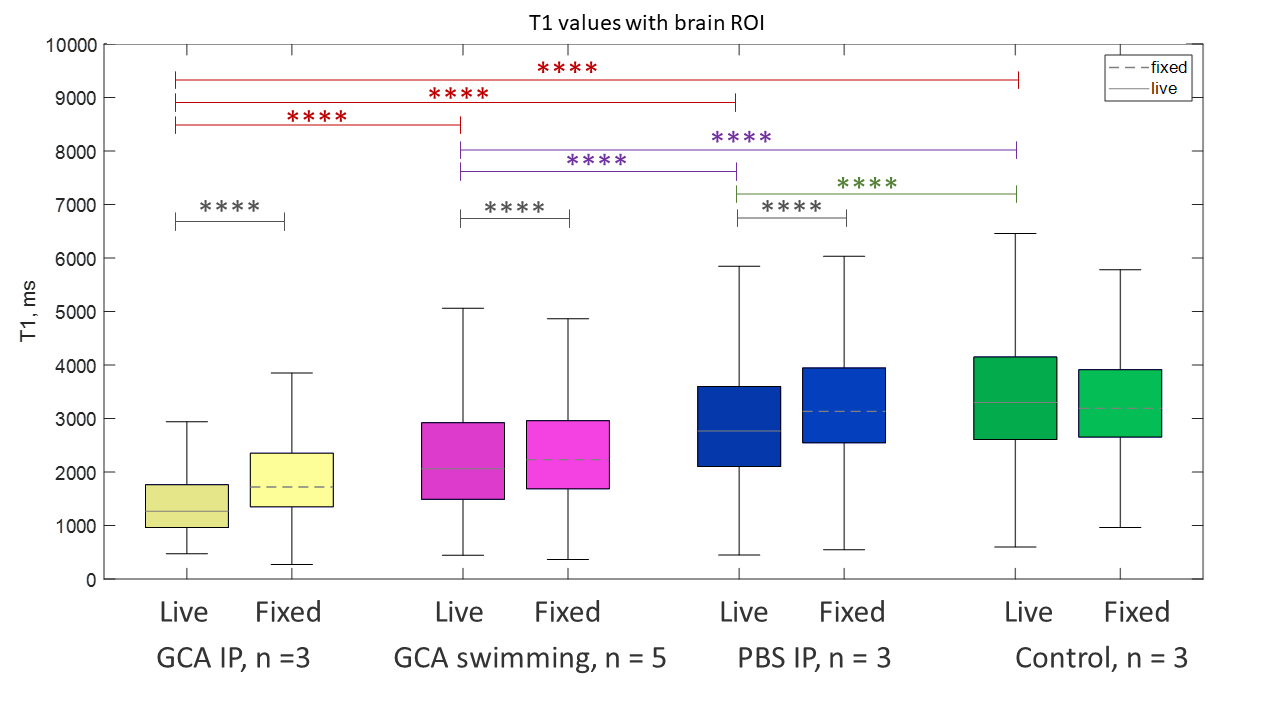
Figure 4: T1 values within the brain ROI of
live and fixed fish treated with gadolinium contrast agent (GCA) either, IP
injected or swimming in a solution of it. Controls received either an IP injection
of PBS or swimming in standard fish tank water. The boxplots show median and
interquartile range (IQR), with whisker located at 1.5*IQR. Outliers have been
removed for clarity. Horizontal bars show Bonferroni Post-hoc differences
between live fish (not shown for fixed fish). ****, p << 0.0001.
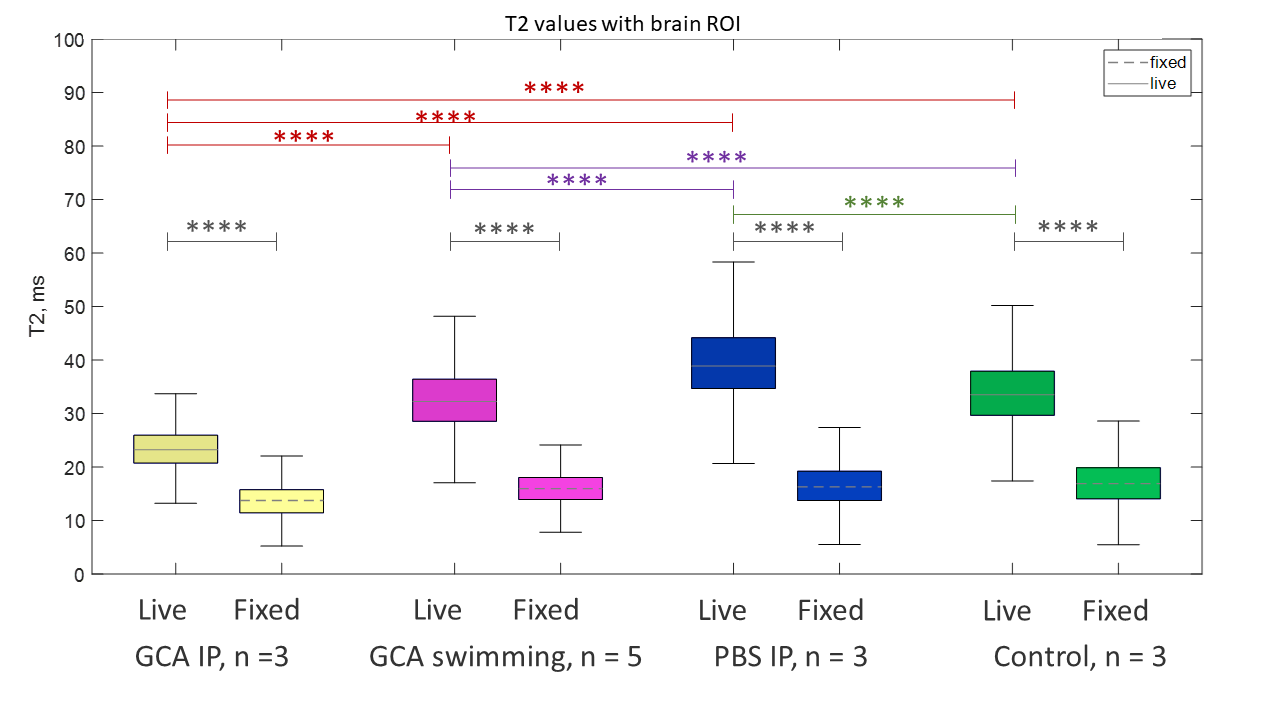
Figure 5: T2 values within the brain ROI of live and fixed fish
treated with gadolinium contrast agent (GCA) either, IP injected or swimming in
a solution of it. Controls received either an IP injection of PBS or swimming
in standard fish tank water. The boxplots show median and interquartile range
(IQR), with whisker located at 1.5*IQR. Outliers have been removed for clarity.
Horizontal bars show Bonferroni Post-hoc differences between live fish (not
shown for fixed fish). ****, p << 0.0001.
DOI: https://doi.org/10.58530/2022/2332