2330
Quantitative MR Imaging of Whole Intervertebral Disc: A Pre-Clinical Sample Study1Radiology, University of California San Diego, San Diego, CA, United States, 2Radiology Service, Veterans Affairs San Diego Healthcare System, San Diego, CA, United States, 3Orthopedic Surgery, University of California San Diego, San Diego, CA, United States
Synopsis
Quantitative MR imaging is a powerful tool for assessing biochemical changes in tissue. In this study, we propose to measure the transverse magnetization relaxation time, diffusivity, and magnetization transfer ratio for a whole intervertebral disc (IVD), including the annulus fibrosis, cartilaginous endplate (CEP), and nucleus pulposus, on a 3T pre-clinical scanner. The sequence parameters were optimized for high resolution and high signal-to-noise ratio imaging and mapping, utilizing the high-performance gradient system on the pre-clinical scanner, and the echo times were sufficiently minimized to capture the fast-decaying CEP signals for all the quantitative imaging sequences.
Introduction
Degenerative intervertebral disc (IVD) disease has been recognized as a major component of spine pathology. With degeneration, the IVD undergoes changes to its biochemical composition and matrix integrity including collagen denaturation, proteoglycan loss and dehydration, as well as cartilaginous endplate (CEP) degradation/calcification (1). Quantitative MR imaging is a powerful tool for non-invasively assessing such biochemical changes in tissue. Studies have demonstrated that T1 is predominantly correlated to water content (2), T2 is sensitive to changes in collagen concentration and water content (2,3), T1ρ is related to proteoglycan content (3), magnetization transfer ratio (MTR) is dependent on collagen concentration and matrix integrity (4), and apparent diffusion coefficient (ADC) reflects molecular mobility and therefore microscopic changes in tissue organization (5,6). These quantitative MR imaging techniques have been successfully applied to evaluate changes resulting from disc degeneration or biomechanical loading and have shown promise in basic research and clinical use (2-7). However, these studies have mainly been focused on the nucleus pulposus (NP) or annulus fibrosis (AF); furthermore, many of the aforementioned quantitative MRI techniques have yet to be deployed in a study of the CEP. Because the CEP has a relatively short T2 relaxation time (i.e., ~15 ms), conventional sequences, especially on clinical scanners, are unable to detect sufficient CEP signal for imaging or quantification.In this study, we optimized the sequence parameters for high resolution mapping of T2, ADC, and MTR in the whole IVD utilizing the high-performance gradient system on a 3T Bruker scanner. The echo times (TEs) were sufficiently minimized to facilitate our capture of the fast-decaying CEP signals for all tested quantitative imaging sequences.
Methods
A human thoracic spine sample from a 62-year-old female donor was scanned on a Bruker 3T BioSpec MRI scanner at room temperature. A 40-mm diameter birdcage coil was used for radiofrequency (RF) transmission and signal reception. This pre-clinical scanner has a much higher maximum gradient amplitude (485 vs. 50 mT/m) and faster slew rate (~5000 vs. 200 mT/m/ms) than a typical clinical 3T scanner (e.g., GE MR 750). This allows for a much shorter gradient duration and therefore a much shorter echo time compared to what is available on the clinical 3T scanner.High resolution 3D imaging sequences including 3D Carr-Purcell-Meiboom-Gill (3D CPMG), stimulated echo diffusion weighted imaging (STE-DWI), and MT prepared gradient echo (MT-GRE) sequences were employed for volumetric parameter mapping of T2, ADC, and MTR, respectively. The sequence parameters of these three quantitative imaging sequences were as follows: (i) 3D CPMG: repetition time (TR)=1000 ms, 10 TEs ranging from 2.8 to 53.2 ms, echo spacing=5.6 ms, field of view (FOV)=24x32x30 mm3, matrix=160x214x60, bandwidth=200 kHz, number of excitations (nex)=8, and total scan time=28h 32min; (ii) 3D STE-DWI with a single echo acquisition in each TR: three different b values (i.e., 75, 249, and 647 s/mm2) on each of three orthogonal DWI directions, duration of each pulsed gradient to generate diffusion weighting=1.4 ms, mixing time (TM)=25 ms, TR/TE=850/9 ms, FOV=24x32x30 mm3, matrix=160x214x60, bandwidth=151.5 kHz, nex=2, and total scan time=31h 44min; (iii) 3D MT-GRE: MT preparation (a Fermi-shaped pulse, duration=8 ms and bandwidth=160 Hz) with two different flip angles (FAs) of 1500° (MT on) and 0° (MT off) and a frequency offset of 2 kHz, TR/TE = 50/2.2 ms, excitation FA=10°, FOV=24x32x30 mm3, matrix=240x320x60, bandwidth=100 kHz, nex=10, and total scan time=5h 20min.
For data analysis, the whole IVD was manually segmented into five regions: anterior AF, posterior AF, superior CEP, inferior CEP, and NP. Single exponential fitting was performed for both T2 and ADC mapping.
Results and Discussion
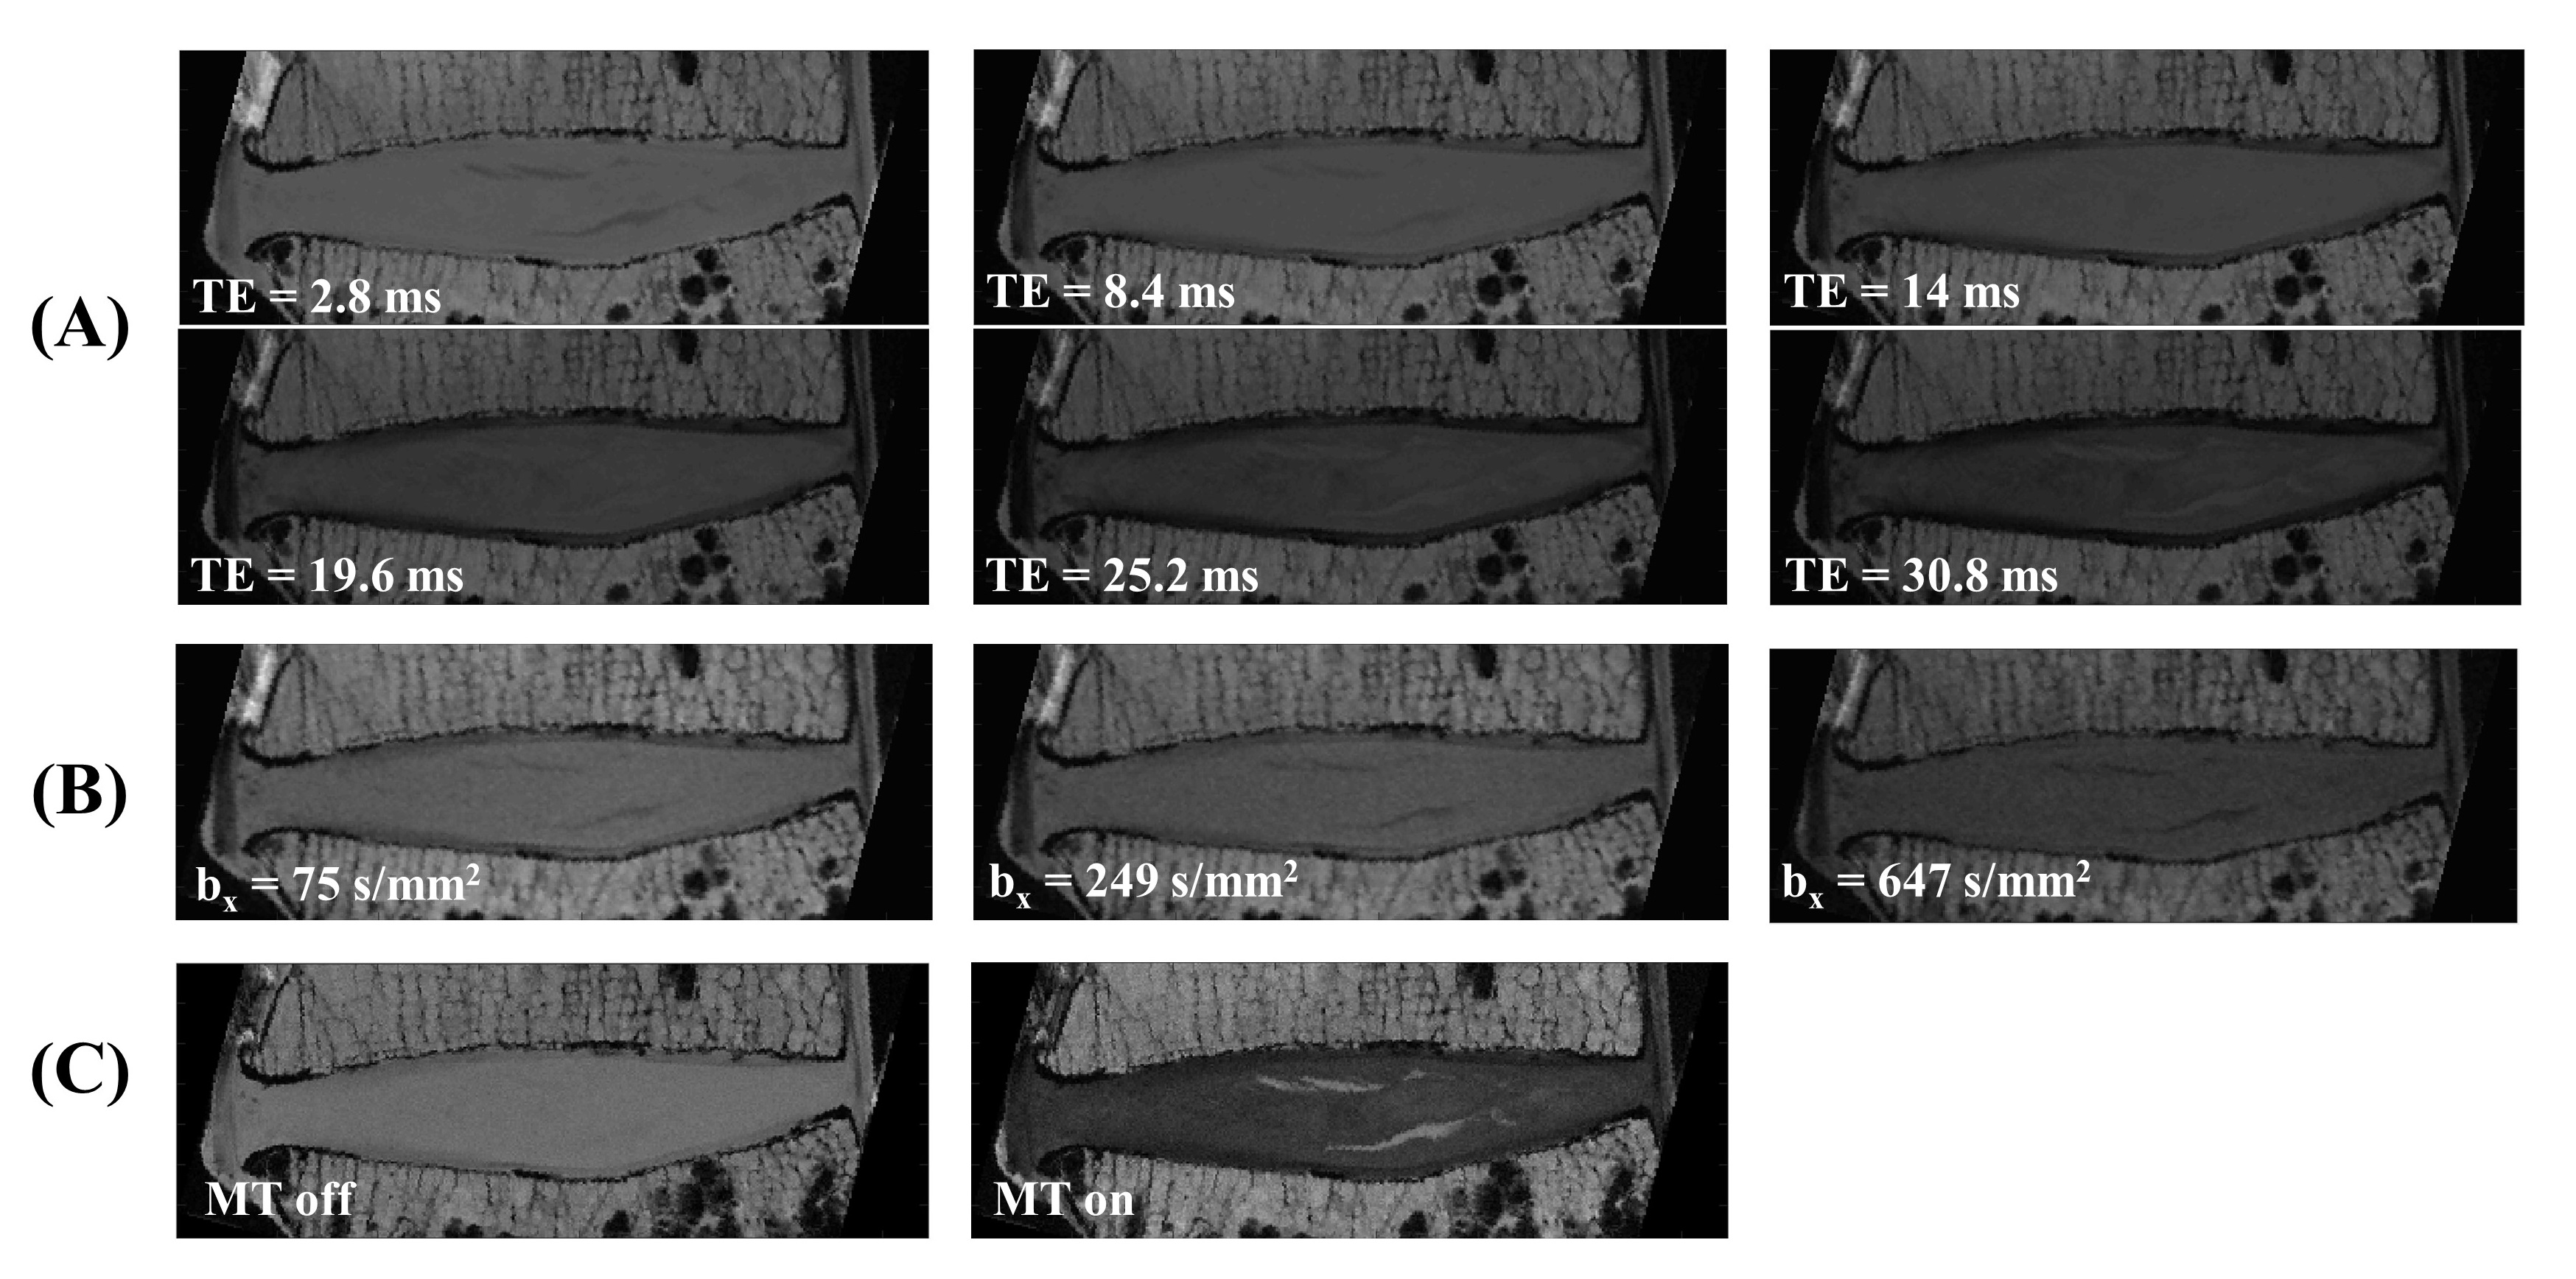
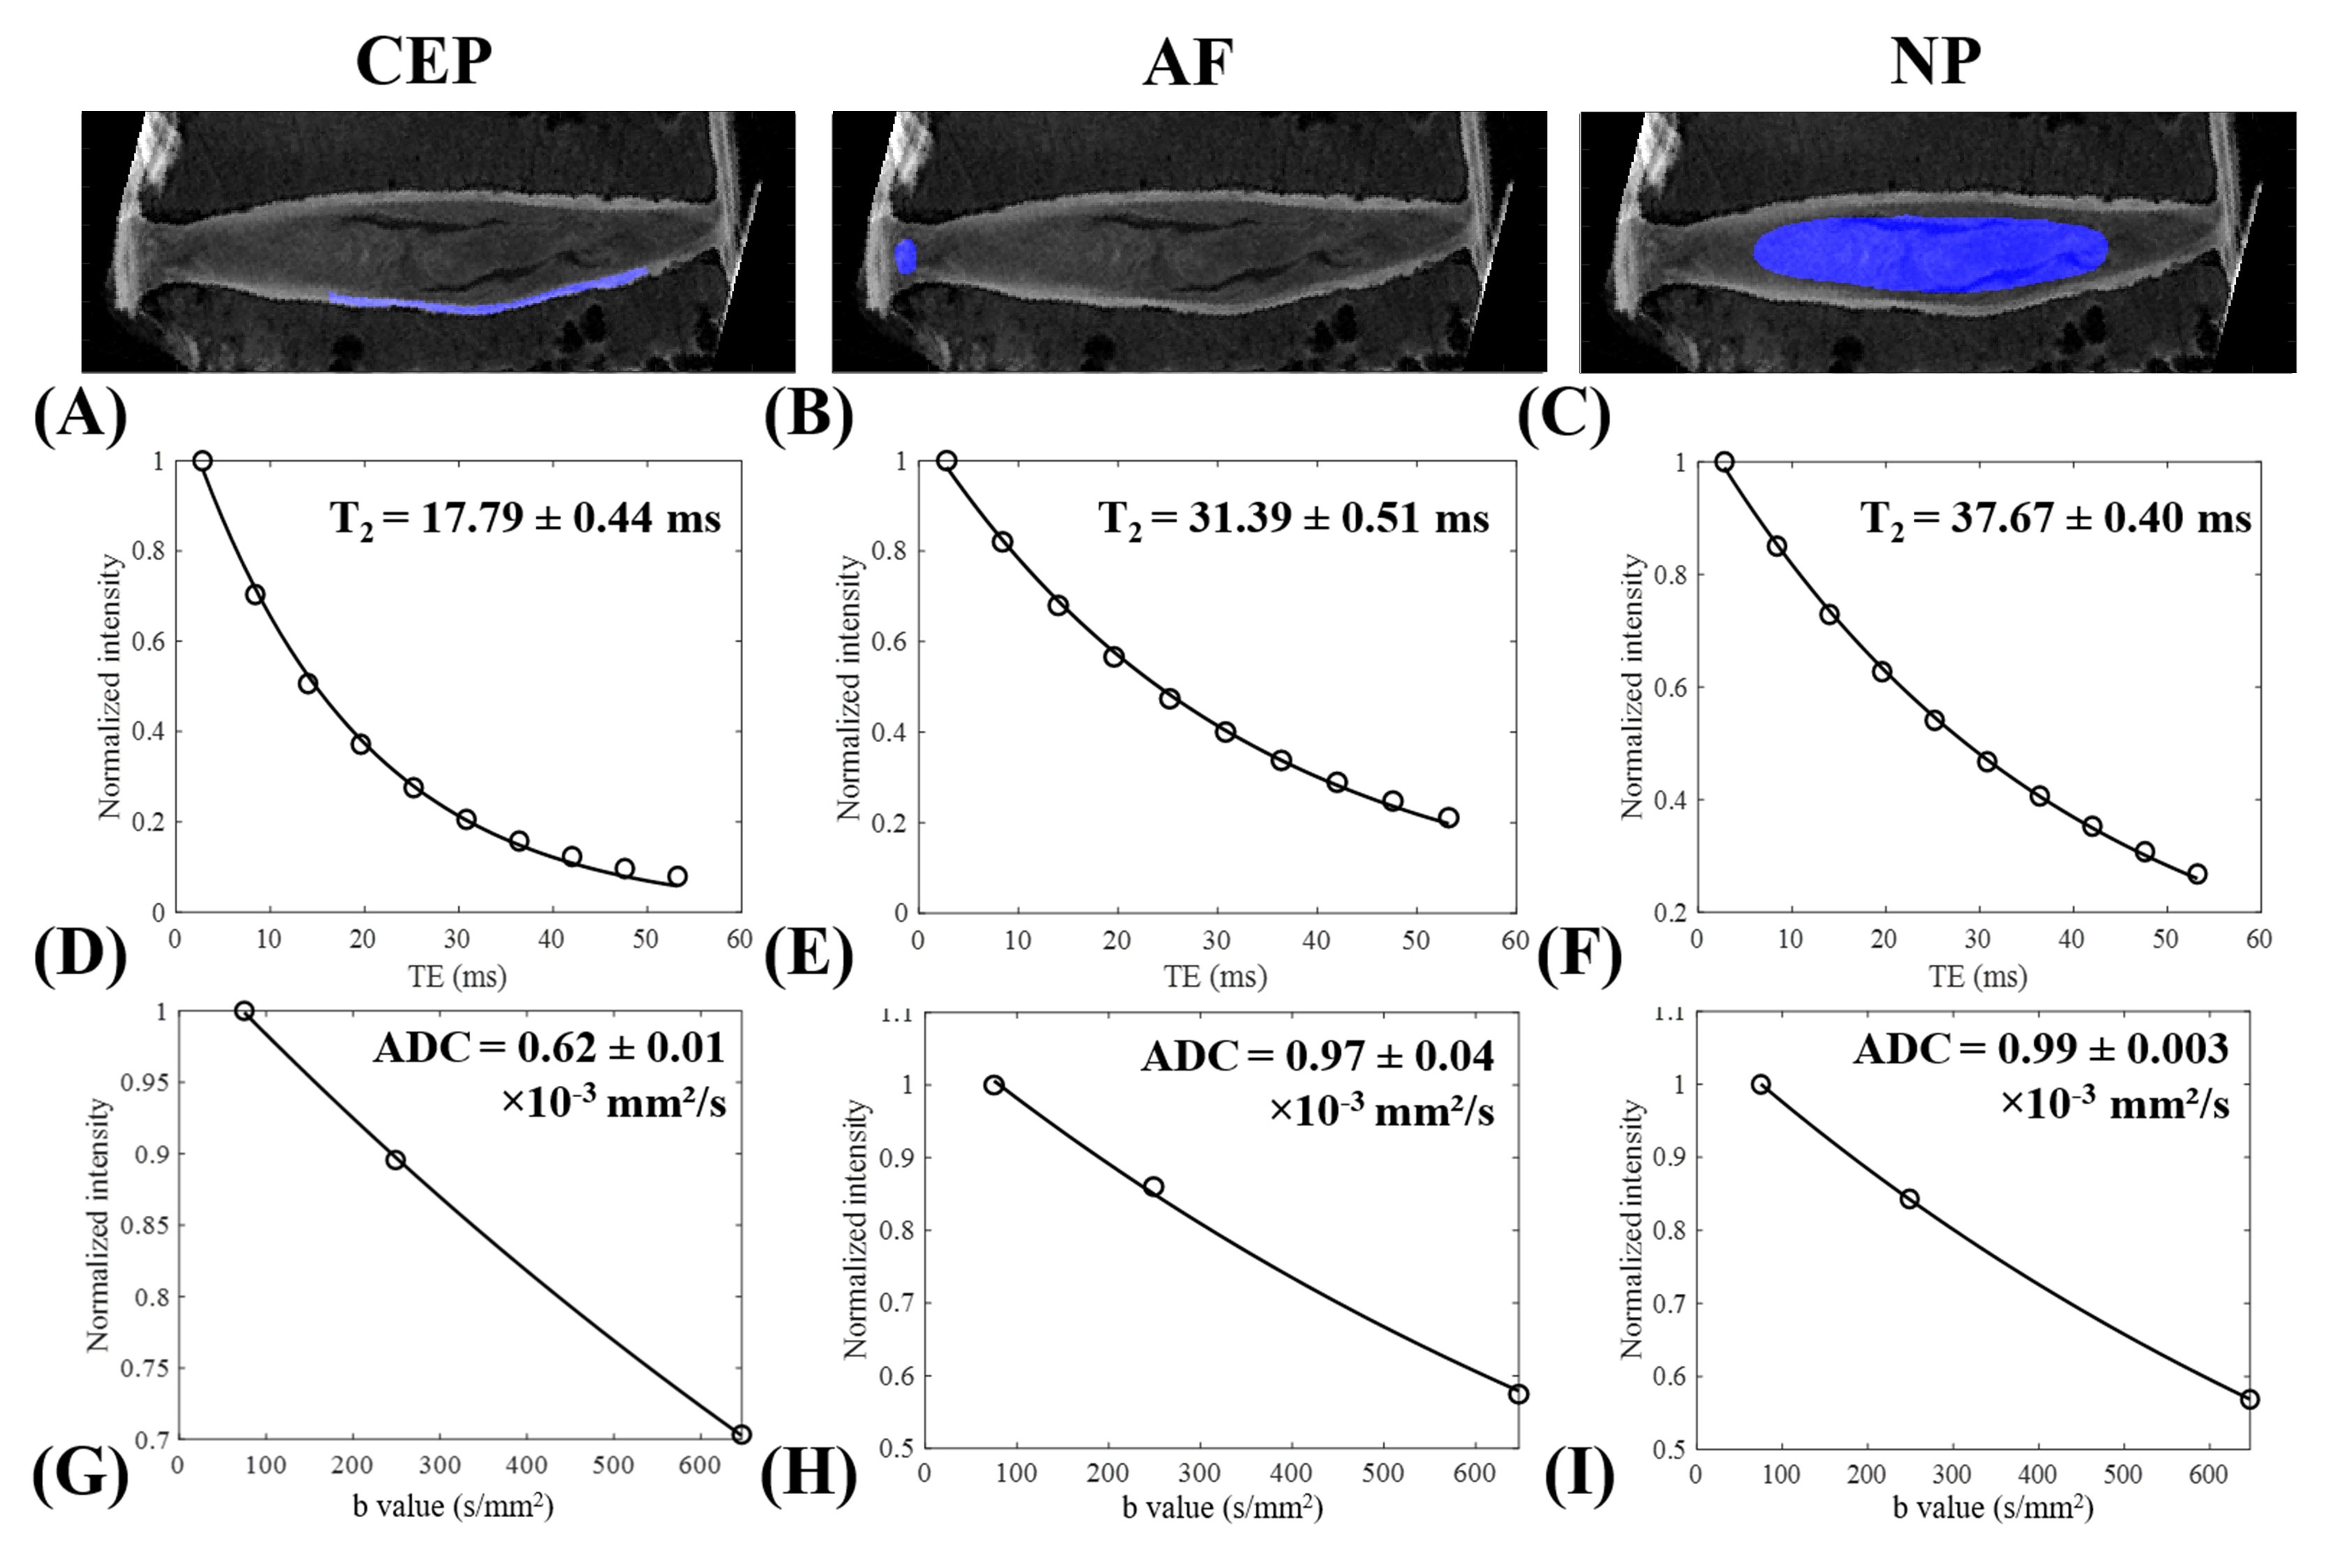
Figure 1 shows the representative 3D CPMG, STE-DWI, MT-GRE images for the spine sample. As seen in Figure 1A, the CEP signal decayed much faster than either the AF or NP signal when TEs were longer, demonstrating how the CEP had a shorter T2 compared to both AF and NP.Figure 2 illustrates the representative fitting curves for both T2 and ADC (x-direction) mapping. All fitting curves were excellent. The CEP showed a much shorter T2 value (17.79 ms) compared with the AF (31.39 ms) and NP (37.67 ms). The CEP also displayed a much lower ADC (0.62×10⁻³ mm²/s) compared with the AF (0.97×10⁻³ mm²/s) and NP (0.99×10⁻³ mm²/s), indicating the complexity involved in adequately capturing its signal.
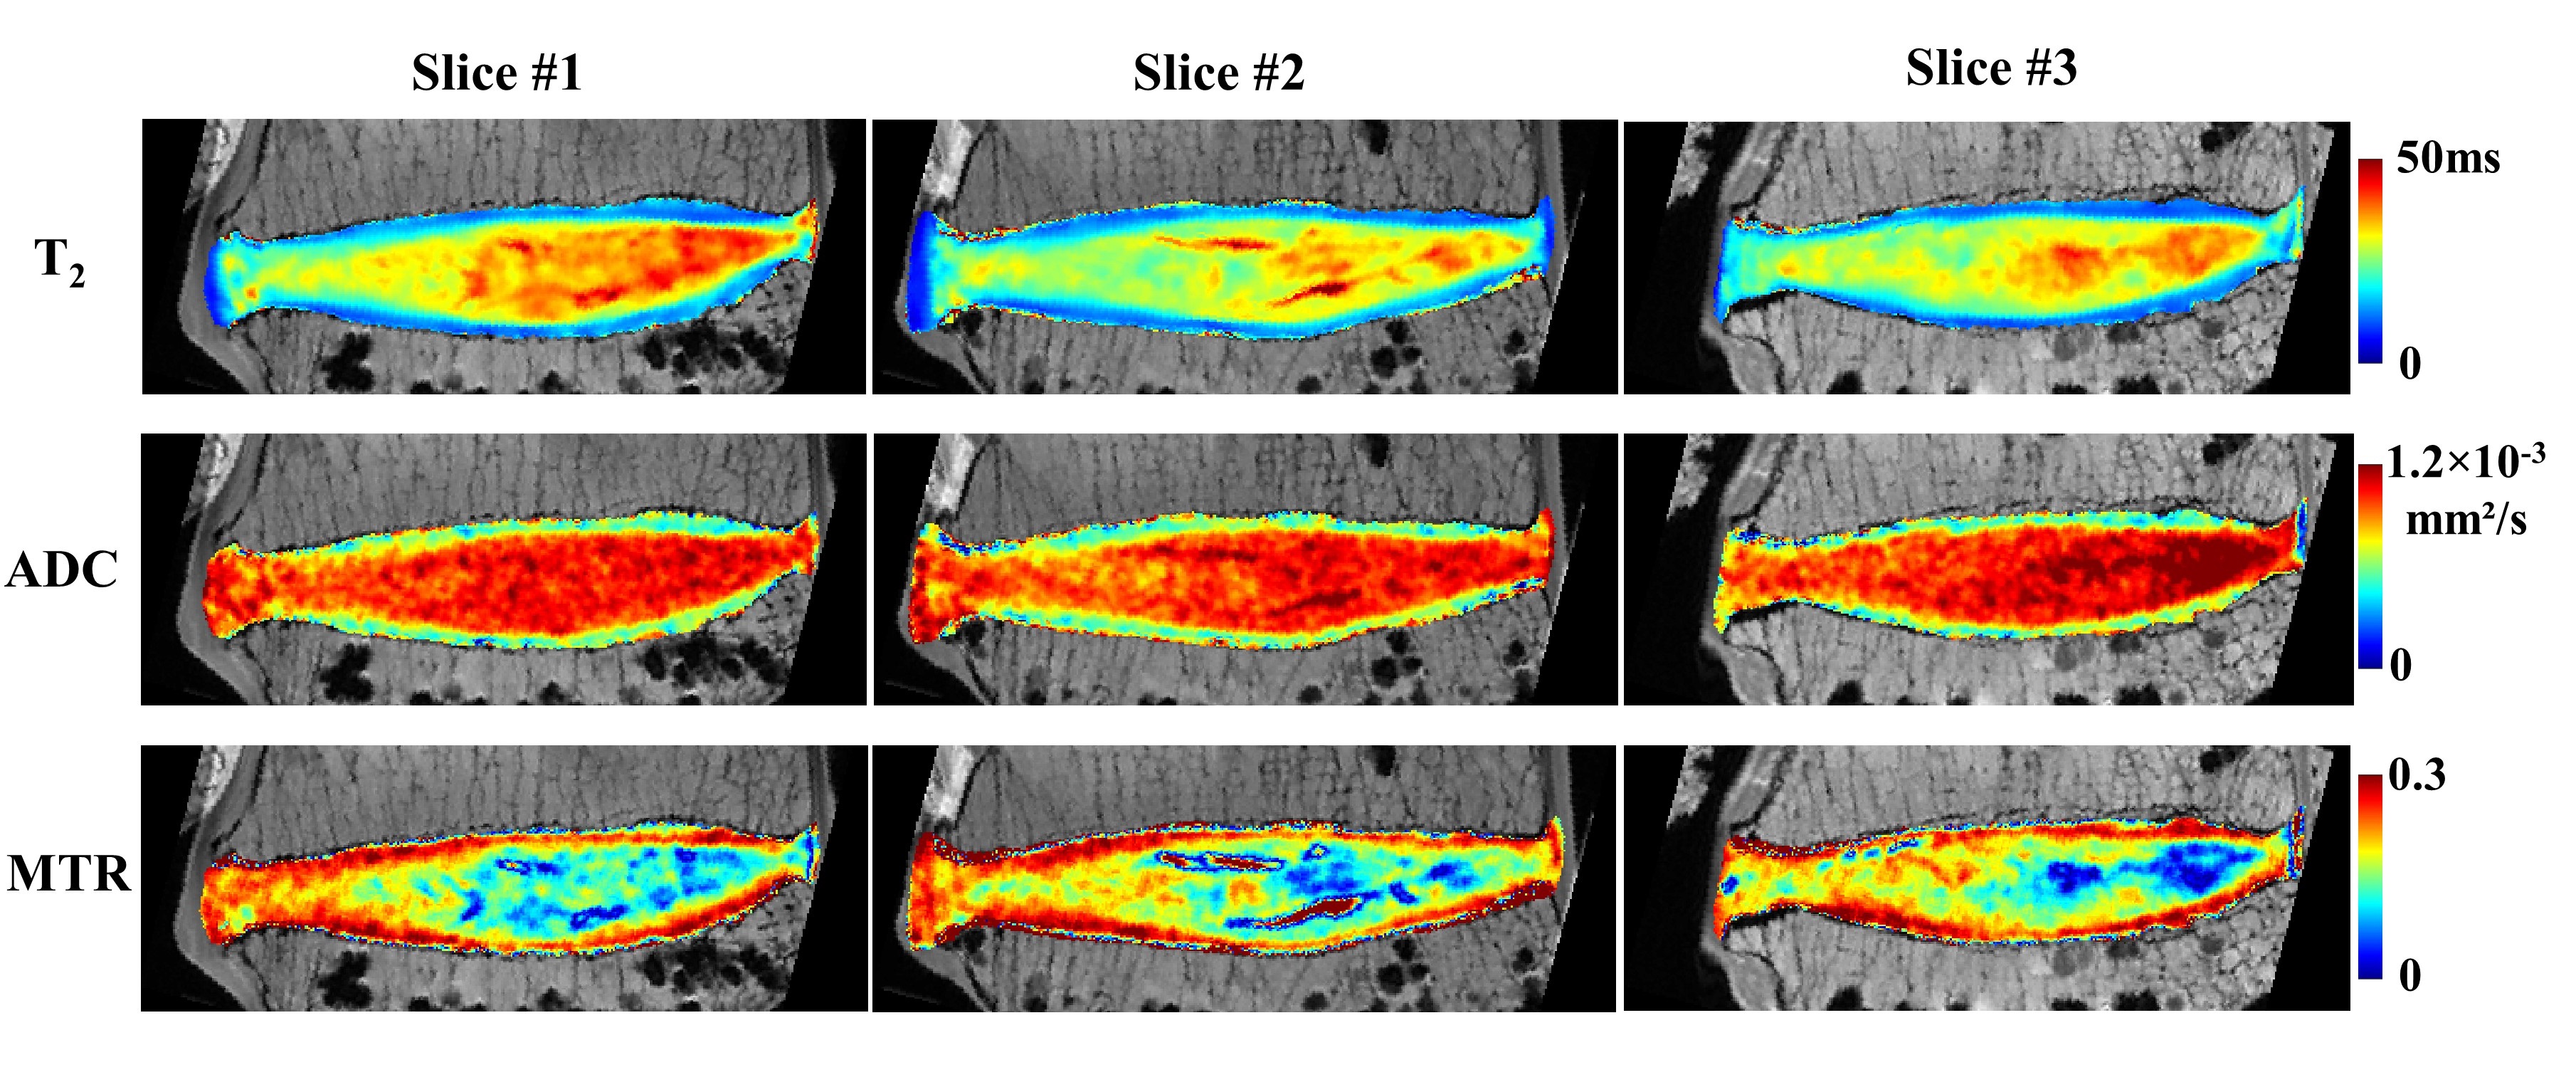
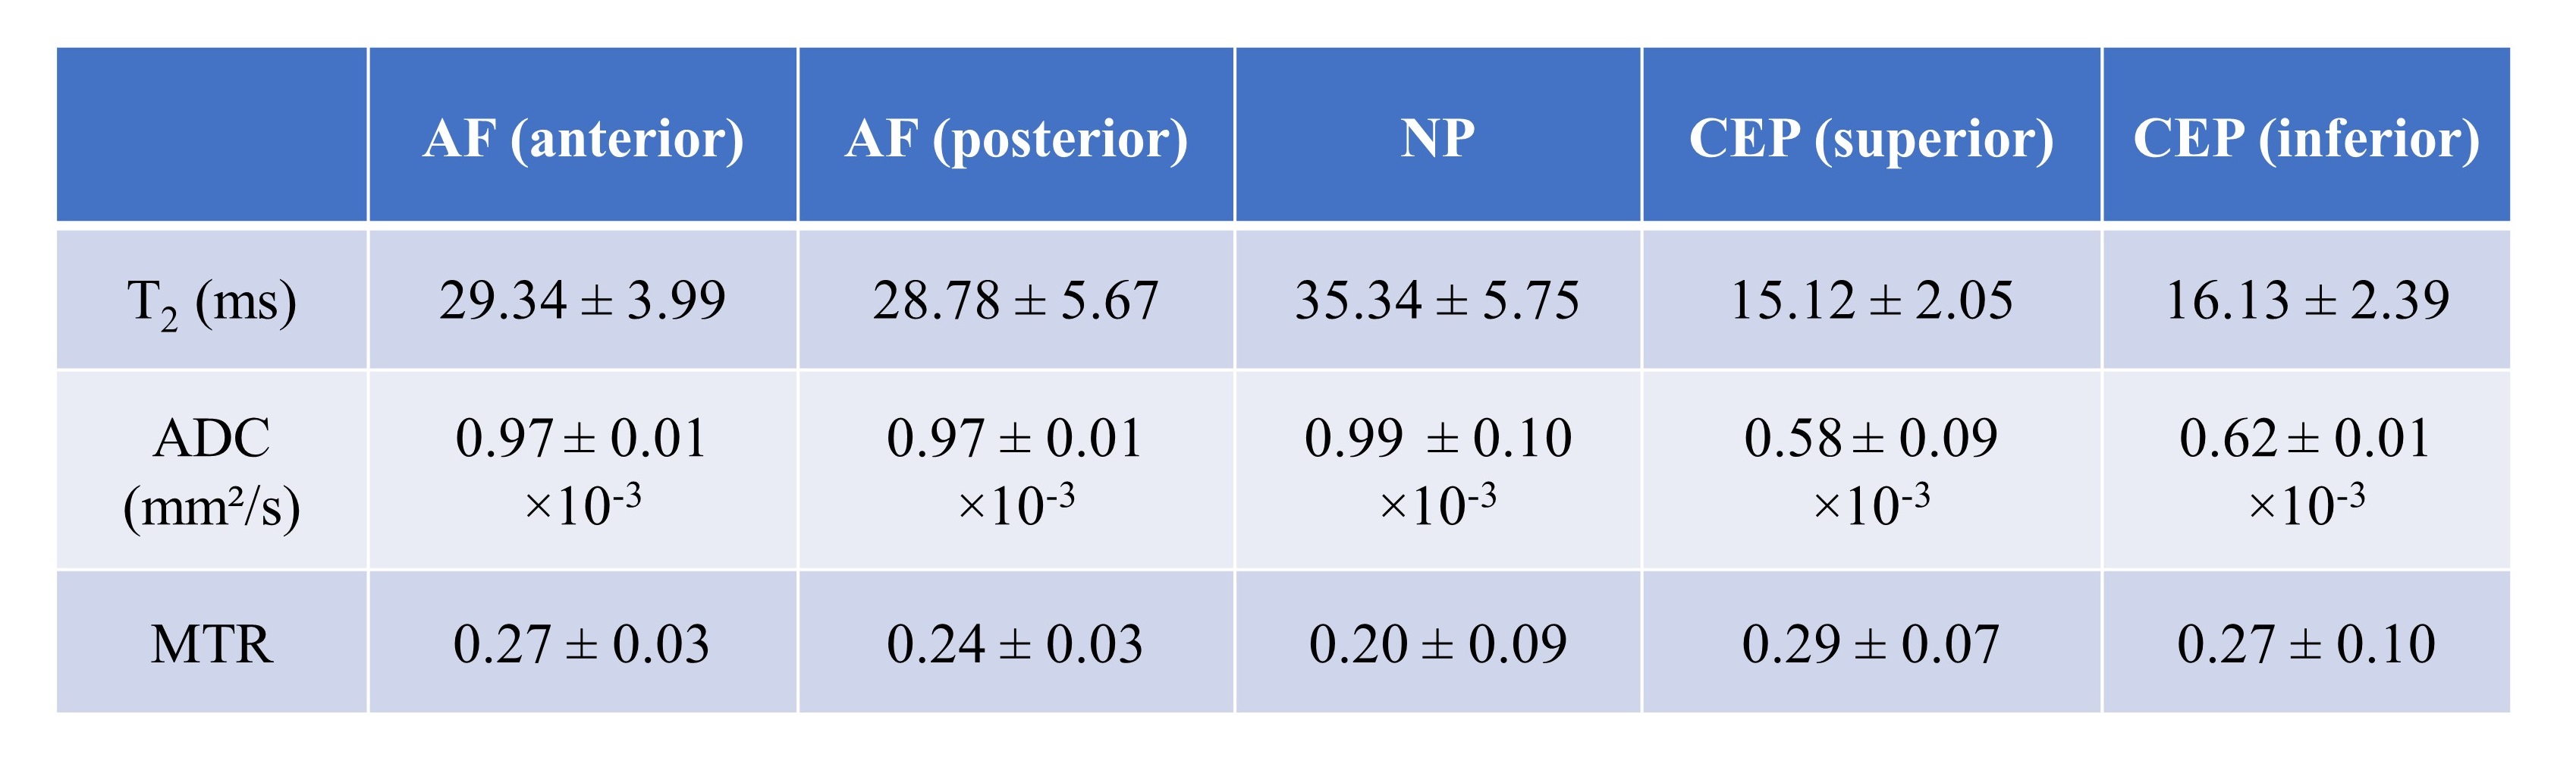
Figure 3 provides the representative T2, mean ADC (averaged in three directions), and MTR maps for three different disc slices. The quantitative values varied spatially, demonstrating discrepancies in biochemical composition across different disc regions. Table 1 summarizes the T2, mean ADC, and MTR values for the five different disc regions (i.e., anterior AF, posterior AF, NP, superior CEP, and inferior CEP). As seen from the results, the CEP had the shortest T2, lowest ADC, and highest MTR values in this IVD sample.
All these findings together imply that it is feasible to achieve a high-quality quantitative MR mapping of all major components in the IVD on a 3T Bruker scanner.
Conclusion
The optimized quantitative MR imaging sequences proposed in this study allowed for comprehensive evaluation of biochemical contents prevalent in human intervertebral disc on a 3T Bruker scanner. This high-quality parameter mapping provides useful reference standard for future basic research and clinical studies.Acknowledgements
The authors acknowledge grant support from the National Institutes of Health (R01AR062581, R01AR068987, R01AR075825, R01AR078877 and R21AR075851), VA Clinical Science and Rehabilitation Research and Development Services (Merit Awards I01CX001388 and I01RX002604), and GE Healthcare.References
1. Mwale F, Iatridis JC, Antoniou J. Quantitative MRI as a diagnostic tool of intervertebral disc matrix composition and integrity. European Spine Journal. 2008 Dec;17(4):432-40.
2. Antoniou J, Pike GB, Steffen T, Baramki H, Poole AR, Aebi M, Alini M. Quantitative magnetic resonance imaging in the assessment of degenerative disc disease. Magnetic resonance in medicine. 1998 Dec;40(6):900-7.
3. Blumenkrantz G, Zuo J, Li X, Kornak J, Link TM, Majumdar S. In vivo 3.0‐tesla magnetic resonance T1ρ and T2 relaxation mapping in subjects with intervertebral disc degeneration and clinical symptoms. Magnetic resonance in medicine. 2010 May;63(5):1193-200.
4. Wang C, Witschey W, Goldberg A, Elliott M, Borthakur A, Reddy R. Magnetization transfer ratio mapping of intervertebral disc degeneration. Magnetic resonance in medicine. 2010 Nov;64(5):1520-8.
5. Antoniou J, Demers CN, Beaudoin G, Goswami T, Mwale F, Aebi M, Alini M. Apparent diffusion coefficient of intervertebral discs related to matrix composition and integrity. Magnetic resonance imaging. 2004 Sep 1;22(7):963-72.
6. Beattie PF, Morgan PS, Peters D. Diffusion-weighted magnetic resonance imaging of normal and degenerative lumbar intervertebral discs: a new method to potentially quantify the physiologic effect of physical therapy intervention. journal of orthopaedic & sports physical therapy. 2008 Feb;38(2):42-9.
7. Chiu EJ, Newitt DC, Segal MR, Hu SS, Lotz JC, Majumdar S. Magnetic resonance imaging measurement of relaxation and water diffusion in the human lumbar intervertebral disc under compression in vitro. Spine. 2001 Oct 1;26(19):E437-44.
Figures