2328
Inhibition of GSK3 Activity Detected by Glycogen Synthase Activity from Proton MRS at 3T
Jeff Brender1, Shun Kishimoto1, Jeeva Munasinghe2, Helmutt Merkle2, Kota Yamashita1, Yasunori Otowa1, Kazutoshi Yamamoto1, and Murali Cherukuri Krishna1
1Radiation Biology Branch, NCI, Bethesda, MD, United States, 2NINDS, Bethesda, MD, United States
1Radiation Biology Branch, NCI, Bethesda, MD, United States, 2NINDS, Bethesda, MD, United States
Synopsis
Glycogen synthase kinase 3 (GSK3) has been tied as a critical factor in the development of multiple major diseases from cancer to Alzheimer’s, but drug development has been stymied by a lack of options to detect GSK3 activity in vivo. We show here that GSK3 activity can be measured accurately in vivo by following the production of glycogen from a single bolus of unlabeled glucose on a standard 3T preclinical imaging system. Imaging of glycogen synthesis was possible at 9.4T by CSI, where it was found in mice to be centered on the olfactory bulb, as expected from post-mortem analysis
Introduction
Glycogen synthase kinase-3 (GSK-3) controls the rate of glycogen synthesis by phosphorylating deactivating glycogen synthase. As the induction of glycogen synthesis or glycolysis is a crucial metabolic checkpoint in this process, GSK3 phosphorylates over 100 protein targets, usually targeting them for proteasomal degradation. In doing so it serves as a control point for many critical biochemical pathways, including the critical EGFR and mTORC pathways in cancer. Accordingly, GSK3 has attracted high interest as a possible drug target with some candidates advancing to Phase II clinical trials.[1,2] While radiolabeled analogs of some GSK3 inhibitors exist for PET imaging, there is not currently any method for evaluating GSK3 activity itself. Since the primary target of GSK3 is glycogen synthase, inhibition of GSK3 can in theory be followed by increases in the rate of glycogen synthesis. Along these lines, deuterium imaging of glycogen synthesis following a labeled glucose bolus has been proposed but abandoned due to the wide linewidths associated with deuterated glycogen.[3] We show here that GSK3 activity can be followed in vivo non-invasively by tracking glycogen synthesis by 1H MRS at 3T.Methods
For localized PRESS spectra, a standard 17 cm bore Bruker BioSpec 3T preclinical imaging system was used with a 3 mm x 3 mm x 3mm voxel size, a 2 second repetition time, a sweep width of 10 ppm, a 16 second or 97 second echo time (as indicated) and 512 FID points. The experiment was repeated 3000 times for a 100 minute acquisition time. Glucose was given as a 50 mg IV bolus except as indicated. 8 x 8 CSI experiments were acquired on a 9.4 T Biospec 94/30 horizontal scanner using a homebuilt head saddle coil with a 20 mm FOV and 6 mm slice thickness with a a 2 second repetition time, a sweep width of 10 ppm and 512 FID points. Low rank reconstruction to reduce noise was performed as in (3) using a rank of 5 (PRESS) or 5x8x8x10 (CSI)[4]Results
Figure 1 shows sequential PRESS spectra in a mouse brain after denoising for after the injection of a bolus of the indicated dosage for a 2 mm x 2 mm 2mm voxel. Analysis of the individual peaks shows a steady uptake of glucose (broad peak near 3.8 ppm) followed by a decrease suggestive of metabolism. This decrease is mirrored by an increase near 5.2 ppm, which is characteristic of glycogen. These changes were dose dependent and did not occur in a sham injection devoid of glucose.The results for localized spectroscopy encouraged us to try imaging, using a higher field (9.4T instead of 3T as in the previous experiments) to compensate for reduced signal averaging and greater linewidth. Figure 1 shows the evolution of spectra in the coronal plane after the injection of the glucose bolus. Although most peaks remain static, large changes in the intensity of a single peak at the glycogen position near 5.2 ppm are evident at the extreme anterior edge. This would localize glycogen synthesis form glucose near the olfactory bulb, in agreement with post mortem localization of glycogen synthase. A map of the time evolution of the 5.2 ppm peak shows it rapidly increases in intensity within the first 30 minutes before plateauing.
Having established that glycogen synthesis could be followed by proton MRS, we next tested the effect of the GSK3 inhibitor AZD-1080.One hour after an intravenous bolus of 25 mg of unlabeled glucose, the inhibitor was injected and the response followed by sequential PRESS spectra. As expected, the glucose peak near 3.8 ppm decreased with time as the characteristic peak of glycogen increased. The rate of change closely followed the concentration of AZD-1080. The method was sensitive enough to detect the activity of microgram quantities of AZD-1080.
Conclusion
Monitoring of glycogen synthesis by 1H MRS offers a sensitive and specific way of detecting the activity of GSK3 in a preclinical environmentAcknowledgements
No acknowledgement found.References
[1] P. Cohen, M. Goedert, GSK3 inhibitors: development and therapeutic potential, Nat Rev Drug Discov, 3 (2004) 479-487.[2] P. Cohen, S. Frame, The renaissance of GSK3, Nat Rev Mol Cell Biol, 2 (2001) 769-776.[3] H.M. De Feyter, M.A. Thomas, K.L. Behar, R.A. de Graaf, NMR visibility of deuterium-labeled liver glycogen in vivo, Magn Reson Med, 86 (2021) 62-68.[4] J.R. Brender, S. Kishimoto, H. Merkle, G. Reed, R.E. Hurd, A.P. Chen, J.H. Ardenkjaer-Larsen, J. Munasinghe, K. Saito, T. Seki, N. Oshima, K. Yamamoto, P.L. Choyke, J. Mitchell, M.C. Krishna, Dynamic Imaging of Glucose and Lactate Metabolism by (13)C-MRS without Hyperpolarization, Sci Rep, 9 (2019) 3410.Figures
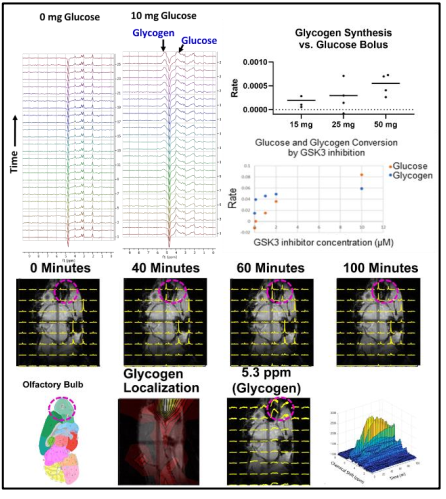
Figure 1 Top Glycogen synthesis and glucose consumption in a 3 x 3 x 3 mm voxel in a normal mouse brain by 1H MRS at 3T. Right glycogen synthesis rates as a function of the glucose bolus and glycogen synthesis from endogenous glucose as a function of the GSK3 inhibitor AZD-1080.The scan can currently be accomplished in roughly 10-20 minutes. Bottom: Localization of glycogen synthesis to the olfactory bulb at 9.4 T. Bottom left shows the kinetics and the SNR of a single voxel. Time resolution is two minutes.
DOI: https://doi.org/10.58530/2022/2328