2327
MR Spectroscopy of HP [1-13C]Pyruvate in an In Vitro Model of Epilepsy
Aditya Jhajharia1, Riccardo Serra2, Muznabanu Bachani2, Jemima Olu-Owotade2, Minjie Zhu1, Joshua Rogers1, Alexander Ksendzovsky2, and Dirk Mayer1
1Diagnostic Radiology and Nuclear Medicine, University of Maryland School of Medicine, Baltimore, MD, United States, 2Department of Neurosurgery, University of Maryland School of Medicine, Baltimore, MD, United States
1Diagnostic Radiology and Nuclear Medicine, University of Maryland School of Medicine, Baltimore, MD, United States, 2Department of Neurosurgery, University of Maryland School of Medicine, Baltimore, MD, United States
Synopsis
In this study, we investigated hyperpolarized (HP) magnetic resonance spectroscopy (MRS) as a means to identify differential lactate release in an in vitro model of epilepsy. When neurons are chronically activated, they increase LDHA expression and upregulate glycolysis as a means of cellular energy metabolism, thus increasing the production of lactate. Using MRS of HP [1-13C]pyruvate, we showed conversion to lactate in a chronic model of epilepsy. These results indicate that metabolic imaging of HP [1-13C]pyruvate can potentially be used as a tool to identify lactate elevations and thus the epileptic focus in epilepsy patients.
Introduction
Epilepsy impacts 70 million people worldwide. Despite medical therapy, thirty percent of patients continue to have seizures. In this group, continued seizures and polypharmacy have been associated with poor quality of life. As a result, these patients turn to neurosurgical management to achieve seizure control. Outcomes in epilepsy surgery are largely dependent on correctly identifying, mapping, and subsequently treating the epileptogenic focus (EF) or seizure onset zone. Previous studies have suggested upregulation of glycolysis within the EF. High rates of glucose metabolism, lactate dehydrogenase A (LDHA) activity, and lactate (Lac) production have all been linked to epileptic tissue in patients, animal models, and culture models1,2.We recently evaluated LDHA expression and markers of glycolysis in epileptic tissue and in an in vitro model of chronic epilepsy. We showed that when neurons are chronically activated, they increase LDHA expression and upregulate glycolysis as a means of cellular energy metabolism, thus increasing the production of Lac. These data thus suggest that Lac could be used as a biomarker to identify EF. As such, we hypothesize that magnetic resonance spectroscopy (MRS) of hyperpolarized (HP) [1‑13C]pyruvate (Pyr) can identify Lac release in an epilepsy model. Hyperpolarization enhances the 13C MR signal by a factor of up to five orders of magnitude, which allows for real time detection of metabolites in brain tumors 3,4, and other pathological processes, such as traumatic brain injury and stroke 5-7. As a first step, the goal of this study was to apply MRS of HP [1‑13C]Pyr to a chronic model of epilepsy to show expected elevations in Lac.
Materials and Methods
To establish an in vitro model of chronic epilepsy, cortical cells (approximately 1.6 million) were isolated from P1 rat pups and plated onto an Axion CytoView microelectrode array (MEA) plate (Axion Biosystems, Atlanta, GA). The cultures were treated daily with low Mg2+ medium for 2 hours for a total of 10 days. Cell cultures without addition of low Mg2+ were used as controls. Neuronal firing and bursting were measured. Oxygen consumption rate (OCR) and extracellular acidification rate (ECAR) were measured using Seahorse assay as a marker of Lac release (Agilent, MA).In vitro MRS studies (n = 5 for each low Mg2+ and control cells) were conducted utilizing a clinical 3 T GE 750w MRI scanner (GE Healthcare, Waukesha, WI, USA). 2 mL of approximately a 14-mM HP [1‑13C]Pyr solution was added to a 2-mL solution containing approximately 1×10⁷ cells. MR measurements were performed using a custom-built 13C surface coil used for both radiofrequency (RF) excitation and signal reception. Spectra were acquired with non-selective RF pulse excitation (32-µs duration) with a small flip angle of 5.6° at every 3 s for 80 scans. Lac-to-Pyr ratios were measured by the peak integral for the first 60 time points (180 s) of each metabolite's time-averaged spectrum and were compared in control vs. low Mg2+ cells.
Results and Discussion
In our study, we used MRS of HP [1-13C]Pyr to investigate pyruvate metabolism of cells treated with 10 days of daily low Mg2+ stimulation compared to untreated controls. As expected, low Mg2+ treatment led to a twofold increase in neuronal burst frequency with a return to baseline neuronal firing after washout (Fig. 1). There was no change in burst frequency in controls (Fig. 1). The chronic elevations in neural activity led to an upregulation of neuronal LDHA (Fig. 2a) and a subsequent shift towards increased neuronal glycolysis, marked by elevated Lac production (Fig. 2b). Representative 13C spectra from treated and control cell solutions indicate increased conversion of Pyr to Lac for the low Mg2+ cells (Fig. 3). Summary statistics in Fig. 4 showed the mean value Lac-to-Pyr ratio normalized to cell count was higher for low-Mg2+ compared to control cells: 7.34×10⁻⁴ ± 2.21×10‑4 (SD) vs 2.35×10⁻⁴ ± 1.04×10⁻⁴ (p = 0.016). These studies demonstrate that MRS of HP [1‑13C]Pyr can successfully detect elevated conversion of Pyr to Lac in an in vitro model of chronic epilepsy.Conclusions
In this study, we showed that MRS of HP [1-13C]Pyr can accurately identify the elevated lactate over pyruvate level in a low Mg2+ in vitro model of epilepsy, suggesting its potential to identify the EF. In future studies, we plan to validate this technique in vivo in hopes of using it as a clinical tool to guide EF resection.Acknowledgements
This work was supported by NIH grants R01 DK106395, R21 CA213020, R21 CA202694, R21 NS096575.References
- Dufour F, Koning E, Nehlig A. Basal levels of metabolic activity are elevated in Genetic Absence Epilepsy Rats from Strasbourg (GAERS): measurement of regional activity of cytochrome oxidase and lactate dehydrogenase by histochemistry. Experimental neurology. 2003;182(2):346-52.
- Hill RA, Chiappa KH, Huang‐Hellinger F, Jenkins BG. Hemodynamic and metabolic aspects of photosensitive epilepsy revealed by functional magnetic resonance imaging and magnetic resonance spectroscopy. Epilepsia. 1999;40(7):912-20.
- Gordon JW, Chen HY, Autry A, Park I, Van Criekinge M, Mammoli D, et al. Translation of Carbon‐13 EPI for hyperpolarized MR molecular imaging of prostate and brain cancer patients. Magnetic resonance in medicine. 2019;81(4):2702-9.
- Autry AW, Gordon JW, Carvajal L, Mareyam A, Chen HY, Park I, et al. Comparison between 8‐and 32‐channel phased‐array receive coils for in vivo hyperpolarized 13C imaging of the human brain. Magnetic resonance in medicine. 2019;82(2):833-41.
- DeVience SJ, Lu X, Proctor J, Rangghran P, Melhem ER, Gullapalli R, et al. Metabolic imaging of energy metabolism in traumatic brain injury using hyperpolarized [1-13 C] pyruvate. Scientific reports. 2017;7(1):1-7.
- Guglielmetti C, Chou A, Krukowski K, Najac C, Feng X, Riparip L-K, et al. In vivo metabolic imaging of Traumatic Brain Injury. Scientific reports. 2017;7(1):1-10.
- Hackett EP, Pinho MC, Harrison CE, Reed GD, Liticker J, Raza J, et al. Imaging Acute Metabolic Changes in Patients with Mild Traumatic Brain Injury Using Hyperpolarized [1- (13)C]Pyruvate. iScience. 2020;23(12):101885.
Figures

Fig 1. (a) Thirty-second raster plot (bottom) and histograms (top) of spiking activity in 16 electrode channels in single control well (green) and a single well treated with low Mg2+ (red). Low Mg2+ treatment results in a greater number of bursts. (b) During a single day of treatment, burst frequency increases from the pretreatment baseline (0 hours) to the end of the two-hour low Mg2+ treatment and returns to baseline following two hours of washout (n=12 wells, mean ± SEM). Control wells exhibit no change.
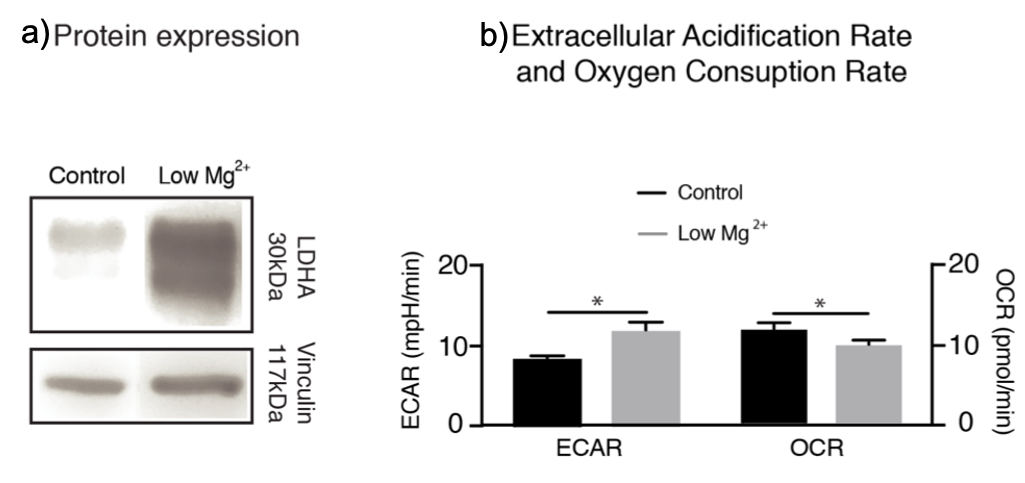
Fig. 2: a) LDHA protein expression is higher in cells from wells treated with low Mg2+. b) Average extracellular acidification (ECAR) from lactate and oxygen consumption rate (OCR) demonstrates an increase in ECAR and corresponding decrease in OCR in wells treated with low Mg2+, suggesting adaptation of a glycolytic phenotype in activated cells (*p < .05 unpaired t-test; mean ± SEM).
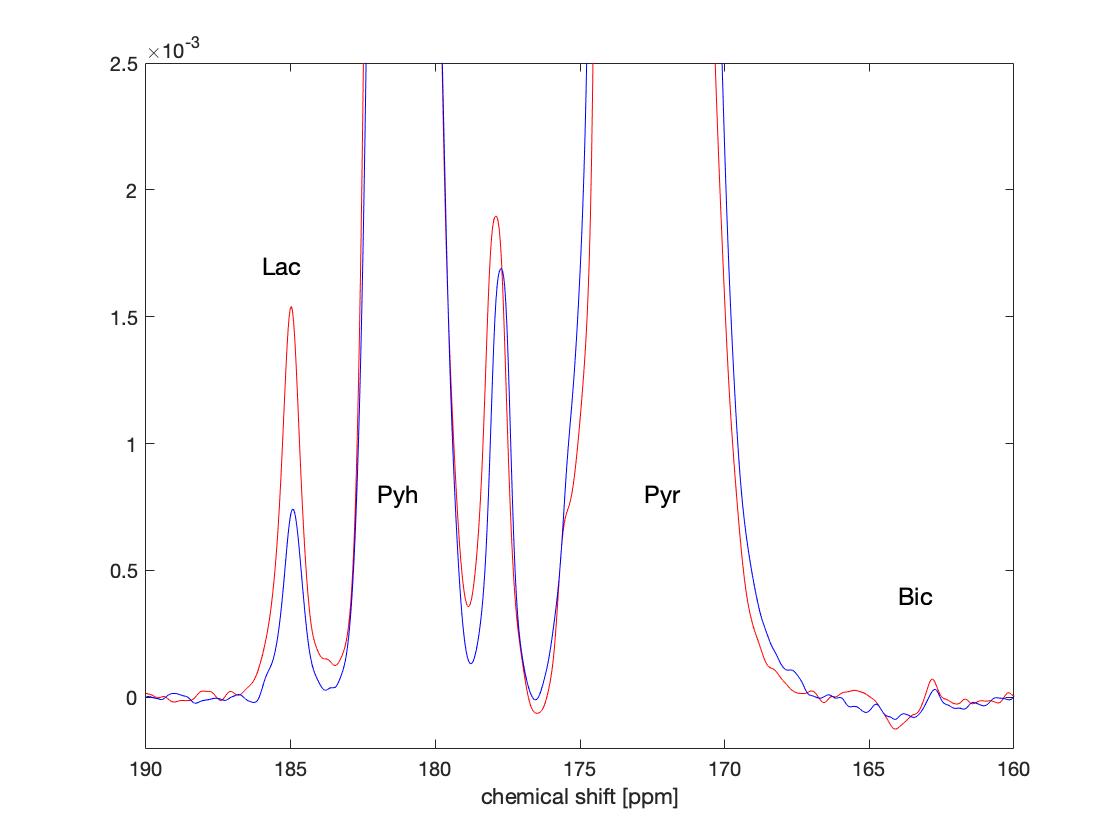
Fig. 3: The hyperpolarized 13C signal at ambient temperature after dissolution. Blue and red spectra correspond measurements in solutions containing control and low Mg2+ cells, respectively. Both spectra are normalized with respect to maximum Pyr signal. Cells treated with low Mg2+ show higher conversion of Pyr into Lac. In the spectra, Pyr, Lac, and bicarbonate (Bic) signals are at 172.8, 185, and 162.7 ppm, respectively. The peaks around 178 ppm are due to impurities in the substrate solution.
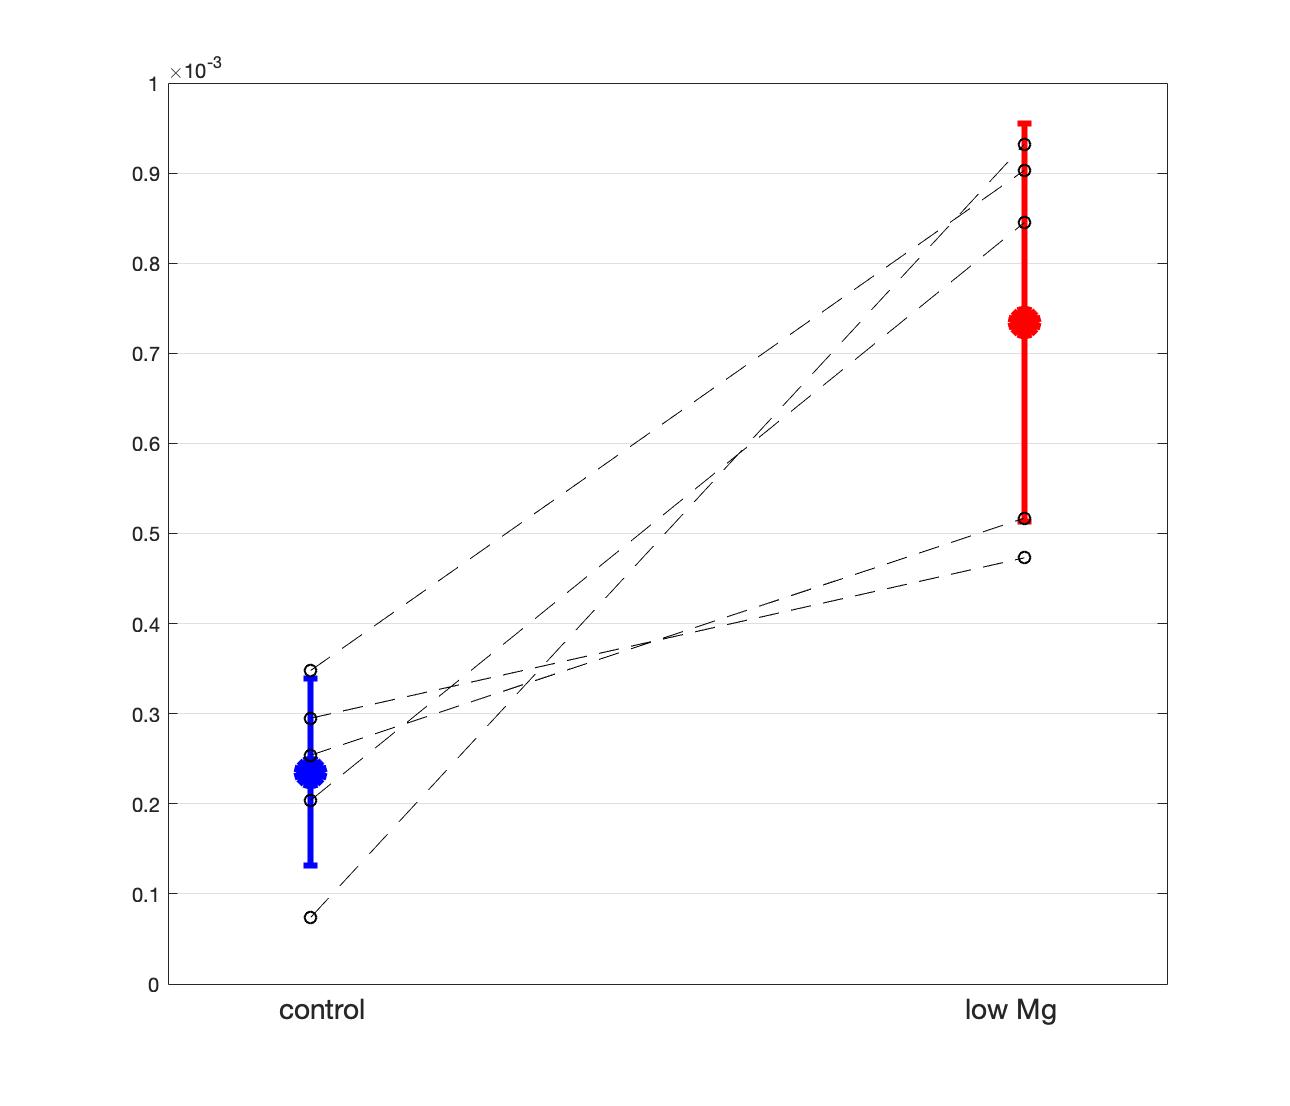
Fig. 4: Lac-to-Pyr ratios normalized to cell counts for control (blue) and low Mg2+ cells (red), respectively (n = 5 for each group). In solid red lines, the average Lac-to-Pyr ratio with the standard deviation for control (left) and treated (right) cells are shown (p= 0.016 using paired t-test). The black dotted lines identify pairs of control and treated cells that were measured in the same session with the same setup.
DOI: https://doi.org/10.58530/2022/2327