2320
Tracking disease progression in mouse models of polycystic kidney disease with high resolution MRI and automated postprocessing1Calico Life Sciences, South San Francisco, CA, United States
Synopsis
We present an improved MRI acquisition and data processing pipeline to assess disease progression in mouse models of polycystic kidney disease. High-resolution anatomical T2 weighted images as well as T2 mapping are used to track changes in kidney volume, cyst burden and tissue composition. We established versatile deep-learning automatic kidney segmentation, trained on a range of kidney disease stages, animal models and image resolutions.
Introduction
Autosomal Dominant Polycystic kidney disease (ADPKD) is rare disease caused by polycystin mutations and is characterized by the development of slowly growing fluid-filled cysts in both kidneys that can lead to end-stage renal disease. Since kidney function declines late in the disease process, total kidney volume has been approved as a surrogate endpoint for accelerated approval in autosomal dominant polycystic kidney disease. Preclinical MRI can accurately quantify kidney size and renal cyst development1,2. However, this requires high resolution MR images with sufficient contrast between cysts, kidney parenchyma and surrounding tissue. We have developed an imaging strategy to obtain high quality, high resolution anatomical MRI of mouse kidneys to enable accurate assessment of disease progression3. Here, we present further improvements on our data acquisition, post-processing, and automated analysis pipeline for high-resolution renal MRI in mouse models of PKD.Methods
All animal procedures were approved by the IACUC and followed AAALAC guidelines. Animals received a s.c. injection of 0.4 mg/kg atropine approx. 20 minutes before imaging to slow down peristaltic motion. Mice were anesthetized with isoflurane (2%) and kept at 37±0.5°C. Imaging was performed on a 9.4T Bruker BioSpec. Animals were placed supine, with their abdomen on a 4-channel cardiac array coil. We used a breathing-gated multi-TE RARE sequences with 28-46 slices to accommodate different kidney sizes. Data was acquired with a resolution of 125 × 125 × 300 μm3 or 167 x 167 x 300 μm3 and 6-8 repetitions. Acquisition time was 10-20 min, effective acquisition time with gating for breathing approx. 15-30 min. We performed MRI on healthy wildtype control mice and two models of PKD: Pkd1RC/RC mice4,5, a slowly progressing genetic model for autosomal dominant polycystic kidney disease, and a doxycycline-induced conditional knockout model for PKD1: Pkd1fl/fl;Pax8rtTA;TetO-cre (courtesy of the Peter Jackson lab at Stanford)5. Additionally, T2 maps were acquired to assess changes from healthy kidneys towards later disease stages, which are characterized by both volume growth as well as increase in cysts number and size (0.16×0.16×0.8 mm3, 5 slices, 10 TEs from 12.5 to 192.5 ms, TR=1.05s). We created a post-processing pipeline consisting of: registration of the repetitions to compensate for slow intestinal movement over time using elastix6, averaging registered images to increase SNR as reported before3, and a versatile deep-learning model based on a V-net7 architecture for automatic kidney segmentation. We trained the automatic segmentation model on over 300 datasets from wildtype mice and both PKD models. Datasets had different in-plane resolutions, numbers of slices and a large range of disease stages, from healthy to late-stage polycystic kidney disease. Segmentation masks were used for kidney volume measurement, cyst tracking and analysis of T2 maps.Results
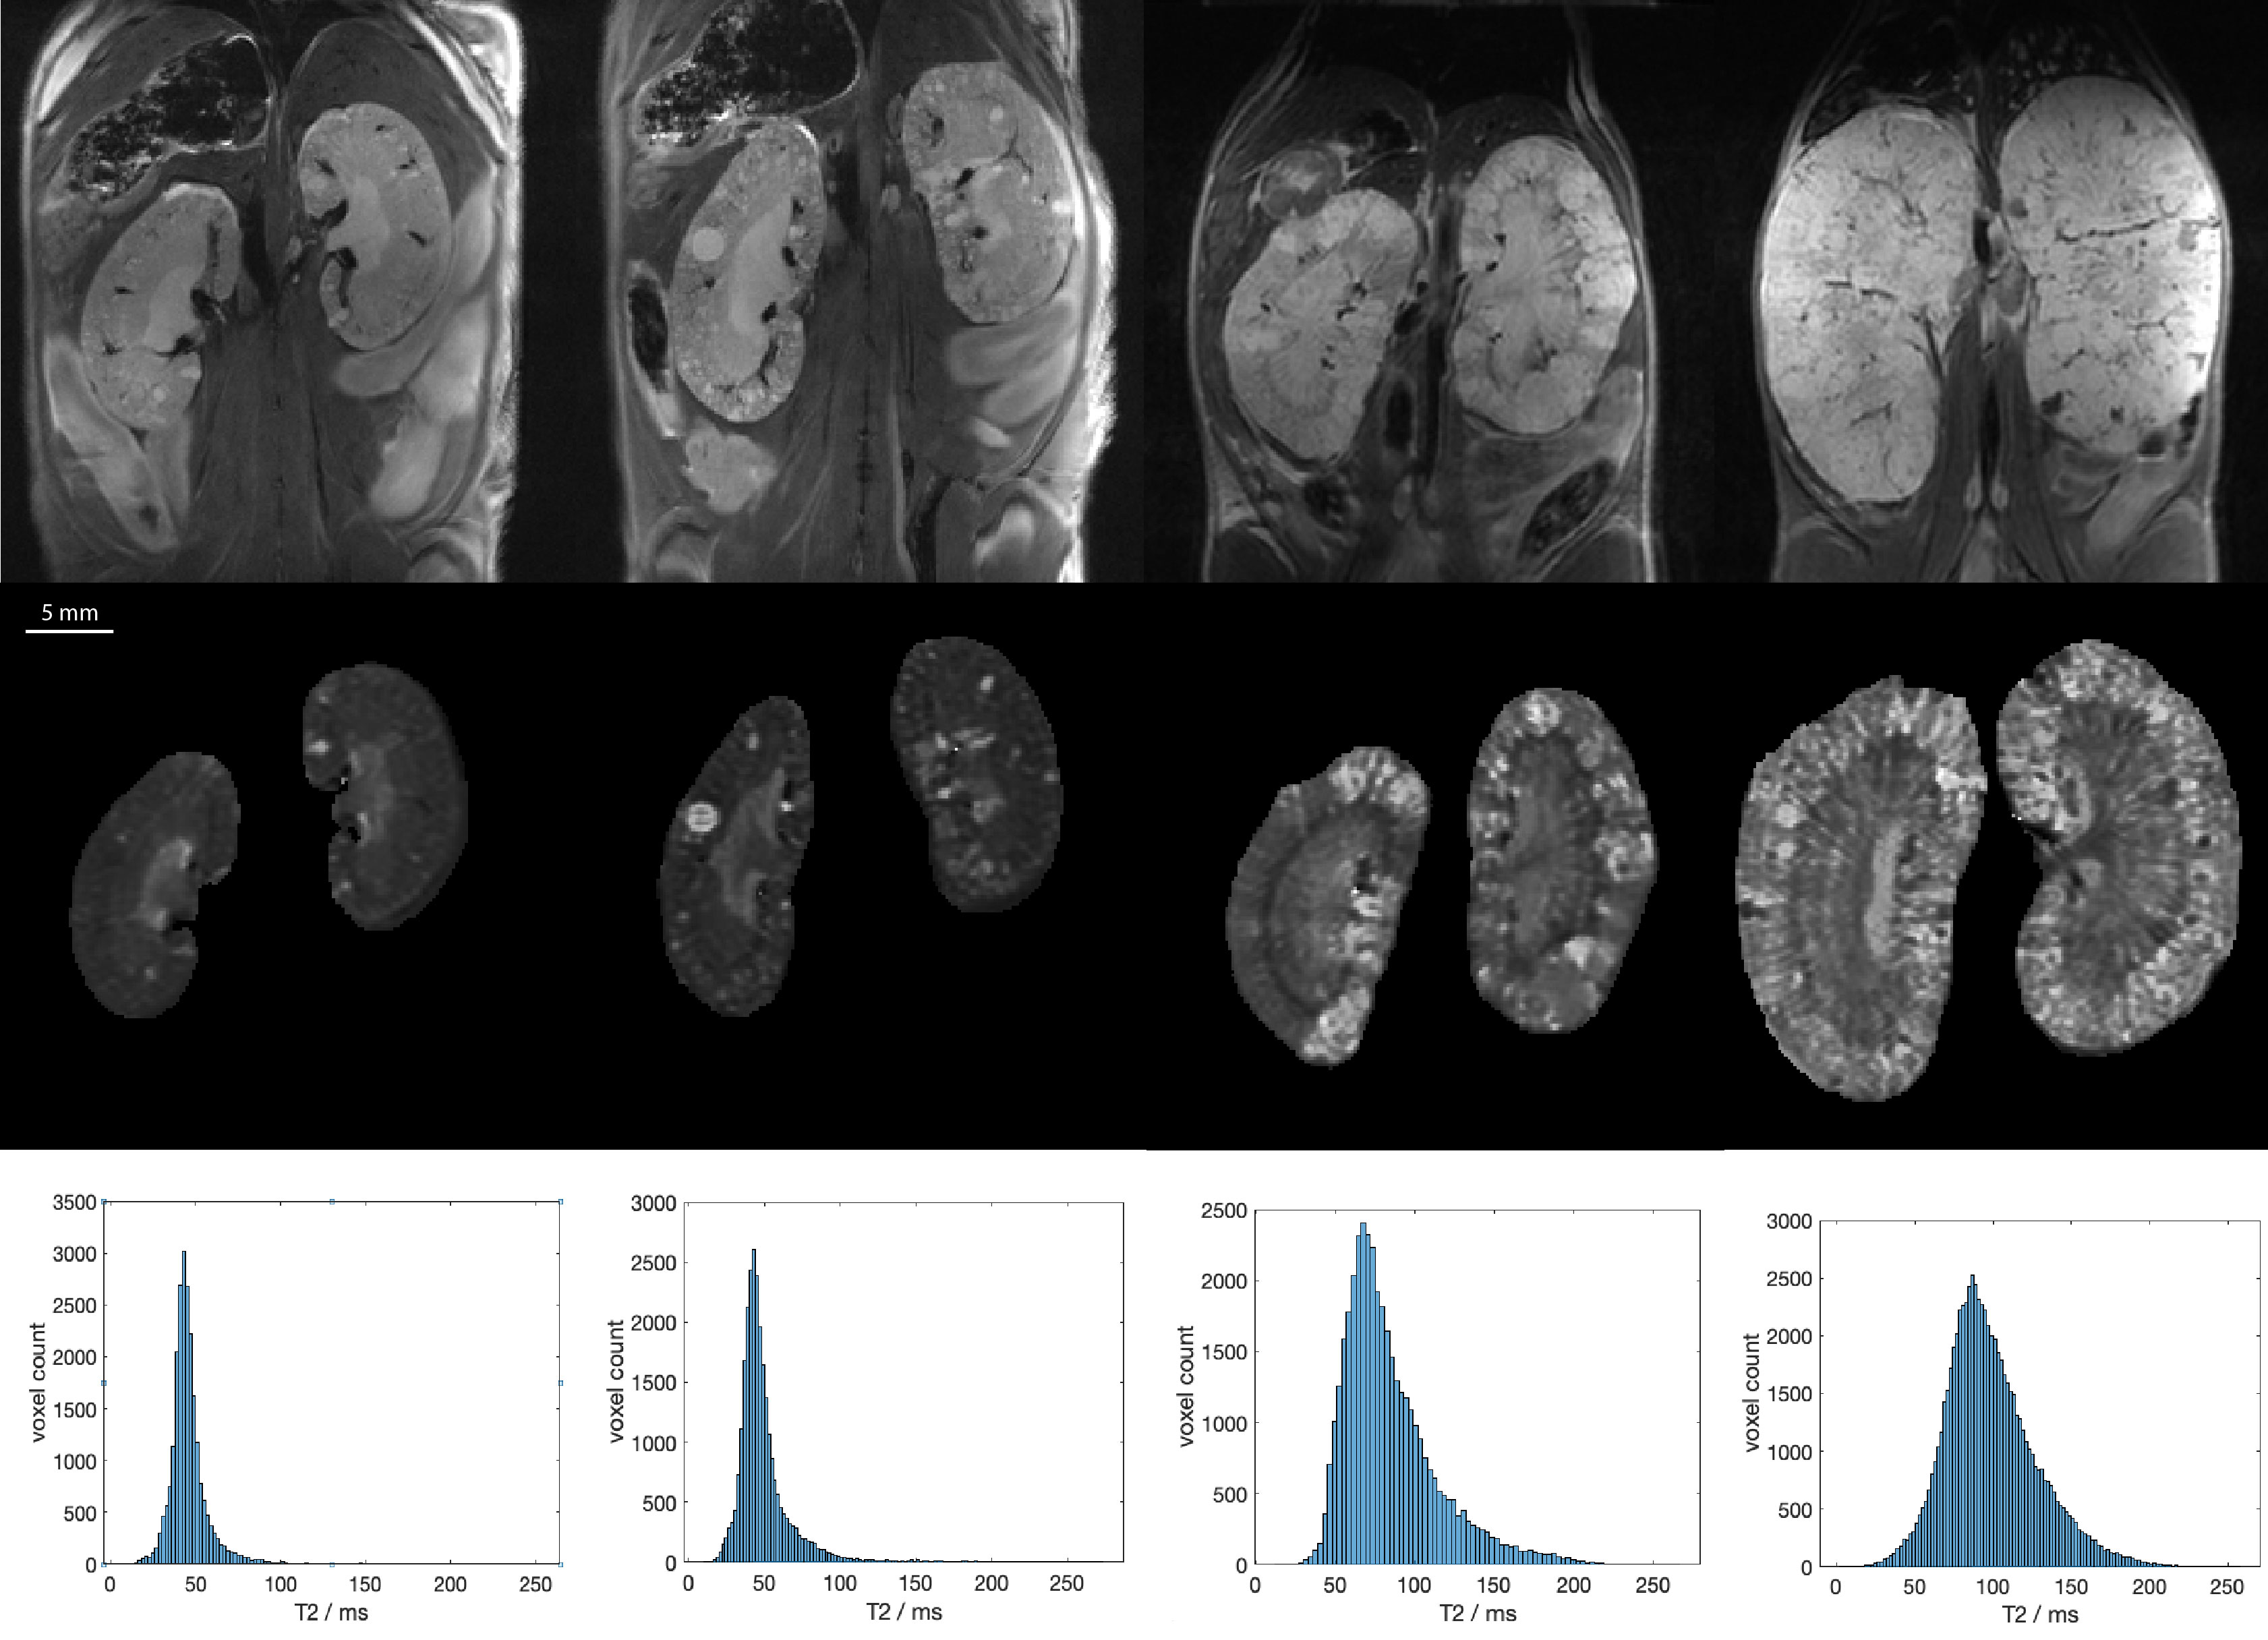
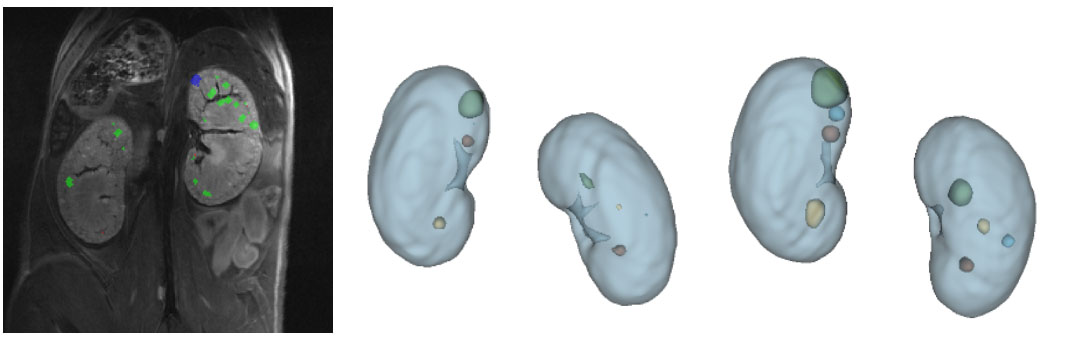
Registered and averaged anatomical MR images showed kidneys with fine detail, clear boundaries and good contrast between renal parenchyma, cysts and surrounding tissues. Disease progression led to kidney growth, increased cyst number and size as well as longer T2 relaxation times. These changes could be tracked longitudinally (Fig. 1).In the Pkd1RC/RC model, repeated MRI allowed for measuring and tracking the slow growth of cysts within animals. Registering kidneys between different acquisitions allows for following the progression of cyst development (Fig. 2).
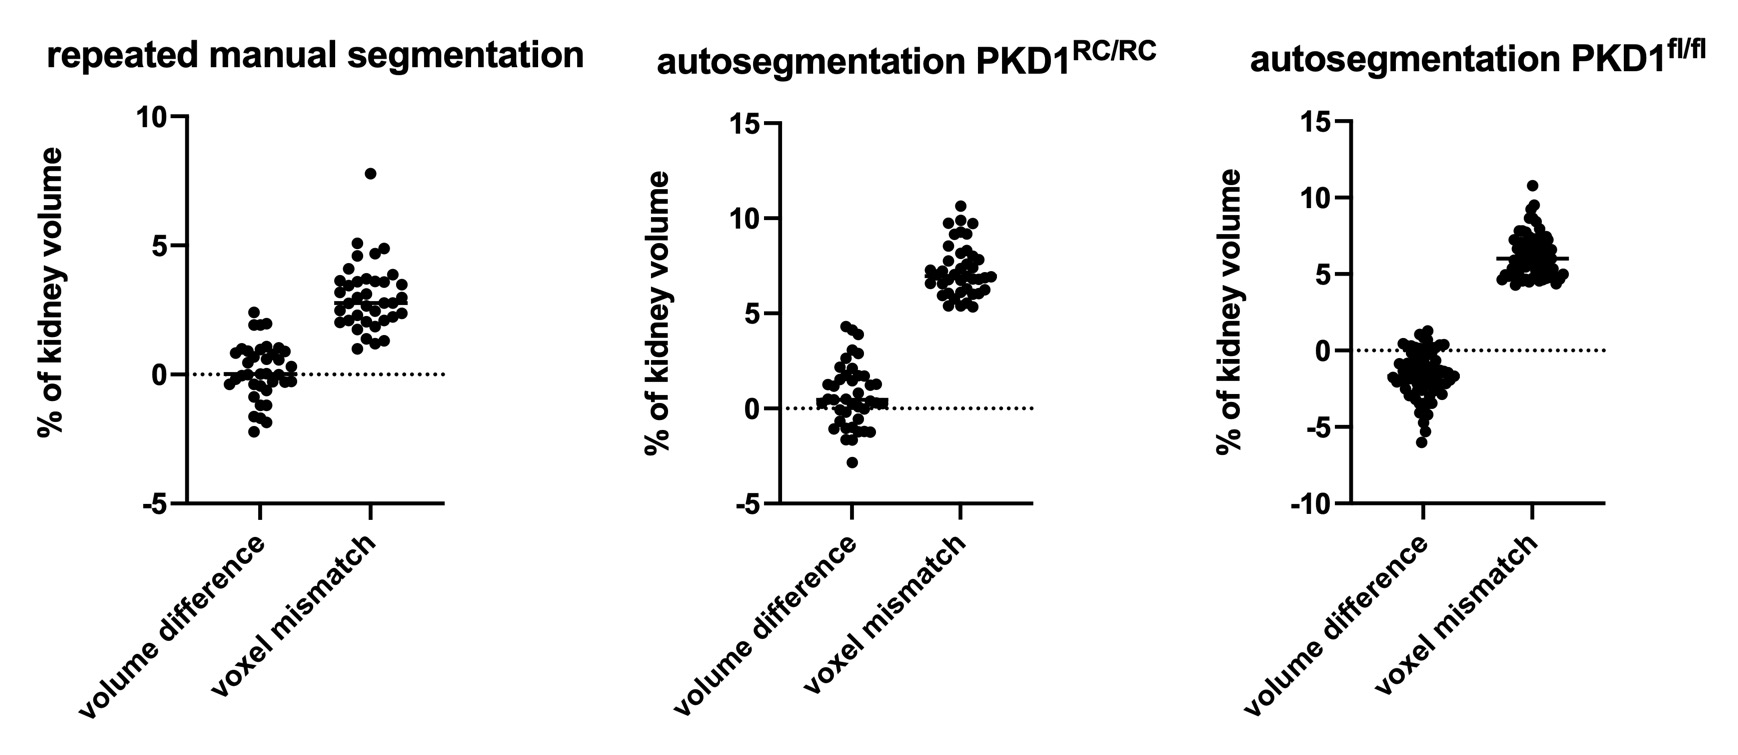
The quality of the automatic kidney segmentation was assessed by comparing differences to manual segmentation by an expert (ground truth data). Variability of manual segmentation was measured by blinded repeated manual segmentations to determine intra-observer variance (Fig. 3). Automatic segmentation showed comparable variability in volume measurement in the Pkd1RC/RC model and slight undersegmentation for the rapidly progressing, more variable Pkd1fl/fl model (mean: -1.6%, SD 1.5%).
Discussion and Conclusion
Our kidney MRI acquisition protocol and post-processing pipeline allows for detailed measurement of the progression of ADPKD in mouse models, tracking the change in kidney volume, cyst development and tissue T2 with high accuracy. The combination of registering multiple high-resolution, low SNR images to obtain high quality images compensated for slow intestinal movement, together with a robust automatic processing pipeline enables high throughput assessment of PKD progression, facilitating rapid testing of drug candidates.Acknowledgements
We thank Andrew Stafford for excellent support with manual kidney segmentations. The Pkd1RC/RC mice were provided by the Eduardo Chini lab at the Mayo Clinic, Rochester, MA, USA, and the model was developed by Dr. Peter C. Harris, Mayo Clinic, Rochester, MA, USA. The Pkd1fl/fl;Pax8rtTA;TetO-cre mice were provided by the Peter Jackson lab at Stanford, CA, USA, and uses Pkd1flox/flox mice developed by Dr. Stefan Somlo, Yale, Pax8 developed by Dr. Robert Koesters, German Cancer Research Center (DKFZ), Heidelberg, Germany, and TetO-cre developed by Dr. Andras Nagy, Mount Sinai Health System, NY, USA.References
1 Kidney International (2008) 73, 778–781; doi:10.1038/sj.ki.5002771;
2 Kidney International (2004) 65, 1511-1516; doi:10.1111/j.1523-1755.2004.00532.x
3 Proc ISMRM 2021, 423
4 IEEE Transactions on Medical Imaging, vol. 29, no. 1, pp. 196 - 205, January 2010.
5 Nat Genet 2013 Sep;45(9):1004-12 doi: 10.1038/ng.2715. Epub 2013 Jul 28.
6 J Clin Invest. (2012) ,122(11): 4257–4273; doi: 10.1172/JCI64313
7 https://arxiv.org/abs/1606.04797
Figures