2318
Sequence comparison and test-retest analysis for 31P-MRS in mouse brain at 7 Tesla1Wellcome Centre for Integrative Neuroimaging, WIN-FMRIB, NDCN, University of Oxford, Oxford, United Kingdom, 2Mouse Imaging Centre (MICe), Hospital for Sick Children, Toronto, ON, Canada
Synopsis
31P-MRS is challenging in small samples as it suffers from long T1s, short T2s and low nucleus sensitivity (γ). Thus, ultra-high field has been generally preferred for investigating the mouse brain. Less is known about its feasibility at lower field strength with more readily available scanners. Here, we assess the applicability of 31P-MRS in mouse at 7T to study neuroenergetics by comparing 3D-ISIS, PRESS and sLASER. Then, by performing a test-retest analysis and power calculations we assessed the relevance of our method for potential preclinical studies application.
Introduction
Phosphorous-31 (31P) Magnetic Resonance Spectroscopy (MRS) is the technique of choice for studying cellular energetics in vivo, allowing a quantitative assessment of ‘high-energy phosphates’ in a target organ or tissue. While plenty of studies have investigated neuroenergetics using 31P-MRS1,2, to date, results reporting measurements in mouse brain remain scarce. The small mouse brain volume and long T1 relaxation times of 31P-containing metabolites have encouraged the use of ultra-high field preclinical scanners (>7T)3–5. Nevertheless, in comparison, besides being more readily available, 7T scanners benefit from longer T2 relaxation times of 31P metabolites, particularly advantageous for metabolites losing transverse magnetization quickly such as ATP (Adenosine TriPhosphate). This suggests that sequences such as PRESS or sLASER, which are more affected by T2 but less motion-sensitive than typical 3D-ISIS, might become advantageous at 7T. Here, we compare the performance of PRESS and sLASER to 3D-ISIS at 7T in mouse brain. Furthermore, the quantification reliability and reproducibility were used to estimate sample size requirements to study brain energy metabolism.Methods
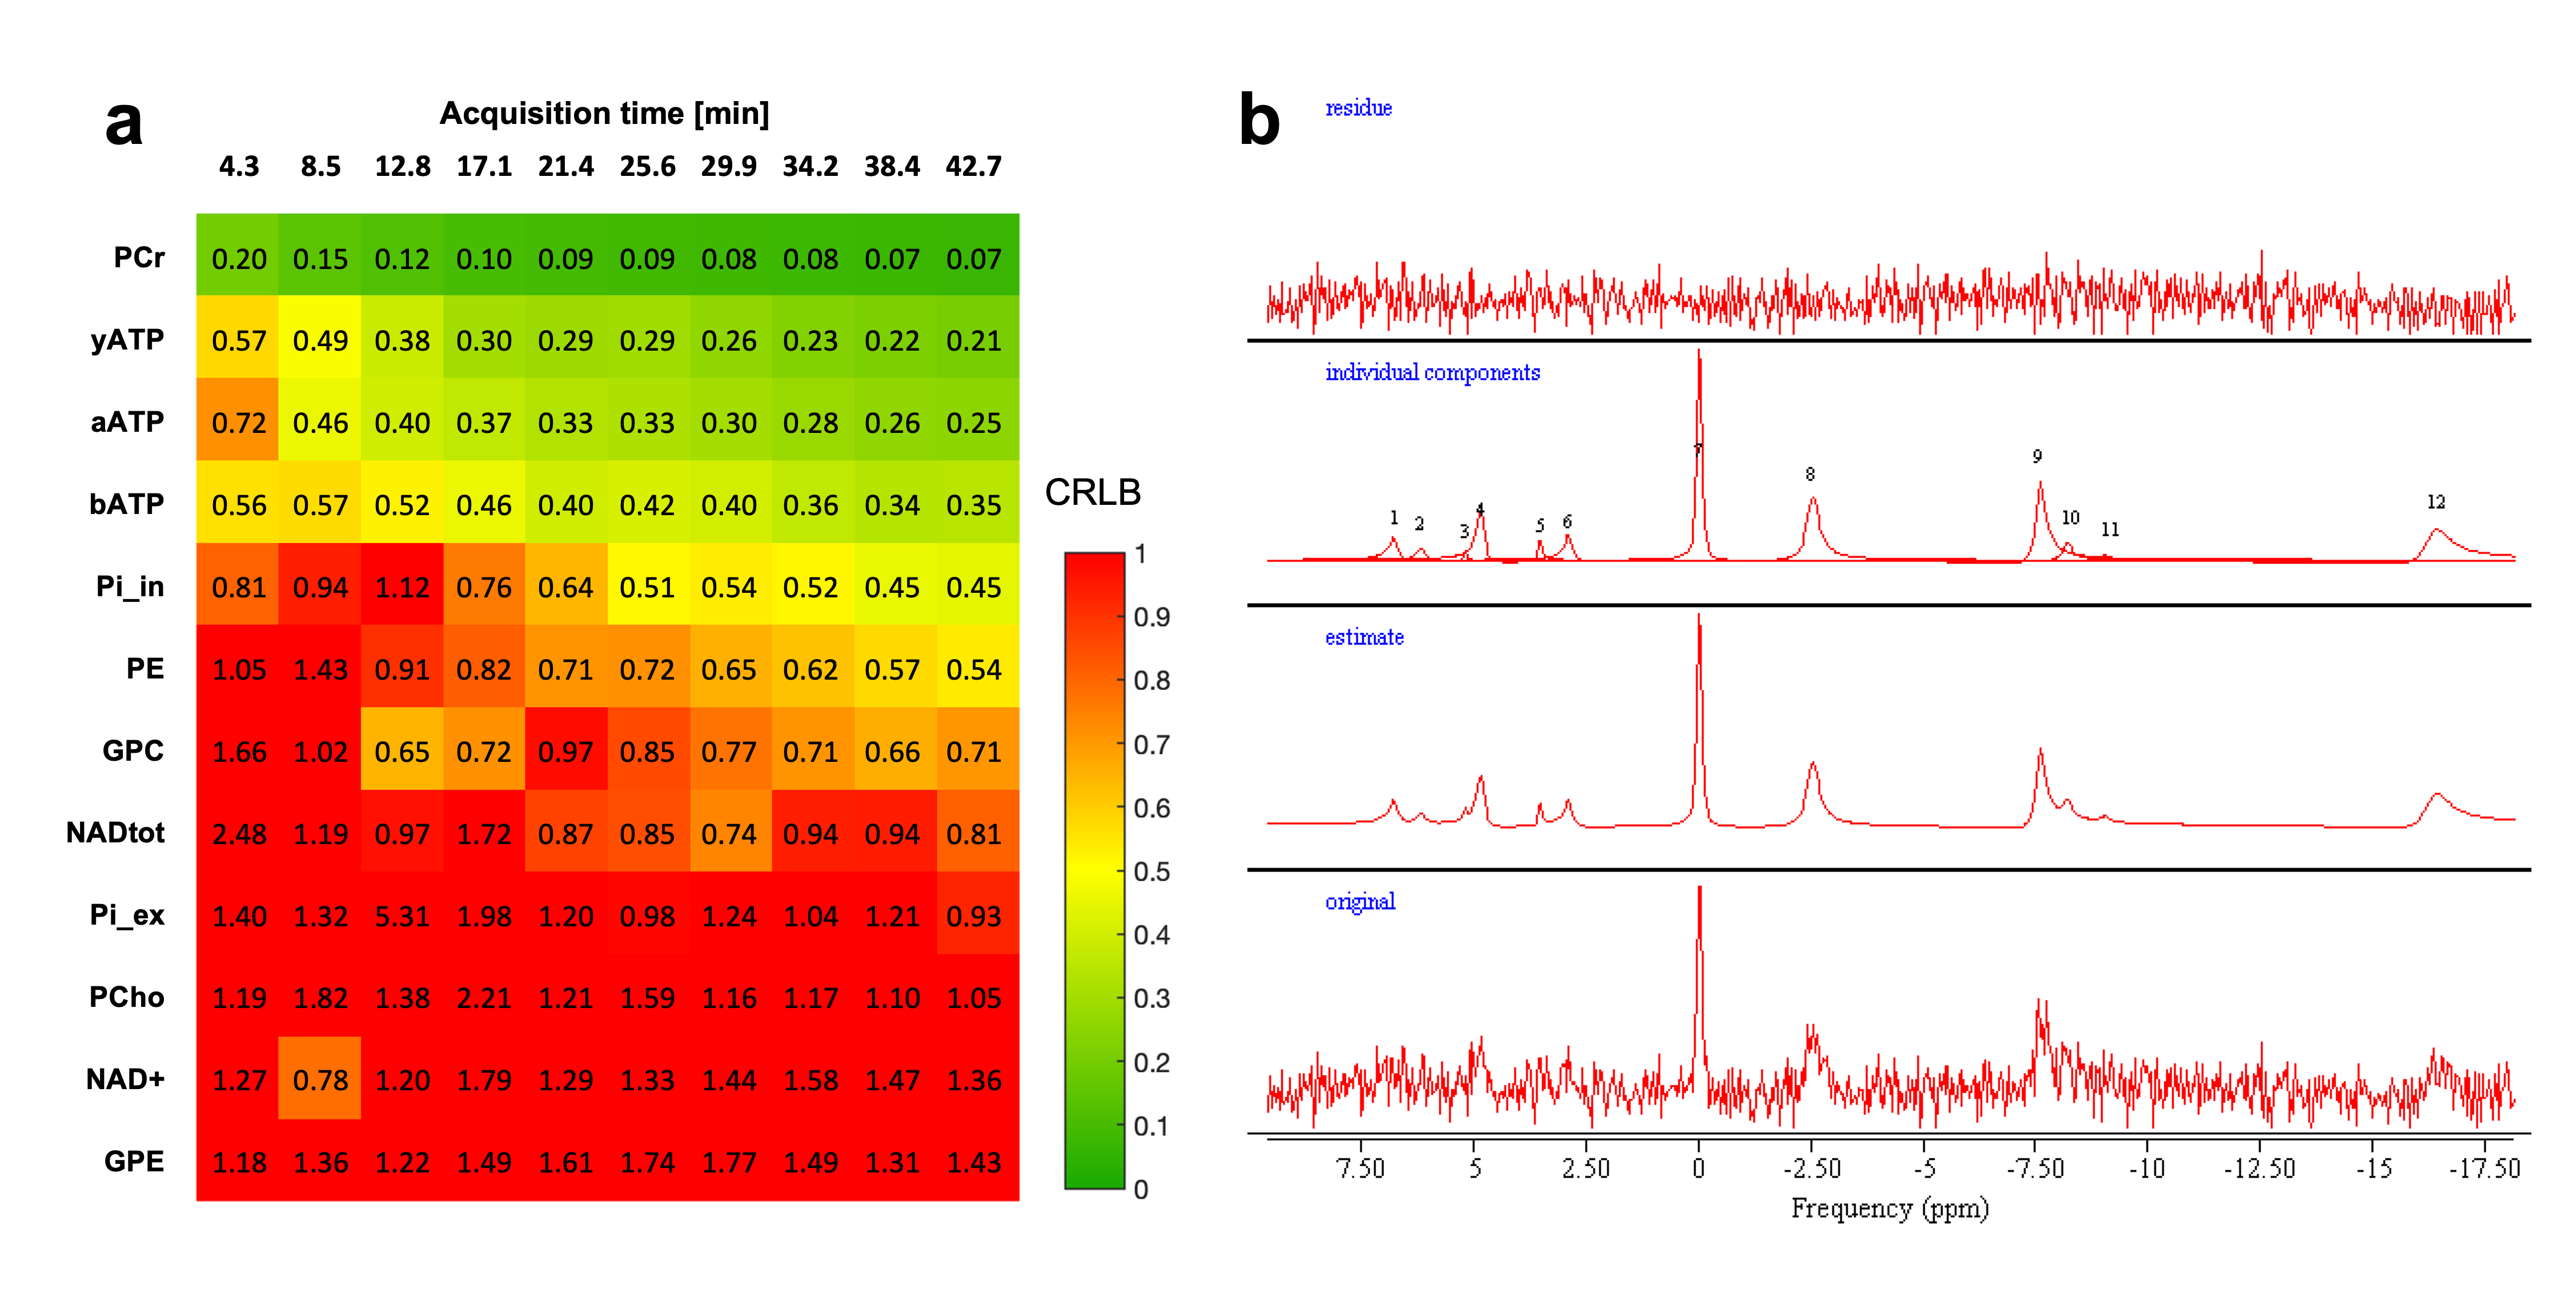
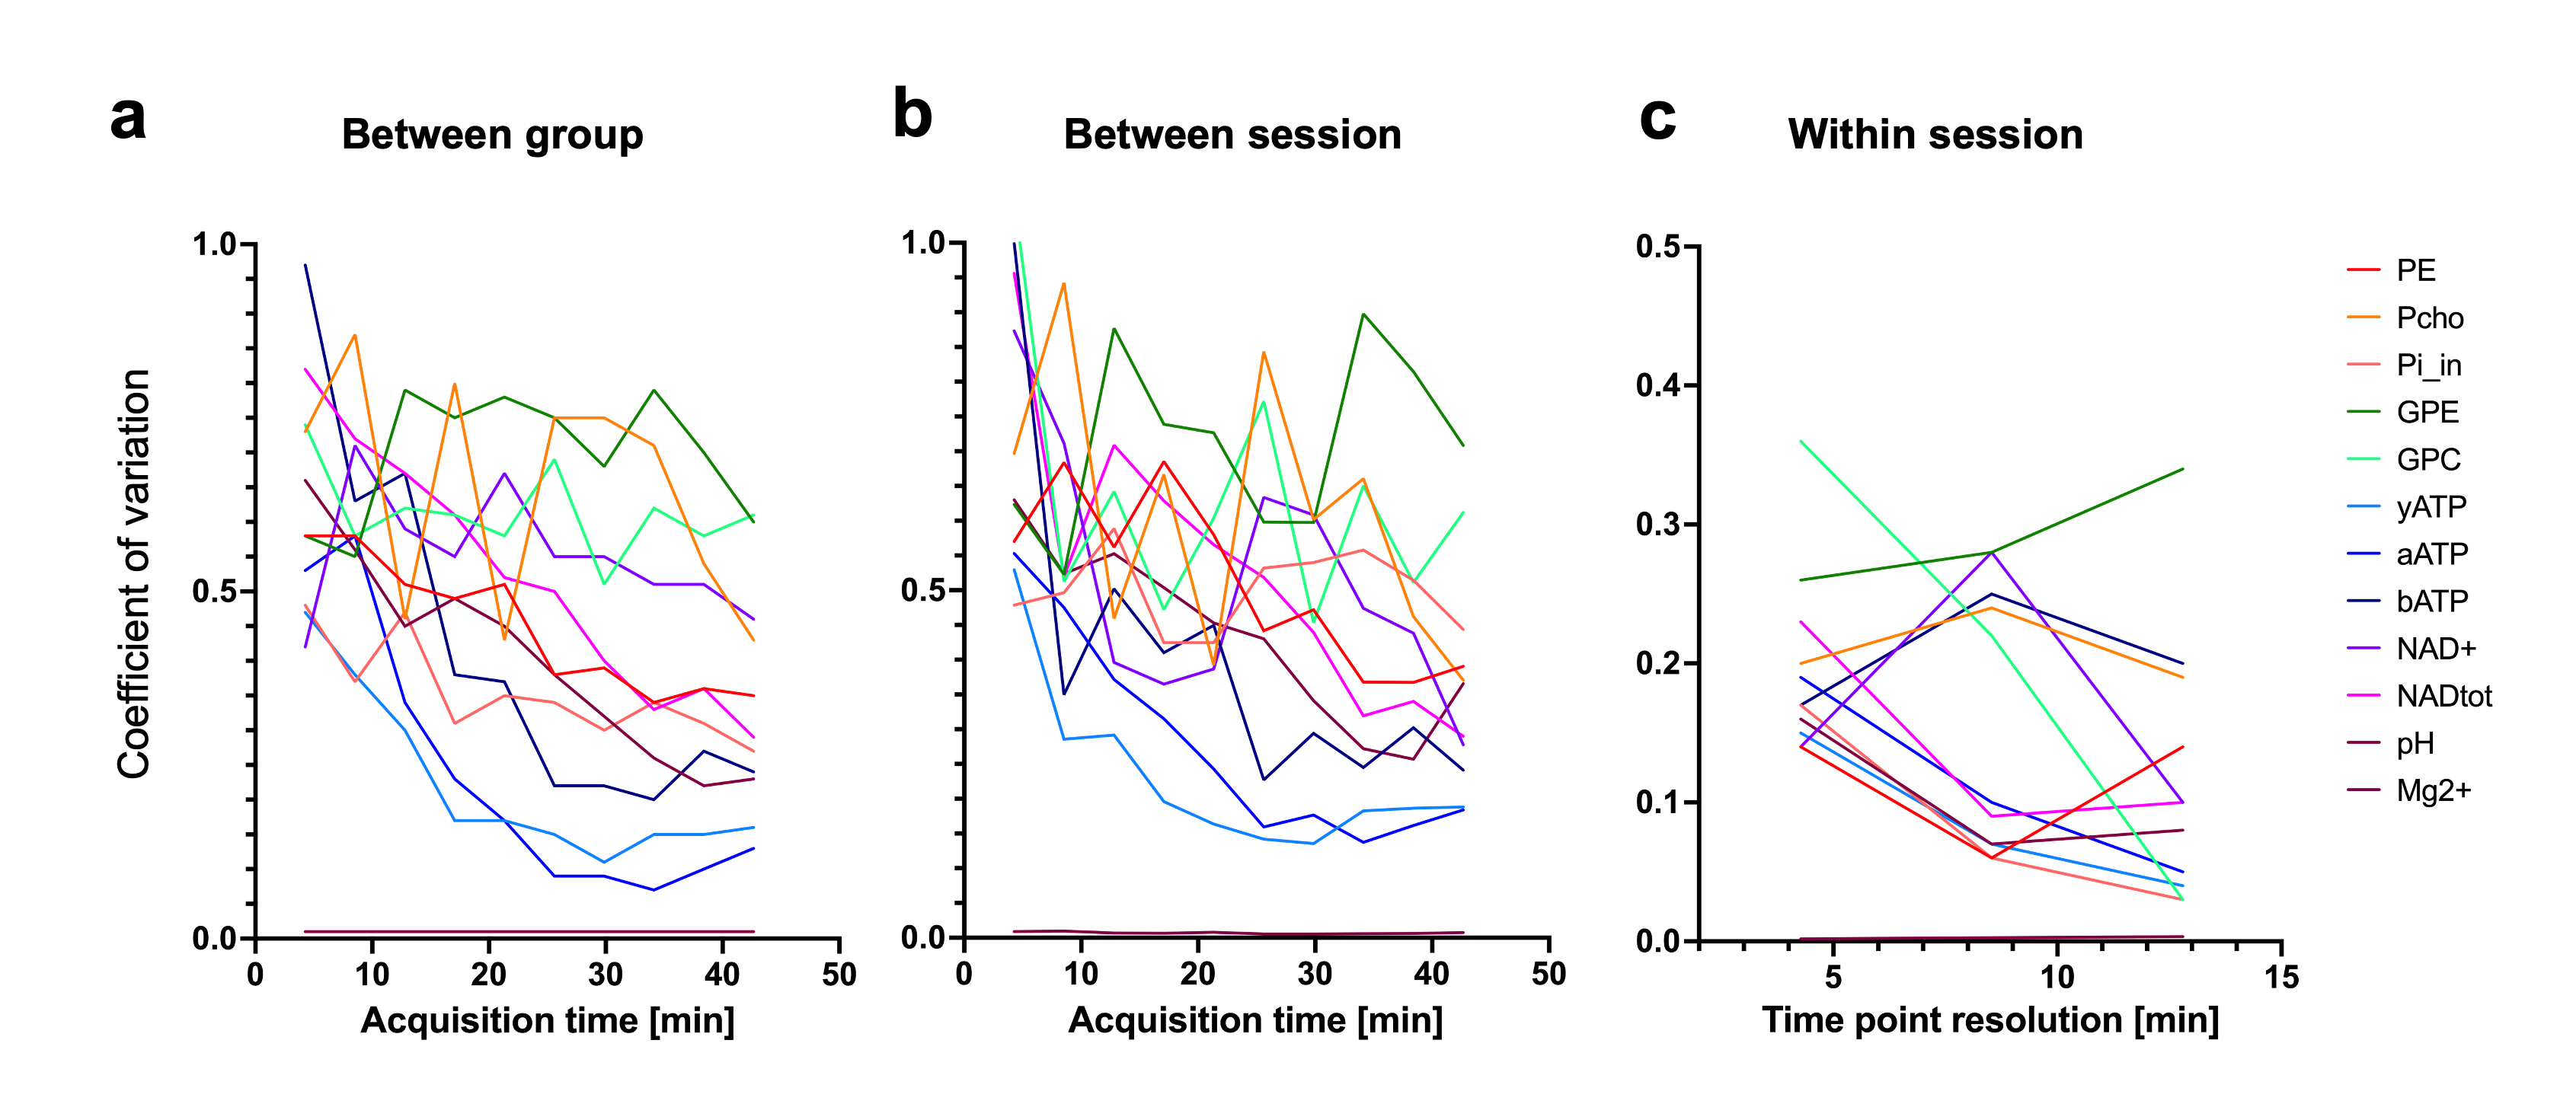
This study was performed with the approval of the local animal care and use committee. Six adult male C57BL/6 mice (35±3g) were scanned on a 7 Tesla (70/20) BioSpec MRI scanner (Bruker, Ettlingen, DE) under isoflurane anesthesia (1-2%), and re-scanned 6 days after. For the acquisition, a dual tuned 31P/1H surface coil with a single 10mm 31P loop (PulseTeq Ltd, Chobham, UK) was used as transceiver (Tx/Rx). Anatomical T2-weighted images (TurboRARE) were acquired to locate the 160uL spectroscopic voxel (8x5x4mm3) in a brain area englobing both Hippocampus and Hypothalamus. Shimming was performed in the voxel to reach a water linewidth50% of 26±2Hz, followed by a 31P-MRS acquisition using PRESS, sLASER and 3D-ISIS in randomized order with similar acquisition parameters (Npoints=1024, AcquisitionBW=40ppm, TR=4s, TEPRESS=15ms, TEsLASER=20ms, Averages/Repetitions=64x10, scantime=42min). Optimal TR was assessed by measuring the T1 of PCr in phantoms using 3D-ISIS with inversion recovery and by maximizing the relative SNR (PCr/γATP) in one sample in vivo. All pulses were optimized in phantoms to adjust the power for maximal signal Intensity. The effective Flip angle (FAeff) in our voxel was assessed in a 250mM PCr phantom using a double TR method6. Spectra were processed (phasing, B0-drift correction) in jMRUI and analysed with AMARES, using Lorentzian line-shape and constrained frequency, linewidth and amplitude for each component (PCr, γATP, αATP, βATP, Pi_in, Pi_ex, PE, PCho, GPC, GPE, NADtot, NAD+) with additional FID weighting in the first 20 points. [Mg2+] and pH were determined as defined by AMARES, i.e. Pi_in-PCr and bATP -PCr chemical shift differences. Cramer-Rao Lower Bounds (CRLB%) were calculated by dividing the fit error (SD) over the amplitude. SNRs were compared using a RM 2-way ANOVA with Bonferroni post-hoc test (GraphPad, Prism 9). For all three sequences, the between-session coefficient of variation (CV, i.e. SD/Mean) was assessed for increasing scanning time, i.e. for increasing number of spectra averages, using a Bland-Altmann SD7. For 3D-ISIS, CVs were computed for between-group, within-session and between session for increasing scanning time. Between-group SD was calculated from session 1, within-session SD was calculated from the average quantification for all mice (session1+2) over the time of acquisition for 3 different time resolutions (4, 8 and 13min), and finally the between-session CV was determined using a Bland-Altmann SD. Power calculations were done with following equation8:$$ N=\frac{(Z_{1-\alpha/2}+Z_{1-\beta})^2\cdot CV^2}{\%\triangle^2} $$
With N, the number of subjects per group, Z scores for α=0.05 and β=20% (Z1-α/2=1.96 and Z1-β=0.8416), CV the coefficient of variation and %Δ the precent change expected.
Results
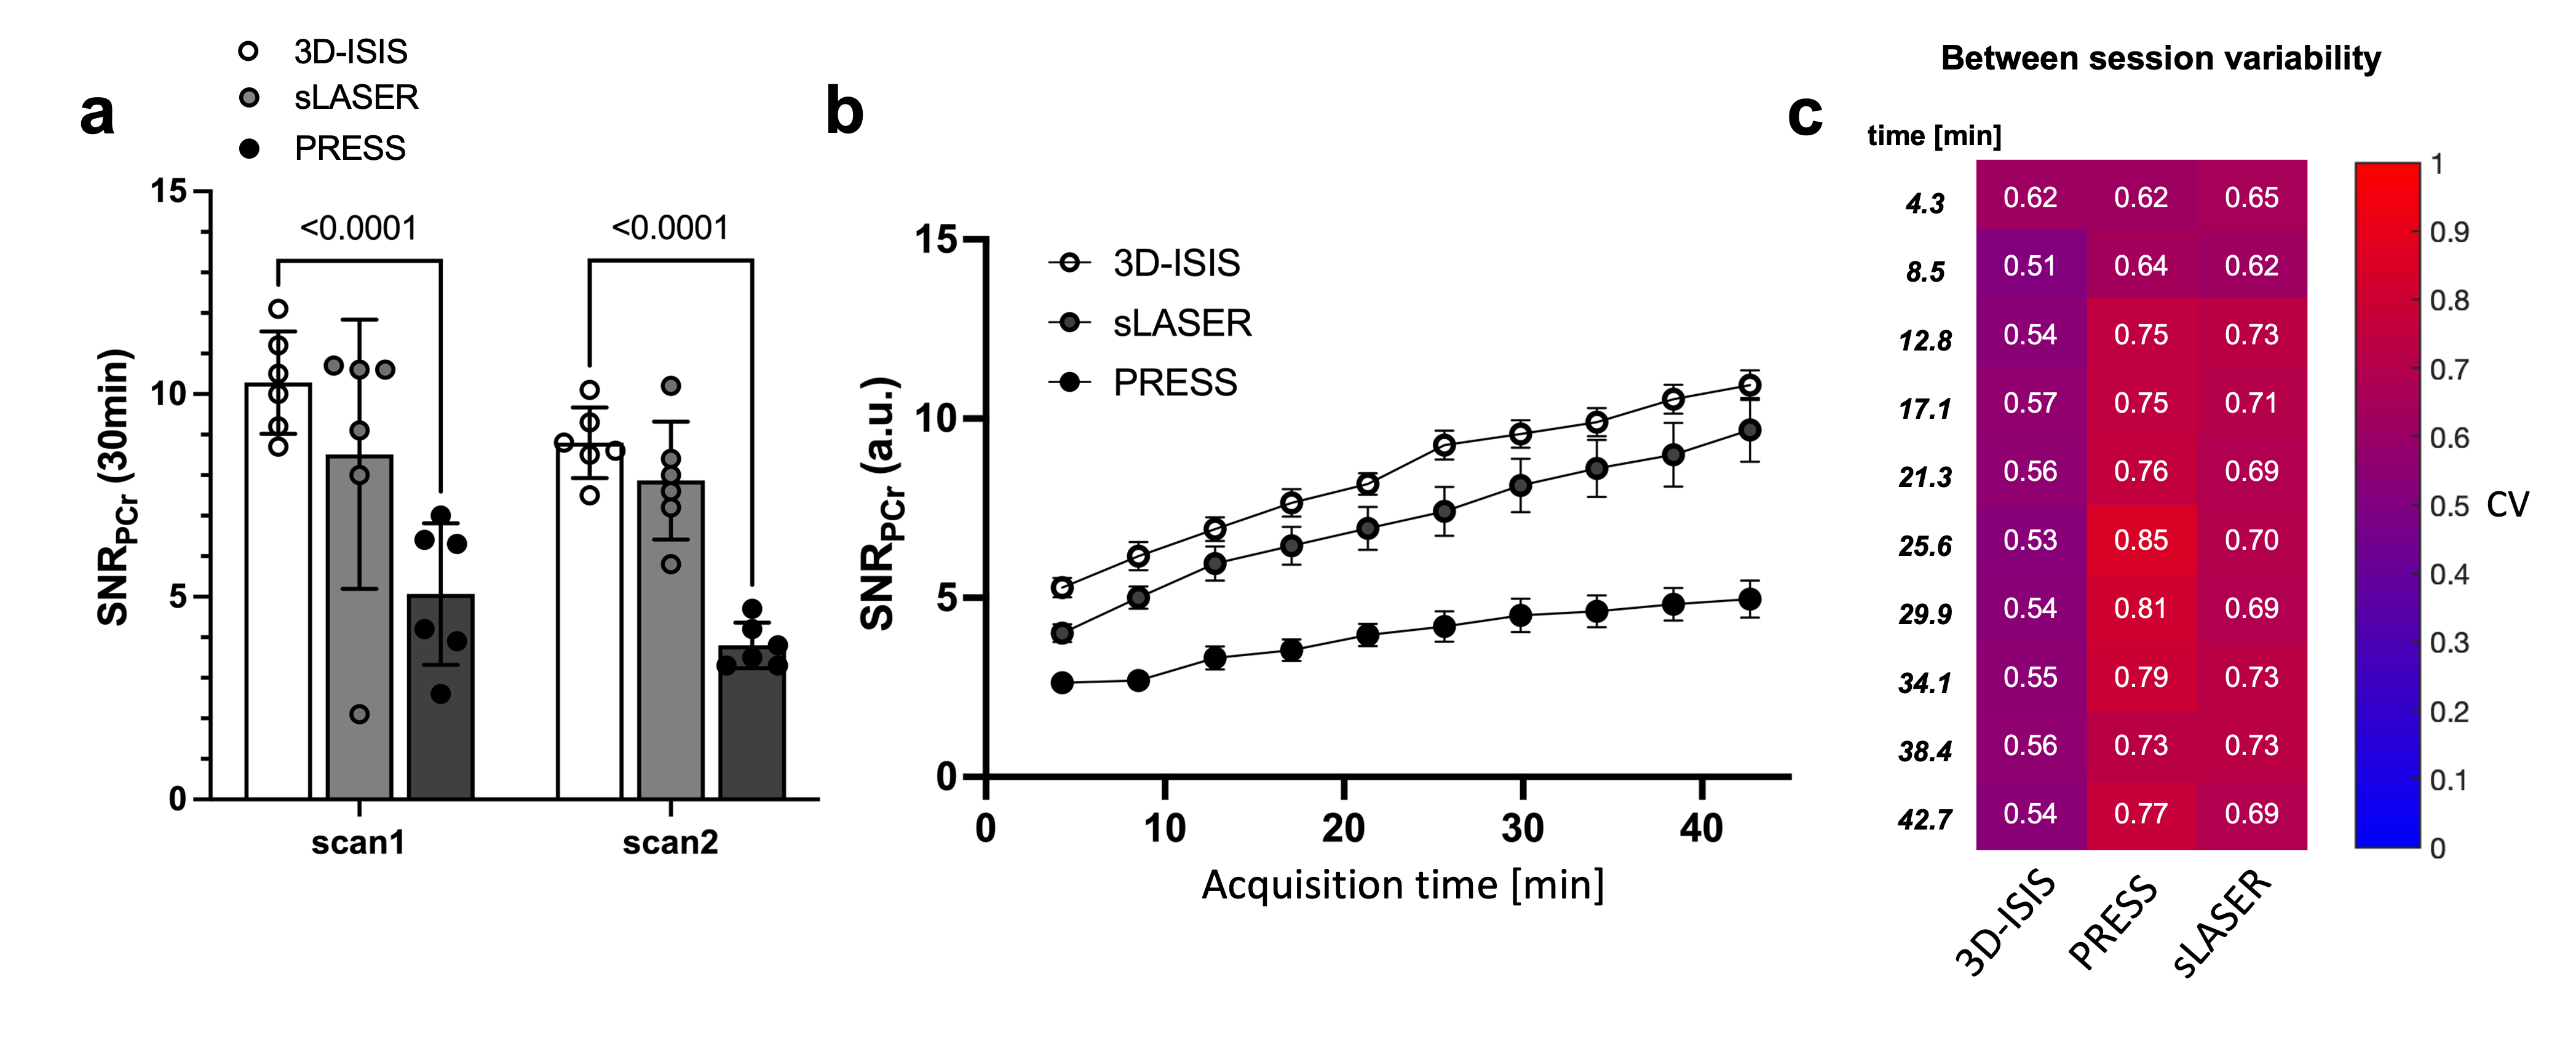
31P-MRS led to clear identifiable PCr peaks with all three methods (Fig1.a-b), despite the FAeff of the 90° pulse reaching only 63±10° in average (Fig1c). 3D-ISIS performed significantly better than PRESS with a higher SNRPCr (Fig.2a-b, p<0.0001). Although the SNRPCr was not significantly lower for sLASER, the longer TE resulted in a drop in ATP resonances. Consistency of SNR between experiments was rather low (CV>50%) for all three methods, with a slightly better performance using 3D-ISIS (Fig.2c). As expected, fitting reliability measured with CRLB improved with number of scan averages (Fig.3a-b). High-concentrated metabolites (PCr, ATP) reached a CRLB>50% and low-concentrated metabolites (Pi_ex, PE, GPC, NADtot) reached a 50%<CRLB<100%, while all other metabolites were not reliably quantified (CRLB>100%). As suspected, between-session CV were the highest, suggesting poor reproducibility of 31P-metabolite concentrations from one day to another, while within-session CV was the lowest (Fig.4a-c). Finally, power calculations indicated that changes in ATP/PCr between 15-20% could be measured with animal groups ranging between 10-20 subjects, while Pi/PCr quantifications appear more challenging (Fig.5).Discussion
Our results indicate that 3D-ISIS remain the technique of choice for quantification of mouse brain metabolites at 7 Tesla with increased SNR amplitude, SNR consistency and minimal T2 relaxation artifacts. 3D-ISIS provided reliable quantification of the main energy-related 31P-metabolites with a within-session variability that was much lower than between-session, suggesting the method might particularly be suitable for assessing metabolite changes throughout the same experiment. The variability between sessions could be attributable to several physiological factors (e.g. circadian, anesthesia-related). Nevertheless, power calculations indicate that groups in the typical range of preclinical experimentation (10-15 animals), metabolite changes below 20% could be detected with the current setup.Acknowledgements
This work was supported by the Wellcome Centre for Integrative Neuroimaging (WIN) and the Swiss National Science Foundation (SNSF)References
1. Ren, J., Sherry, A. D. & Malloy, C. R. (31)P-MRS of healthy human brain: ATP synthesis, metabolite concentrations, pH, and T1 relaxation times. NMR Biomed. 28, 1455–62 (2015).
2. Tiret, B., Brouillet, E. & Valette, J. Evidence for a ‘metabolically inactive’ inorganic phosphate pool in adenosine triphosphate synthase reaction using localized 31P saturation transfer magnetic resonance spectroscopy in the rat brain at 11.7T. J. Cereb. Blood Flow Metab. 36, 1513–1518 (2016).
3. Tkac, I. et al. Homeostatic adaptations in brain energy metabolism in mouse models of Huntington disease. J. Cereb. Blood Flow Metab. 32, 1977–1988 (2012).
4. Skupienski, R., Do, K. Q. & Xin, L. In vivo 31P magnetic resonance spectroscopy study of mouse cerebral NAD content and redox state during neurodevelopment. Sci. Rep. 10, (2020).
5. Lu, M., Chen, W. & Zhu, X.-H. Field dependence study of in vivo brain (31) P MRS up to 16.4 T. NMR Biomed. 27, 1135–41 (2014).
6. Chmelík, M. et al. Flip-angle mapping of 31P coils by steady-state MR spectroscopic imaging. J. Magn. Reson. Imaging 40, 391–397 (2014).
7. Bland, J. M. & Altman, D. G. Statistics notes: Measurement error. BMJ 312, 1654–1654 (1996).
8. Noordzij, M. et al. Sample size calculations: Basic principles and common pitfalls. Nephrol. Dial. Transplant. 25, 1388–1393 (2010).
Figures