2317
Cortical regions in the apex transmodal network show greatest anatomical variability in infant marmosets1Translational Neuroimaging Laboratory, PDN, University of Cambridge, Cambridge, United Kingdom, 2Wolfson Brain Imaging Centre, University of Cambridge, Cambridge, United Kingdom
Synopsis
We created high-resolution paediatric templates of the marmoset brain from infancy to puberty, producing maps of anatomical variability at different ages. We show that greatest variability is present in juveniles and corresponds well with regions in a recently described transmodal apex network of higher order association areas in the marmoset (and human) brain. We hypothesise this time-period of high variability may indicate a period of heightened vulnerability to environmental stressors which may be a causal factor in the development of mental health disorders.
Introduction
Early life disruption of the development of cortical and subcortical circuits underlying attention, decision making, mood and emotion are likely to contribute to the pathogenesis of disorders of mental health which affect up to half the population[1]. Animal models are crucial to understanding both normal and pathological development of these brain circuits and periods in which they may be most vulnerable to perturbation. The marmoset (Callithrix jacchus) is an ideal model with its compact lifespan (reaching adult maturity within 2 years) and sophisticated human-like social behaviours. Here, we map anatomical variability in early life development (3-12 months) using high-resolution 9.4T MRI in 61 marmosets. These maps can be used to pinpoint areas of higher anatomical variability at different life stages.A recent report[2] revealed trajectories of regional growth in the marmoset brain that included a period of rapid growth, peaking at 4-6 months, followed by a plateau and subsequent volume decline into adulthood, that varied markedly between brain regions. That study, with its accelerated longitudinal design, identified mean growth trajectories without assessing individual variability. In contrast, here we focus on individual variability in early life. Our hypothesis is that when brain regions are rapidly changing, they may be particularly vulnerable to perturbation from environmental stressors which may be a factor in the development of mental health disorders.
Methods
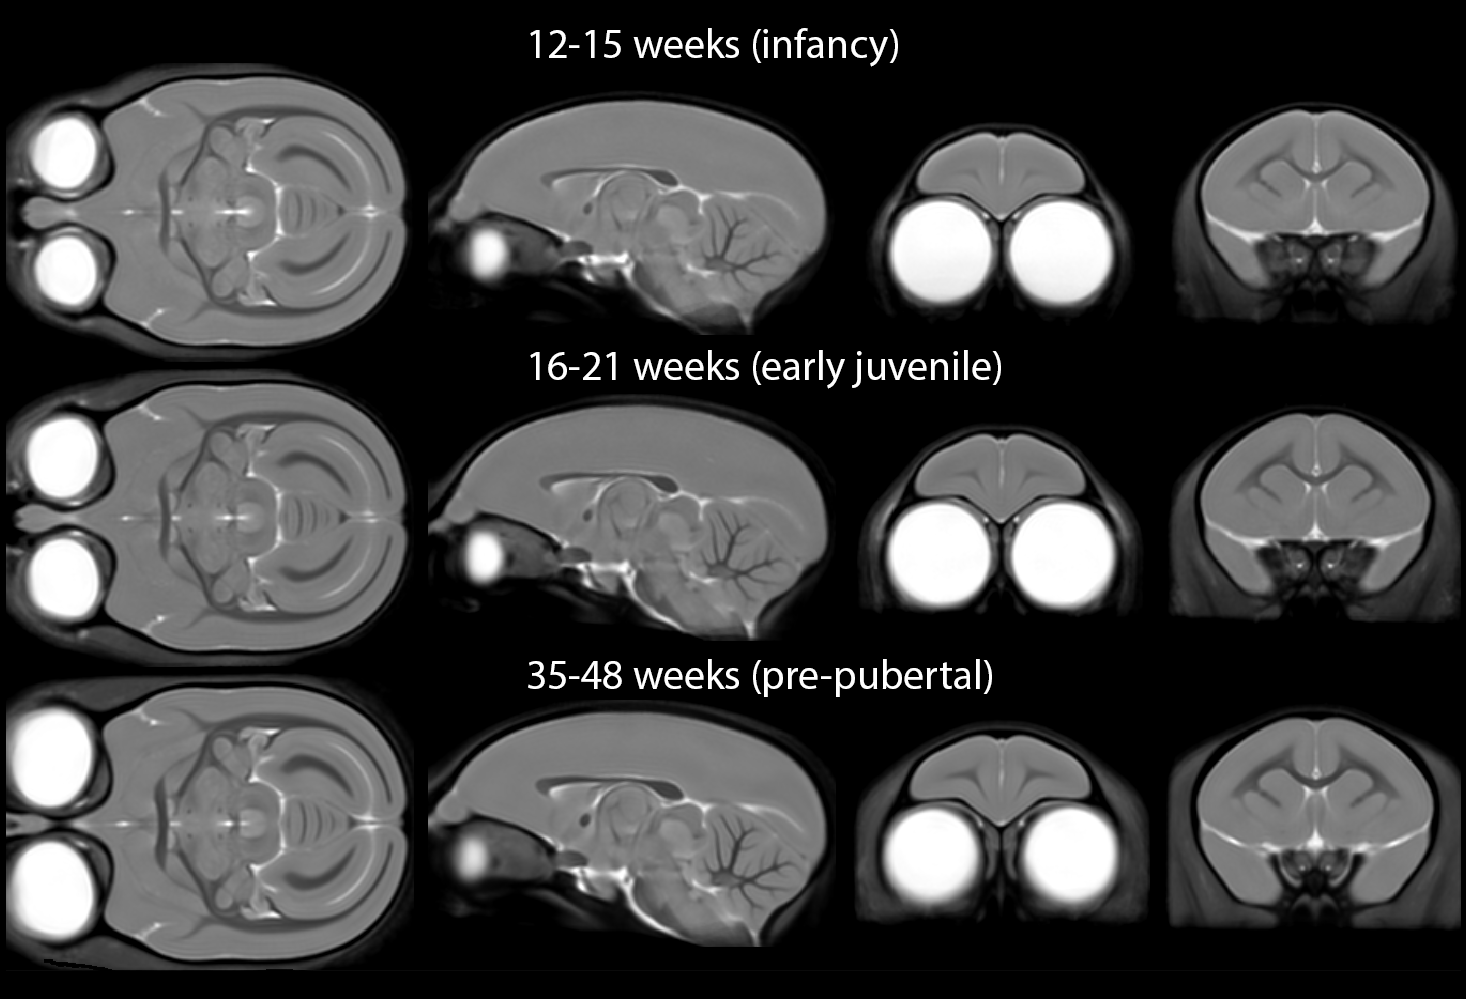
Animals and acquisitionMarmosets were scanned in infancy (12-15 weeks, n=18), early juvenile (16-21 weeks, n=18) and pre-pubertal (35-48 weeks, n=25) periods under isoflurane anaesthesia at 9.4T (Bruker BioSpec 94/20) with an 8-channel head coil (RAPID Biomedical) with a magnetisation transfer prepared MGE sequence (TR/TE/FA 25/2.4-13.4ms/6°, matrix 256×160×128, 175µm isotropic resolution, duration 7m28s).
Image processing and analysis
Brain images were segmented into GM, WM and CSF portions using SPM12 and the SPMMouse toolbox for animal brains with affine registration and RF inhomogeneity correction with unified segmentation[3]. DARTEL[4] was used to register images to a common space regardless of age into a single template.
DARTEL flow fields were integrated to produce deformation vectors from each point in the template to each individual brain and these were averaged together within groups to find the minimum-deformation atlas for each groups. The standard deviation of the magnitude of the displacement vector from each voxel gives an estimate of anatomical variability[5] and such maps were produced for each age group.
Creation of age-specific templates
A published marmoset brain cytoarchitectonic atlas[6] was mapped to the MRI images by manually delineating cortical voxels, registering cortical masks with an affine transform and assigning each cortical voxel to the nearest region defined in the atlas. Subcortical structures (n=44) were manually added with reference to the Paxinos atlas[7]. The DARTEL transforms for minimum-deformation atlases for each age group were used to warp these regions to create age-specific brain templates.
Results
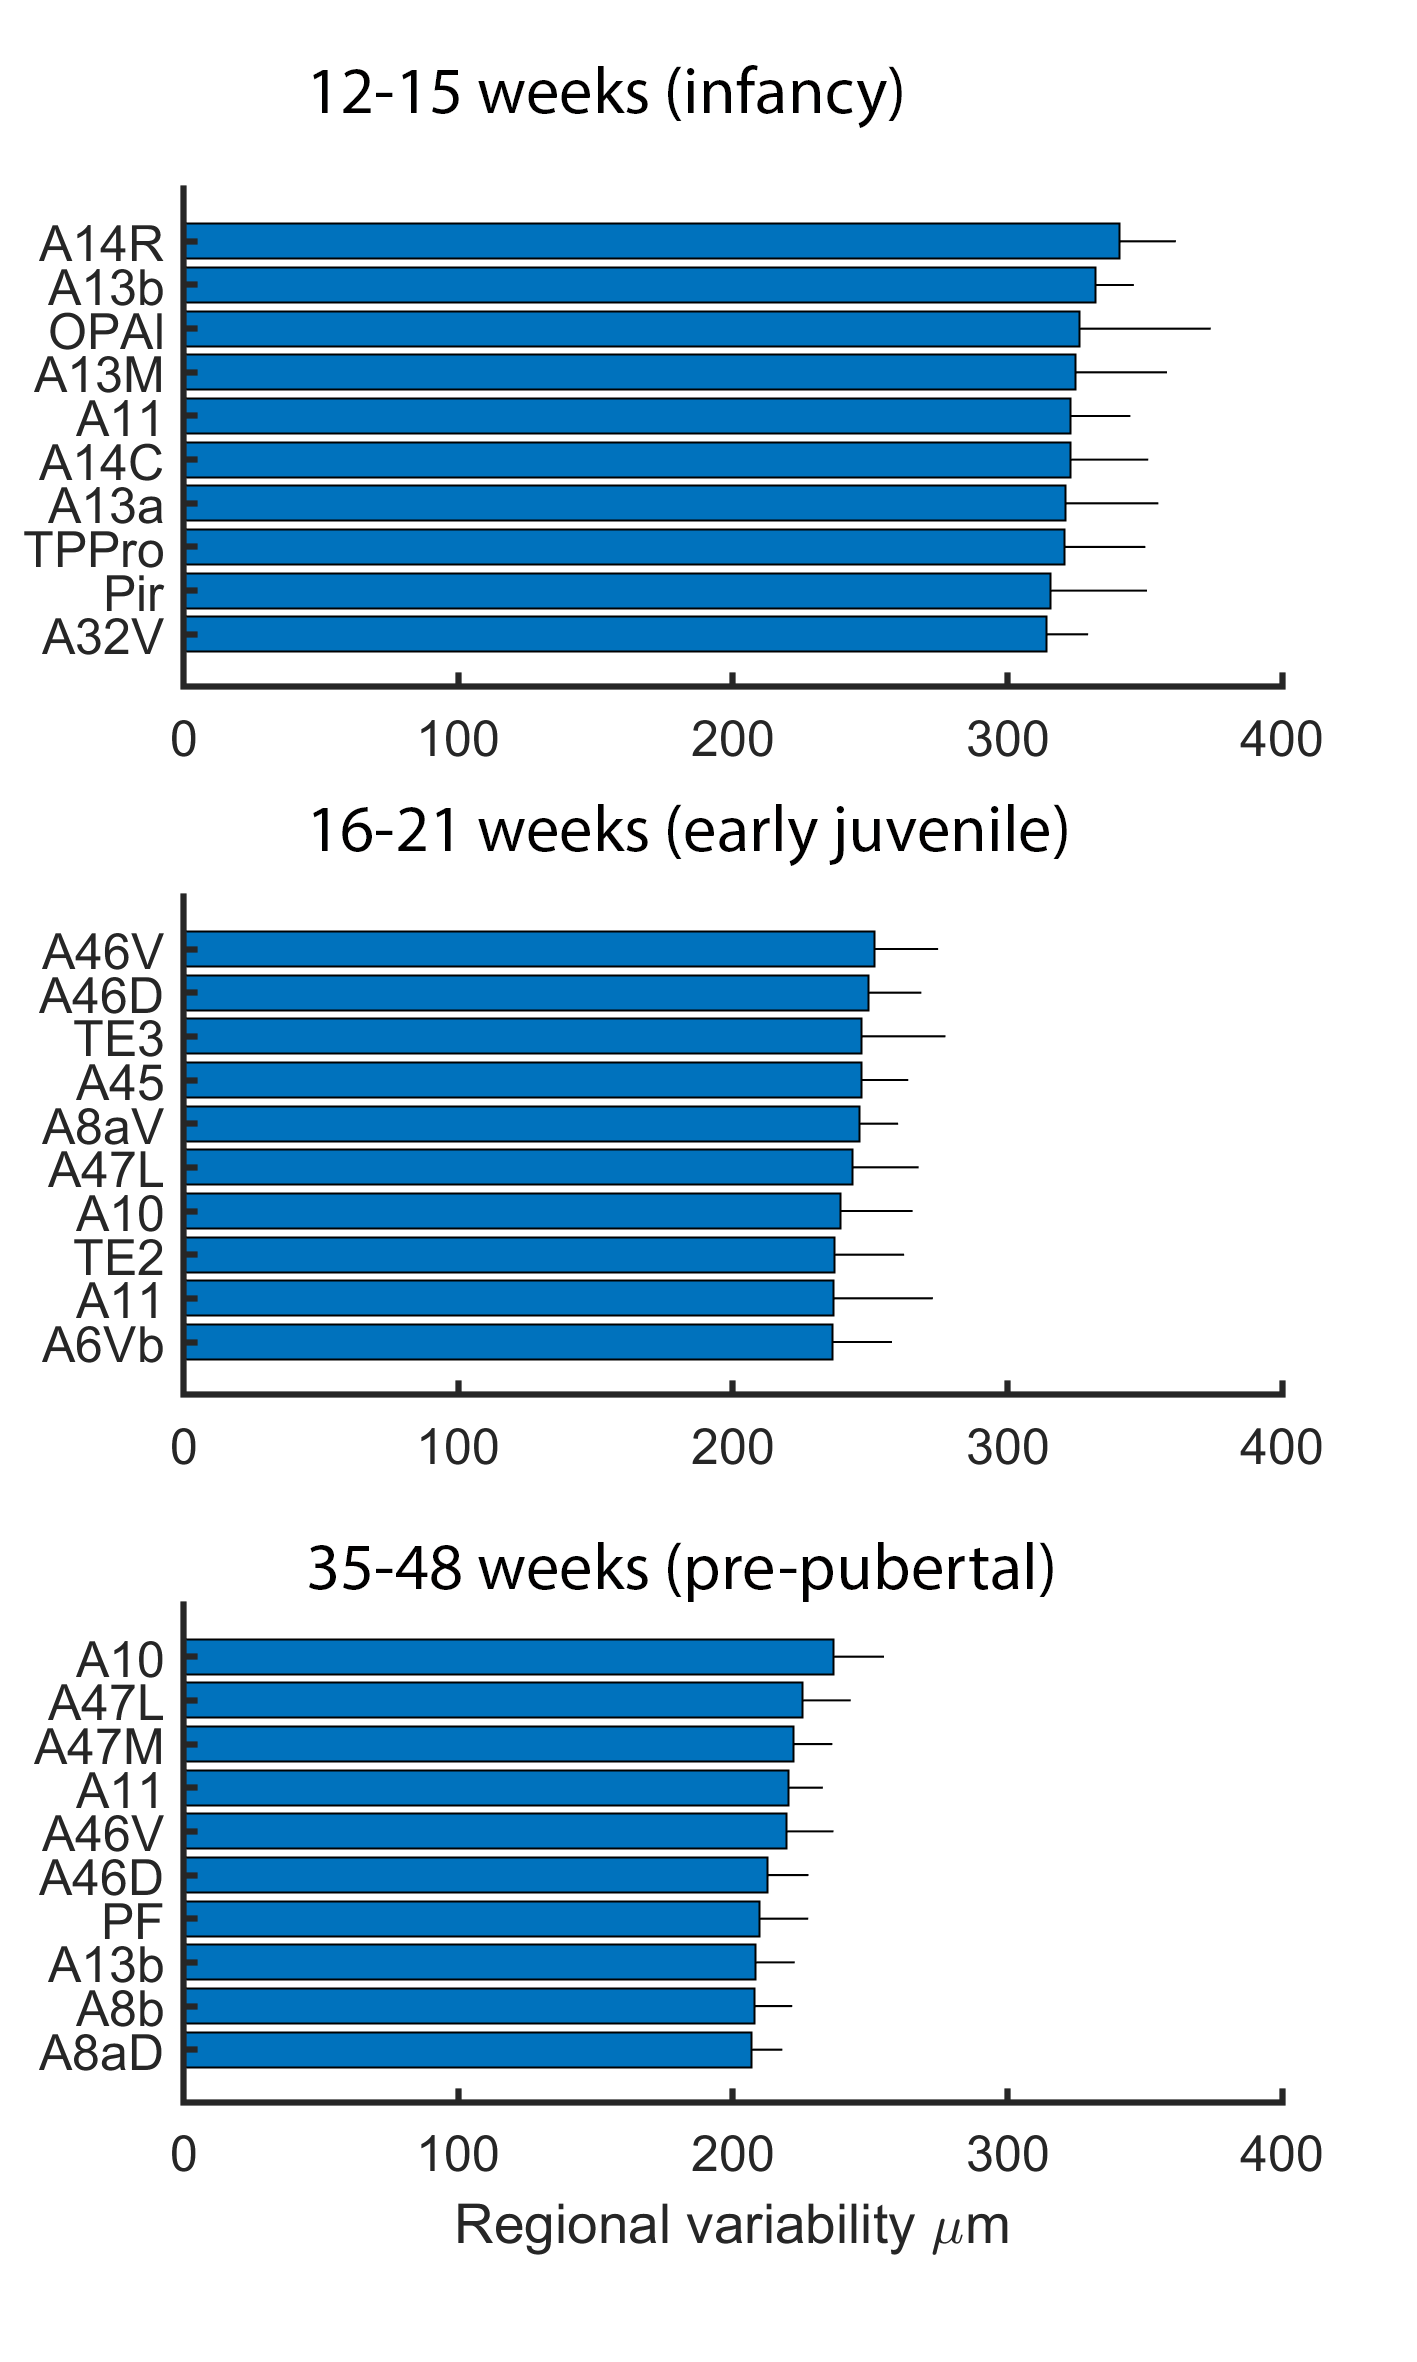
Minimum-deformation atlases at each age are shown in Figure 1 and variability maps for each group as coronal sections and 3D reconstructions of the cortical surface in Figure 2. Note that while the mean images of the atlas show superficially similar anatomy between the first two age points (Figure 1), there are striking differences in the variability maps at these ages (Figure 2).Greatest anatomical variability is seen during infancy. This variability is highly regionally-selective, being most prominent in the prefrontal cortex and anterior temporal lobe, compared to the rest of the brain. This is particularly striking in orbitofrontal (A11, A13) and medial prefrontal areas (A14, A32) in infancy, shifting to lateral prefrontal regions (A45, A46 and A47) and the frontal pole (A10) in older animals approaching puberty. In contrast, in the anterior temporal lobe, including anterior hippocampal formation, the high variability is restricted to infancy and early juvenile periods whilst that in the cerebellum and dorsal occipital cortex is almost exclusively restricted to infancy.
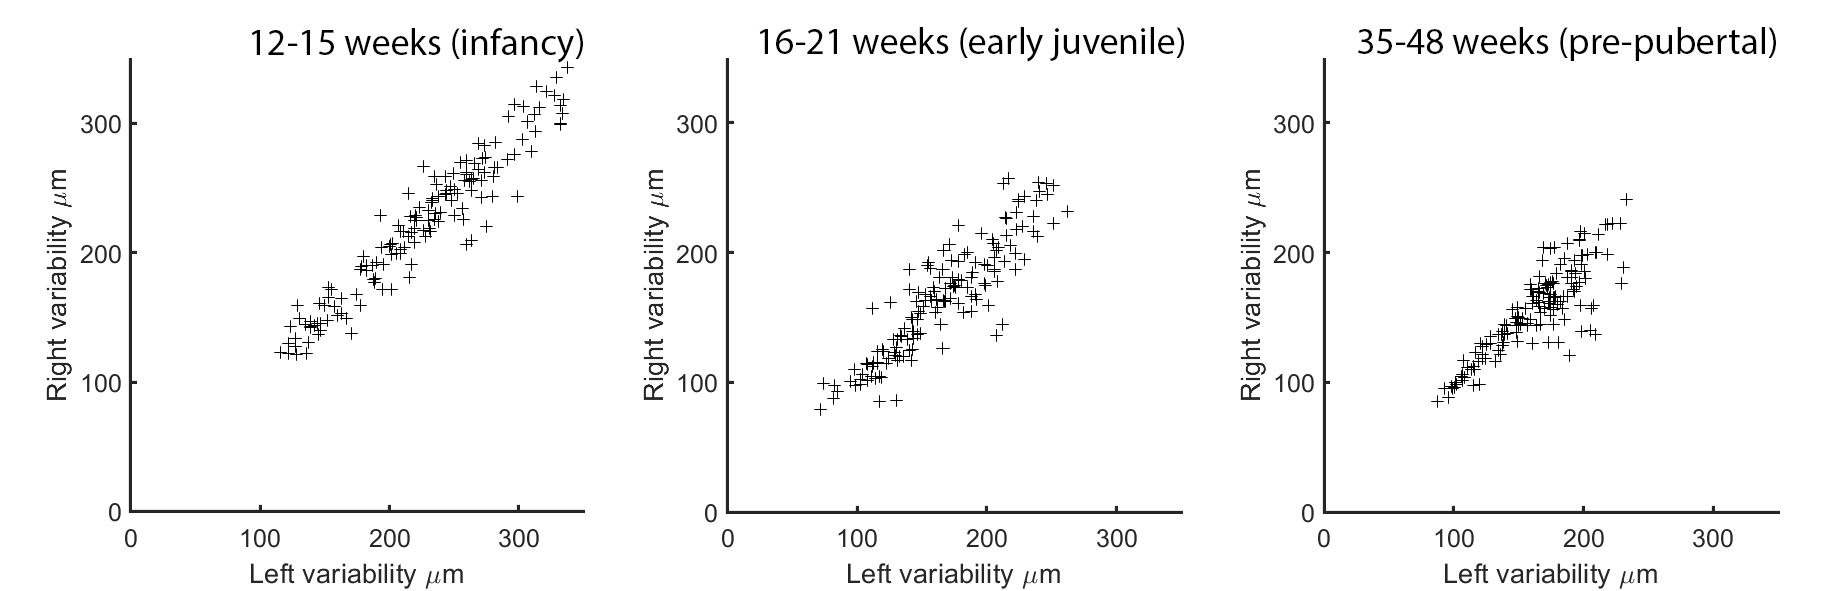
The ten most variable regions for each age group are depicted in Figure 3. In each case, the majority (8 or 9 out of 10) of the regions are in prefrontal cortex. Anatomical variability is broadly symmetric across hemispheres (Figure 4) but falls with age: R2 for each group between variability of left-right structures is 0.92, 0.81, and 0.74. Differences between infancy and early juvenile are significant (Fisher’s z-transformation two-tailed p = 1.2×10⁻⁴) but not between early juvenile and pre-pubertal groups (p = 0.13).
Discussion
We show here that the prefrontal and anterior temporal association cortex feature strongly in anatomical variability maps in early childhood. These correspond to a recently described apex transmodal network of higher-order association regions in the marmoset brain[8], being areas of high expansion in primate evolution as they differ the most between primates of different brain sizes[9]. The protracted development of these association regions reported previously[2] suggested a window of vulnerability for those structures in late adolescence. Here, we identify a second window of potential vulnerability for these structures in infancy as reflected in the marked individual variation specific to those areas and this time-period.Conclusion
If rapid changes in anatomy correspond to temporal windows of vulnerability to environmental perturbation these data suggest the first 15 weeks of life may be a crucial period for normal development of prefrontal and anterior temporal lobe cortical regions.Acknowledgements
No acknowledgement found.References
1. Kessler, R.C., et al., Lifetime prevalence and age-of-onset distributions of DSM-IV disorders in the National Comorbidity Survey Replication. Arch Gen Psychiatry, 2005. 62(6): p. 593-602.
2. Sawiak, S.J., et al., Trajectories and Milestones of Cortical and Subcortical Development of the Marmoset Brain From Infancy to Adulthood. Cereb Cortex, 2018. 28(12): p. 4440-4453.
3. Ashburner, J. and K.J. Friston, Unified segmentation. Neuroimage, 2005. 26(3): p. 839-51.
4. Ashburner, J., A fast diffeomorphic image registration algorithm. Neuroimage, 2007. 38(1): p. 95-113.
5. Kovacevic, N., et al., A three-dimensional MRI atlas of the mouse brain with estimates of the average and variability. Cereb Cortex, 2005. 15(5): p. 639-45.
6. Marmoset brain connectivity atlas. Available from: www.marmosetbrain.org.
7. Paxinos, G., The marmoset brain in stereotaxic coordinates. 2012, Amsterdam ; London: Academic.
8. Buckner, R.L. and D.S. Margulies, Macroscale cortical organization and a default-like apex transmodal network in the marmoset monkey. Nat Commun, 2019. 10(1): p. 1976.
9. Sneve, M.H., et al., High-Expanding Regions in Primate Cortical Brain Evolution Support Supramodal Cognitive Flexibility. Cereb Cortex, 2019. 29(9): p. 3891-3901.
Figures