2316
Assessing metabolic differences in rodents on high fat diet using Deuterium Metabolic Imaging1Division of Endocrinology and Metabolism, Department of Medicine III, Medical University Vienna, Vienna, Austria, 2Division of Nuclear Medicine, Department of Biomedical Imaging and Image-Guided Therapy, Medical University Vienna, Vienna, Austria, 3Division of Molecular and Structural Preclinical Imaging, Department of Biomedical Imaging and Image-Guided Therapy, Medical University Vienna, Vienna, Austria
Synopsis
Deuterium Metabolic Imaging (DMI) is a novel method to assess metabolism in vivo using 2H MR Spectroscopic Imaging (MRSI) combined with the administration of deuterated substrates. In this pilot study, we applied 2D DMI following an intravenous injection of deuterated glucose and palmitic acid to evaluate the differences in liver metabolism of rats on standard and high fat diet at 9.4T. The spectra show a lower uptake of glucose and a higher uptake of palmitic acid after injection in high fat diet rats, indicating that liver metabolism is slowed down in rats with fatty livers.
Introduction
One of the main features related to metabolic syndrome is the dysregulation of hepatic glucose and lipid metabolism. So far, 13C MRS has been used for metabolic imaging but at the drawback of a low intrinsic sensitivity and/or a technically demanding procedure, making multi-dimensional MRS imaging unfeasible.Deuterium Metabolic Imaging (DMI) is an innovative approach for evaluating metabolism using 2H MR Spectroscopy (MRS) after an injection of deuterated substrates, giving great insight into metabolic processes of healthy and diseased brain1,2, brown adipose tissue3 and tumor tissue4. It provides metabolic maps for visualizing glucose transport and downstream metabolism2,3,5. In the present pilot study, we use 2D DMI with intravenous administration of deuterated glucose and palmitic acid (PA) to show metabolic differences in rats on high fat (HFD) and standard diet (SD).
Methods
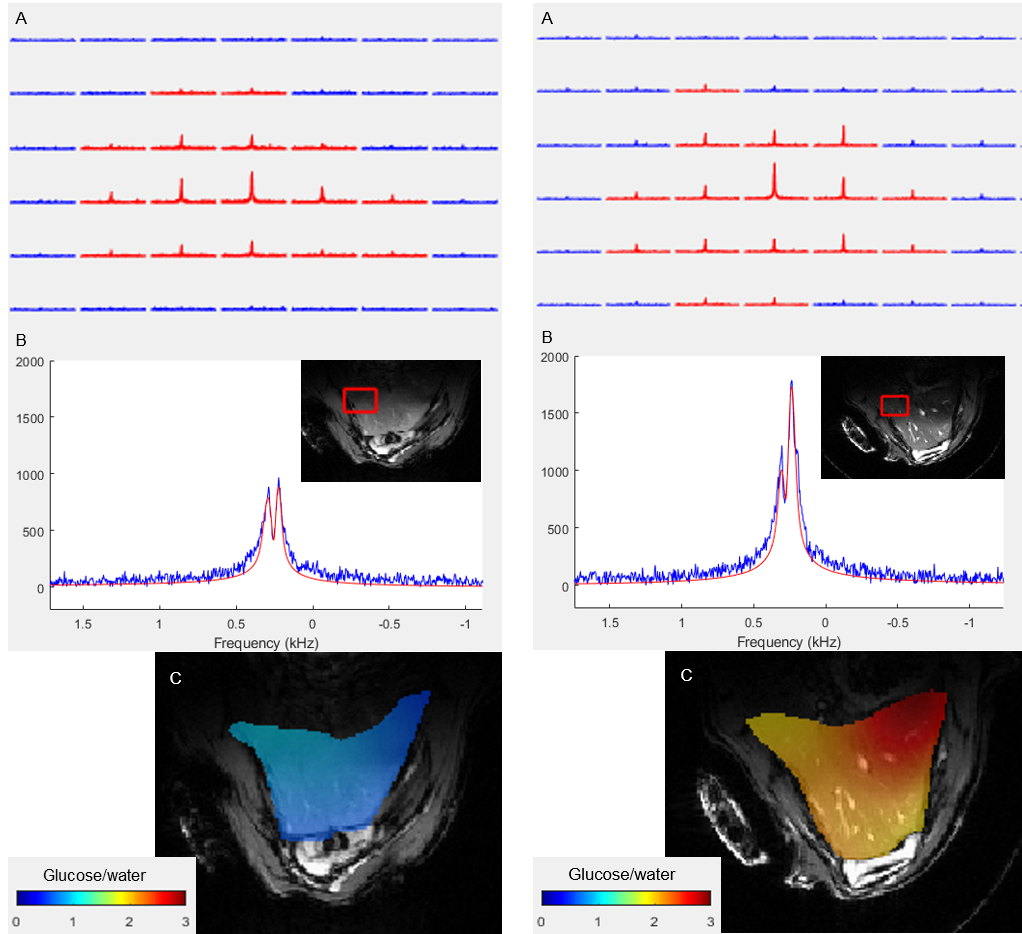
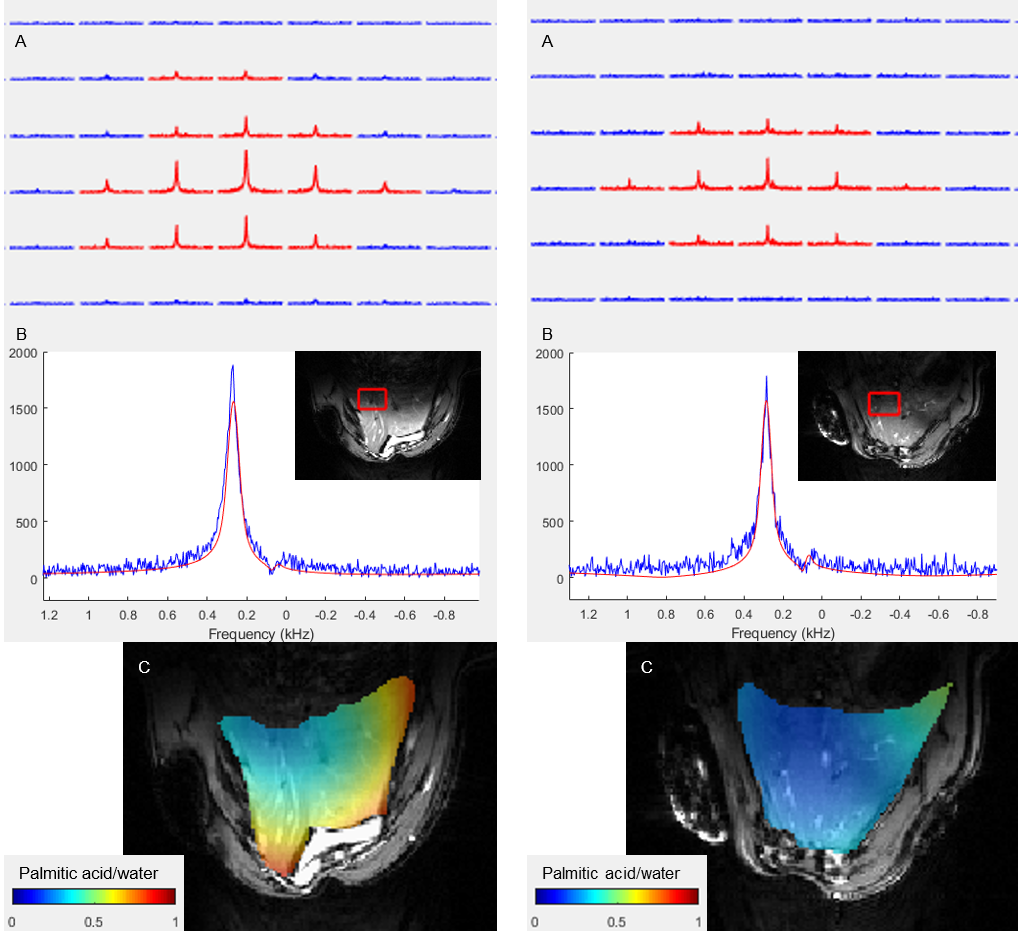
DMI measurements were performed on Biospec 94/30 (Bruker Biospin, Germany) MR system with a 2H/1H surface RF coil (Ø=40mm, Rapid, Germany) adjusted for abdominal region. Before the DMI experiments, a conventional MRI was done to optimize the B0 shim.Following an intravenous bolus injection of [6,6’2H2]glucose (1.95g/kg bw) or palmitate (palmitic acid-d31) (0.0065g/kg bw) in the caudal vein, a 2-dimensional chemical shift imaging (CSI) sequence (TR=350ms, FA=61.6°, matrix 12x12mm, FOV=50x36mm) was applied without respiratory gating. Groups of Sprague Dawley rats following a high fat diet (n=3, m=525-640g, age=12 weeks, 60% of calories from pure fat) or standard diet (n=3, m=330-390g, age=12 weeks) were examined for each substrate, respectively. To improve the signal by minimizing artifacts from cardiac motion, a saturation slab of 10 mm was placed over the heart. The signal to noise ratio (SNR) of the DMI measurements was enhanced using a Hamming-weighted k-space acquisition mode. With 128 averages for glucose DMI and 192 for palmitic acid, the acquisition time was around 27 and 41 min, respectively. Underlying anatomic 1H MR images for DMI were acquired in identical FOV using an axial T1-weighted FLASH sequence (TR=30ms, averages=20, FA=30°, matrix 120x120) under respiratory gating.
The acquired MRS data were pre-processed and analyzed using the Matlab based tool DMIWizard2. Spectra were quantified with linear least-squares fitting and the resulting amplitudes translated to concentration according to the 2H natural abundance water peak. The resulting post-injection maps were corrected for the respective physiological baseline signal of glucose or lipids in the liver.
Results
Chosen DMI acquisition strategy yielded sufficient SNR and spectral resolution for both infusion protocols in both, SD and HFD rats, in several 2H MRSI voxels co-registered within homogeneous liver parenchyma (Figures 1 and 2).Quantification of the spectra yielded significantly (p=0.00005) lower post-infusion glucose levels in rodent livers following a HDF (mean glucose/water=0.67±0.51) than with SD (mean glucose/water=2.21±0.90). In contrast, the high fat animals had higher levels (p=0.000001) of palmitic acid uptake (mean PA/water=1.01±0.27) after infusion than the SD animals (mean PA/water=0.13±0.18). However, the difference between HFD and SD animals is not as high here as after the glucose administration.
Discussion
Following the injection of deuterated substrates, the 2H spectra show peaks from the naturally abundant and the metabolized heavy water (HDO), as well as glucose or palmitic acid, respectively. The higher glucose levels in livers of SD animals indicate the higher hepatic insulin sensitivity in lean animals, whereas the low glucose levels following injection in livers of HFD animals point toward the insulin resistance, giving evidence of an impaired and slower liver metabolism. The higher hepatic uptake of palmitic acid in HFD animals confirms their phenotype with metabolic disorder. Ingested fats are preferentially stored in ectopic sites of the body.Future studies will focus on improved experimental standardization regarding the overnight fasting so that the metabolic status of the liver of all animals is fully comparable at the time of measurement. Furthermore, the quantification of hepatic fat content before the injection of the deuterated substrates is also necessary for correct quantification of metabolic fluxes.
Conclusion
DMI provides a method for visualizing metabolism in vivo making an assessment of differences in metabolically healthy and impaired rodents possible. Thus, DMI holds great potential for the detailed study of metabolic disorders associated with a wide variety of diseases, such as fatty liver disease or diabetes type 2.Acknowledgements
This study was funded by the Vienna Science and Technology Fund (WWTF #LS19-046). We thank Robin de Graaf from Yale University for advice and support with DMIWizard.
References
1. Straathof M, Meerwald, A, De Feyter HM, et al. Deuterium Metabolic Imaging of the Healthy and Diseased Brain. Neuroscience 2021;474:94-99.
2. De Feyter HM, Behar KL, Corbin ZA, et al. Deuterium metabolic imaging (DMI) for MRI-based 3D mapping of metabolism in vivo. Sci Adv. 2018;4(8):eaat7314.
3. Riis-Vestergaard M, Laustsen C, Ostergaard Mariager C, et al. Glucose metabolism in brown adipose tissue determined by deuterium metabolic imaging in rats. International Journal of Obesity 2020;44:1417-1427.
4. Kreis F, Wright AJ, Hesse F, et al. Measuring Tumor Glytolytic Flux in Vivo by Using Fast Deuterium MRI. Radiology 2020;294:289-296.
5. De Graaf RA, Hendriks AD, Klomp DWJ, et al. On the magnetic field dependence of deuterium metabolic imaging. NMR in Biomedicine 2020;33:e4235.
Figures