2313
Evaluation of Placenta Oxygenation and Perfusion in A Rat Model of Fetal Growth Restriction Using Quantitative T2* Mapping and 3D DCE-MRI1Biomedical engineering and physics, Amsterdam University Medical Center, Amsterdam, Netherlands, 2University Medical Center Utrecht, Utrech, Netherlands
Synopsis
Developing preclinical imaging techniques in the field of preeclampsia is essential to test the effectiveness of new therapeutic approaches. We applied T2* weighted and three-dimensional dynamic contrast-enhanced MRI in a pregnant rat model of reduced uterine perfusion pressure (RUPP) to test their feasibility and ability to detect differences in placental oxygenation and perfusion in RUPP rats compared to control. These techniques produced high-quality data that enabled the assessment of oxygenation and perfusion parameters. Oxygenation was decreased in RUPP placenta; however, perfusion parameters did not reveal differences, which requires further investigations.
Purpose
Preeclampsia (PE) and fetal growth restriction (FGR) are pregnancy-related systemic syndromes driven by placenta dysfunction, in which oxygen and nutrient supply to the fetus is insufficient. For preclinical research on placental dysfunction and possible therapeutic strategies, the reduced uterine perfusion pressure (RUPP) rat model has been established1. Two important outcome measures for the assessment of placenta dysfunction are placental oxygenation and perfusion. The purpose of this study was to develop a preclinical MRI protocol to assess rat placental oxygenation and perfusion using quantitative T2* mapping three-dimensional dynamic contrast-enhanced (3D DCE) MRI, respectively, and to establish whether these techniques can measure differences between healthy and RUPP placentas in the rat.Methods
Animal experiment:Pregnant Sprague Dawley rats were subjected to sham (n=5) or RUPP (n=6) surgery on gestational day (GD) 13. The RUPP model was achieved by clipping the ovarian arteries and abdominal aorta, intended to reduce the blood supply to the uterus. Animals were scanned at GD 19 on a 7T MRI scanner (MR Solutions, Guildford, UK). The MRI session consisted of T2-weighted anatomical imaging for localizing the placentas, followed by T2* weighted MRI for placental and fetal oxygenation assessment, and 3D-DCE MRI for perfusion assessment.
T2* MRI:
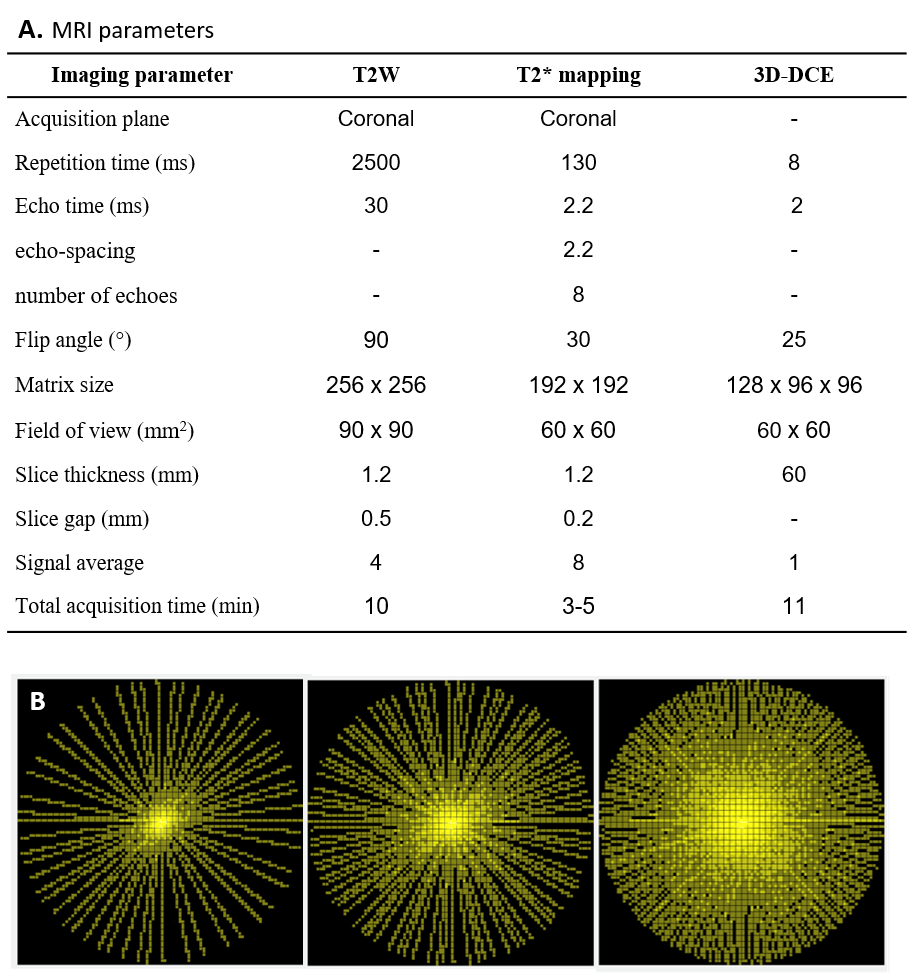
Quantitative T2* maps were based on a respiratory gated multi-slice multi-gradient-echo sequence with the following parameters: TR = 130 ms, TE0 = 2.2 ms, echo-spacing = 2.2 ms, number of echoes = 8, flip-angle = 30o, FOV = 60 x 60 mm2, matrix = 192 x 192, slice thickness = 1.2 mm, number of slices = 3-5, acquisition time = 3-5 min.
3D-DCE MRI:
Dynamic contrast-enhanced MRI was based on a 3D RF-spoiled gradient-echo sequence with the following parameters: TR = 8 ms, TE = 2 ms, flip-angle = 25o, FOV = 60 x 60 x 60 mm3, matrix = 128 x 96 x 96. K-space filling was done using a pseudo-radial scheme in the two phase-encoding directions and a tiny golden-angle increment of 16.95o between successive spokes (Fig. 1B). The pseudo-radial acquisition was repeated for 11 minutes. Subsequently, data were reconstructed with a temporal resolution of 22 seconds using a compressed sensing reconstruction algorithm with a total variation regularization in the temporal domain.
Results
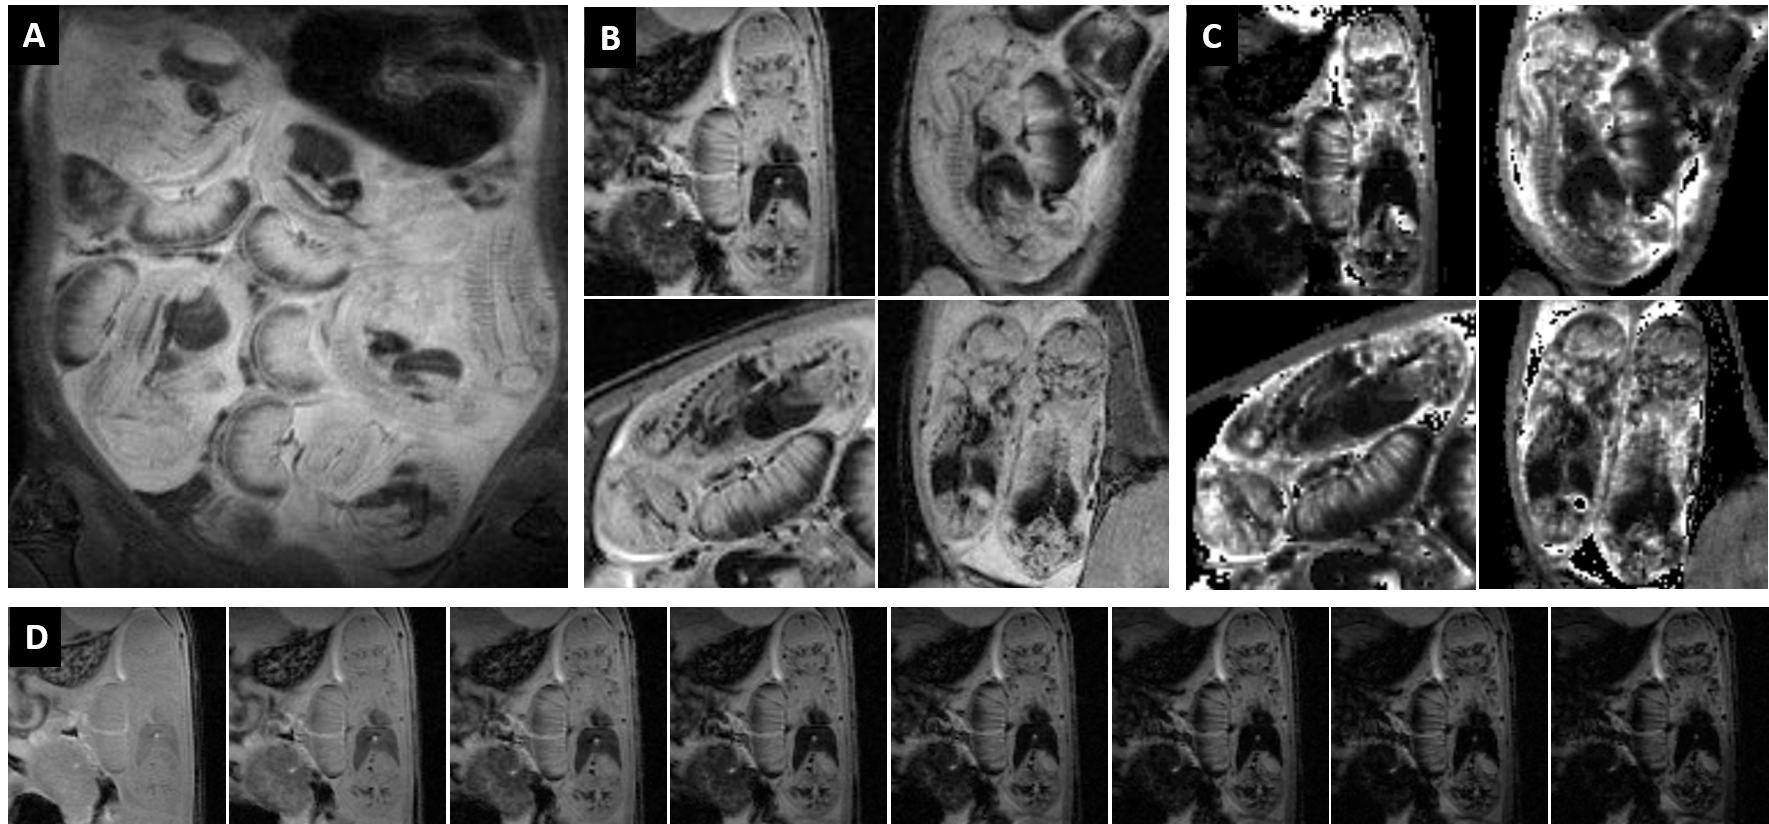
A typical T2-weighted anatomical scout scan is shown in Figure 2A along with representative examples of T2* weighted images from different fetuses (Fig. 2B) and their corresponding quantitative T2* maps (Fig 2C). For one case (Fig. 2D), the series of T2*-weighted images is given demonstrating the excellent image quality and delineation of several fetal organs at the different echo times. No further registration was needed in calculating the T2* maps. Figure 3 shows that the oxygenation status, as reflected by the R2* (1/T2*) values, was significantly lower in the maternal placental layer of the RUPP rats comparing to sham rats (p=0.01). However, no statistically significant differences between RUPP and sham rats were identified in the fetal placental layer, nor in the fetal brain or liver.3D dynamic contrast-enhanced imaging of rat placentas was feasible and provided full coverage to cope with the complex arrangement of the placentas in the abdomen. The temporal enhancement starting from the central arterial canal on the maternal side to the fetal side and back to the maternal side can be appreciated from the 3D-DCE time series (Fig. 3). The resulting signal intensity-time curves were analyzed semi-quantitatively by assessing the initial area under the curve (AUC) after signal normalization (Fig 5). No significant differences between the RUPP and sham rats were observed.
Discussion
The MRI protocols used in this study produced high-quality T2* mapping and high-temporal resolution 3D DCE MRI that can be used to study placenta oxygenation and perfusion parameters in pregnant rats. Most previous human and animal studies focus on the changes in T2*-weighted signals in response to a respiratory challenge2. Our study showed that quantitative T2* differences can be detected at baseline between RUPP and sham groups. The decrease in placenta T2* reflects a change in oxygenation, in keeping with the found in the human placenta in fetal growth restriction and other animal models of preeclampsia3,4. 3D DCE quality remained good up to temporal resolutions of 20-25 seconds. Although this allowed us to perform an AUC analysis of the contrast agent uptake, this did not reveal the expected differences between RUPP and sham rats. This can have different reasons, including the position of the fetuses in the uterine horns, variability in fetal and placental weights, variability in litter size, and variability in phenotype severity. These sources of variability made the distinction more difficult to be detected. In the future, we will focus on implementation of improved quantitative DCE modeling to overcome some of these issues, e.g. by making use of reference region models5 to prevent the need for fast arterial input function (AIF) measurements. Finally, we would like to validate our MRI protocol with alternative techniques, such as photoacoustic imaging and contrast-enhanced ultrasound.Conclusion
T2* mapping and 3D-DCE MRI can be successfully applied in pregnant rats to study changes in oxygenation and perfusion. Our rat model of fetal growth restriction showed significant changes in oxygenation, whereas differences in perfusion parameter were not observed.Acknowledgements
No acknowledgement found.References
1. Li J, LaMarca B, Reckelhoff JF. A model of preeclampsia in rats: The reduced uterine perfusion pressure (RUPP) model. Am J Physiol - Heart Circ Physiol. 2012;303(1). doi:10.1152/ajpheart.00117.2012
2. Sørensen A, Hutter J, Seed M, Grant PE, Gowland P. T2* weighted Placental MRI: Basic research tool or an emerging clinical test of placental dysfunction? Ultrasound Obstet Gynecol. 2019;55(3):293-302. doi:10.1002/UOG.20855
3. Sinding M, Peters DA, Frøkjær JB, et al. Placental magnetic resonance imaging T2* measurements in normal pregnancies and in those complicated by fetal growth restriction. Ultrasound Obstet Gynecol. 2016;47(6):748-754. doi:10.1002/UOG.14917
4. Collinot H, Marchiol C, Lagoutte I, et al. Preeclampsia induced by STOX1 overexpression in mice induces intrauterine growth restriction, abnormal ultrasonography and BOLD MRI signatures. J Hypertens. 2018;36(6):1399-1406. doi:10.1097/HJH.0000000000001695
5. Yankeelov TE, Luci JJ, Lepage M, et al. Quantitative pharmacokinetic analysis of DCE-MRI data without an arterial input function: a reference region model. Magn Reson Imaging. 2005;23(4):519-529. doi:10.1016/J.MRI.2005.02.013
Figures