2311
Highly Accelerated 4D Compressed Sensing Flow Sequence for Calf Muscle Strain and Strain Rate Tensor Mapping under Isometric Contractions
Usha Sinha1, Vadim Malis2, Brandon Cunnane1, Ning Jin3, and Shantanu Sinha2
1Physics, San Diego State University, San Diego, CA, United States, 2Radiology, UC San Diego, San Diego, CA, United States, 3Siemens Medical Solutions, Cleveland, OH, United States
1Physics, San Diego State University, San Diego, CA, United States, 2Radiology, UC San Diego, San Diego, CA, United States, 3Siemens Medical Solutions, Cleveland, OH, United States
Synopsis
The 4D CS-Flow sequence can be applied to image calf muscle motion during isometric contraction in order to extract 3D Strain tensors. The ability to extract the full 3D strain tensors should enable one to answer questions related to muscle deformation anisotropy in the transverse plane, volumetric strain and maximum shear strains.
Introduction
Prior studies of isometric contraction in calf muscle using velocity encoded phase contrast (VE-PC) imaging have used either single slice imaging to extract 2D strain and strain rate tensors [1] or sequentially acquired single slice images which were concatenated to form a volume to extract 3D strain and strain rate tensors [2]. The advantage of 2D VE-PC is that it is fast but requires acquiring the images in the plane of the fibers to leverage the fact that muscles exhibit planar deformation; a 3D acquisition circumvents the need for this positioning. A volume acquisition VE-PC sequence is usually too long for subjects to maintain consistent contractions through the scan duration. In this study, we explored a highly accelerated 4D Compressed Sensing flow sequence to image the much smaller motion seen in muscle tissue.Methods
Six young subjects were recruited after IRB approval and scanned on a 3-T Siemens Prisma scanner with a specially designed 8-Ch phased array coil. The leg was constrained in a foot pedal device with a strain sensor embedded in the foot-plate and a visual display of the current force curve superposed on a template allowed subjects to exert the target sub-maximal forces ~30%MVC. The force was continuously recorded during the acquisition. The prototype sequence was a highly accelerated (×7.7) Cartesian 4D flow imaging sequence using L1 regularized wavelet compressed sensing sequence [3,4]. Dynamic images of calf muscles were acquired under isometric contractions using a gated 4D CS Flow sequence (TE: 4.43 ms, TR: 51.2 ms, FA: 80), velocity encoded in all three directions (VENC=15 cm/sec), 2 k-space lines per segment, prospectively gated 50 temporal phases (cycle length of 2.9 sec), slab of 24 sagittal slices (5 mm thick slice partitions), FOV: 150 (PE) × 300 (RO) mm, Matrix Size: 66 (PE) × 160 (RO), 1.9 × 1.9 mm in-plane resolution. 3D strain and SR tensors were calculated for the acquired slices. Prior to the analysis, the phase-contrast images were corrected for phase shading artifacts and denoised using a 3D anisotropic diffusion filter. Voxels in the entire volume were tracked to obtain displacements and locations in subsequent temporal frames. The 3D strain and SR images were generated from the spatial gradients of the velocity and displacement images and diagonalized to yield Eulerian, E, and Lagrangian, L, strains and SR in the principal basis. Two invariants were calculated from the rank 2 strain and SR tensors (volumetric and maximum shear strain, Emax, Lmax and maximum shear strain rate SRmax). Quantitative analysis was performed for a ROI placed in medial gastrocnemius and soleus muscles. Indices were extracted at the frame corresponding to peak (negative) Eλ1(fiber) [displacements and strains] and SRλ1(fiber) [velocities and strain rates] during the contraction part of the cycle; here Eλ1, Lλ1 or SRλ1 correspond to the component of the strain and SR tensor that is closest to the fiber.Results
Figure 1 shows the displacements obtained from the whole volume tracking as a function of the dynamic cycle. Maximum displacements are seen in the foot-head direction (y-axis) and peak displacements occurs around frame 30 (peak of the force curve). Figure 2 shows the plot of the strains (Eulerian) eigenvalues for an ROI in the MG and in the soleus. Eλ1 is negative and represents compressive strains (direction of Eλ1 is closest to the muscle fiber direction). Eλ3 is positive and represents radial expansion in the fiber cross-section. The planar deformation in both the soleus and medial gastrocnemius is clearly evident in the very small values of Eλ2. Figure 3 shows a movie of the strain rate indices: SRλ1, SRλ3 and SRmax. A negative peak in SRλ1 occurs in the compression half while a positive peak occurs in the same time period in SRλ3. The maximum shear strain has peaks at the same temporal location. SRλ2 is not shown as its value similar to Eλ2 is very small. Table 1 shows the values of all the strain and strain rate indices calculated from the 3D strain and strain rate tensors for ROIs placed in the MG and SOL.Discussion
The 4D CS Flow sequence was originally implemented for blood flow imaging and tested for high values of VENC (> 100 cm/sec). This is one of the first adaptations of the high VENC flow imaging to map muscle contractions. The fact that this was a highly accelerated scan allowed true 3D acquisition (24 partitions) in ~5 minutes. This time was short enough to enable consistent isometric contractions at 30%MVC for young subjects. The values of strain, strain rate indices matched those of earlier dynamic studies on the plantarflexors [2]. The volumetric strain is small in the MG and soleus as it should be for an incompressible material. The non-zero volumetric strain values may be related to blood/other fluids moving in and out of the tissue.Conclusions
The 4D CS-Flow sequence can be applied to image calf muscle motion during isometric contraction in order to extract 3D Strain tensors. The ability to extract the full 3D strain tensors should enable one to answer questions related to muscle deformation anisotropy in the transverse plane, volumetric strain and maximum shear strains.Acknowledgements
This work was supported by the National Institute on Aging Grant No. R01AG056999.References
[1] Malis V, et al. Magn Reson Med. 2017; 79(2): 912-922
[2] Malis V, et al. Magn Reson Med. 2020; 84(1): 142-156
[3] Liang D et al. Magn Reson Med. 2009; 62:1574-1584
[4] Luis J et al. Proc. Int Soc. Magn Reson Med 2012;67
Figures
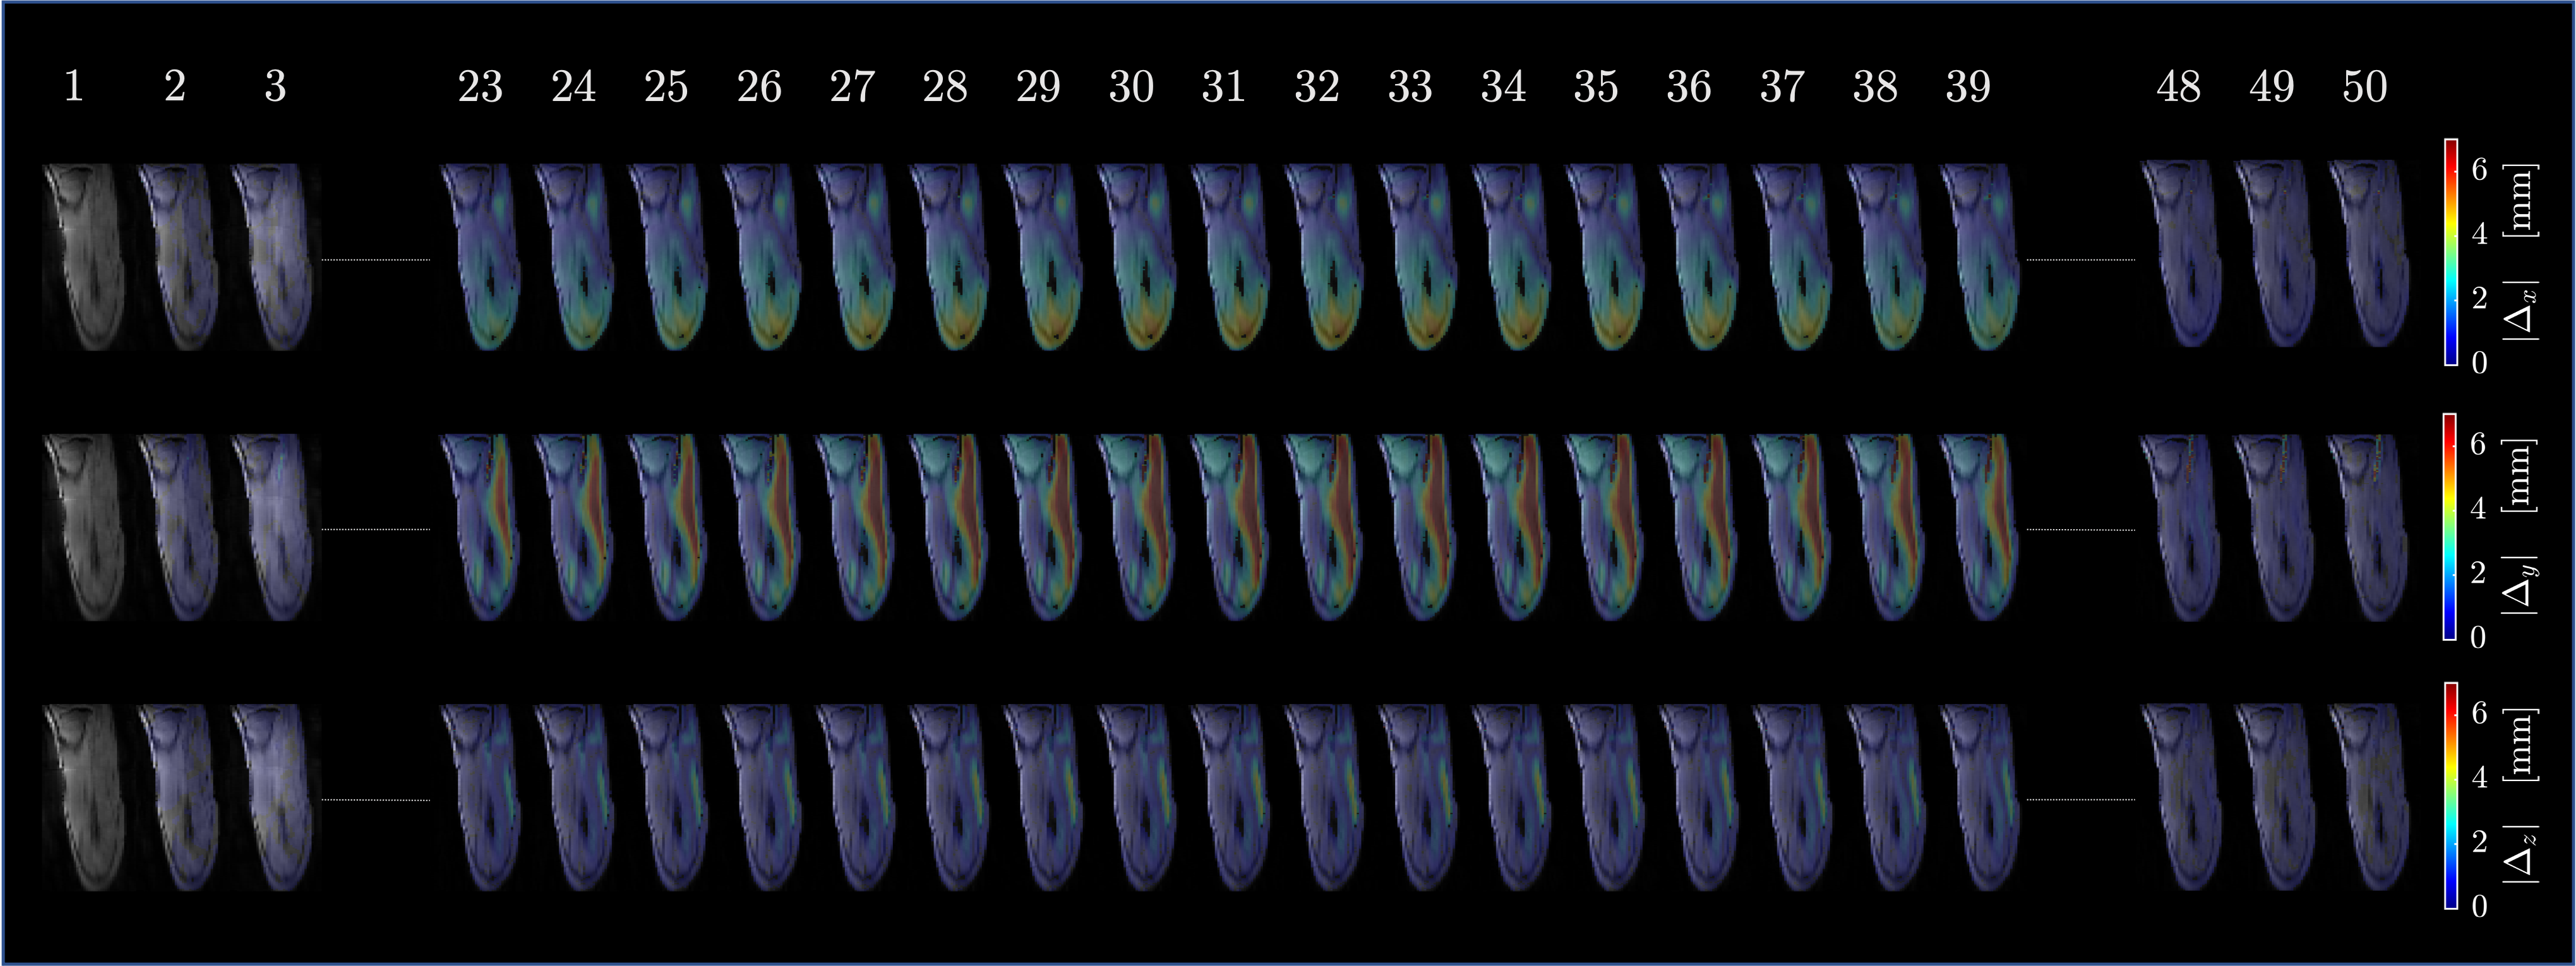
Figure
1. Colormaps of the absolute value
displacement (with respect to the first frame) superimposed over magnitude
images for the selected frames. Note minimum displacements at the first there
(1-3) and the last three (48-50) frames demonstrating return to the initial
position.
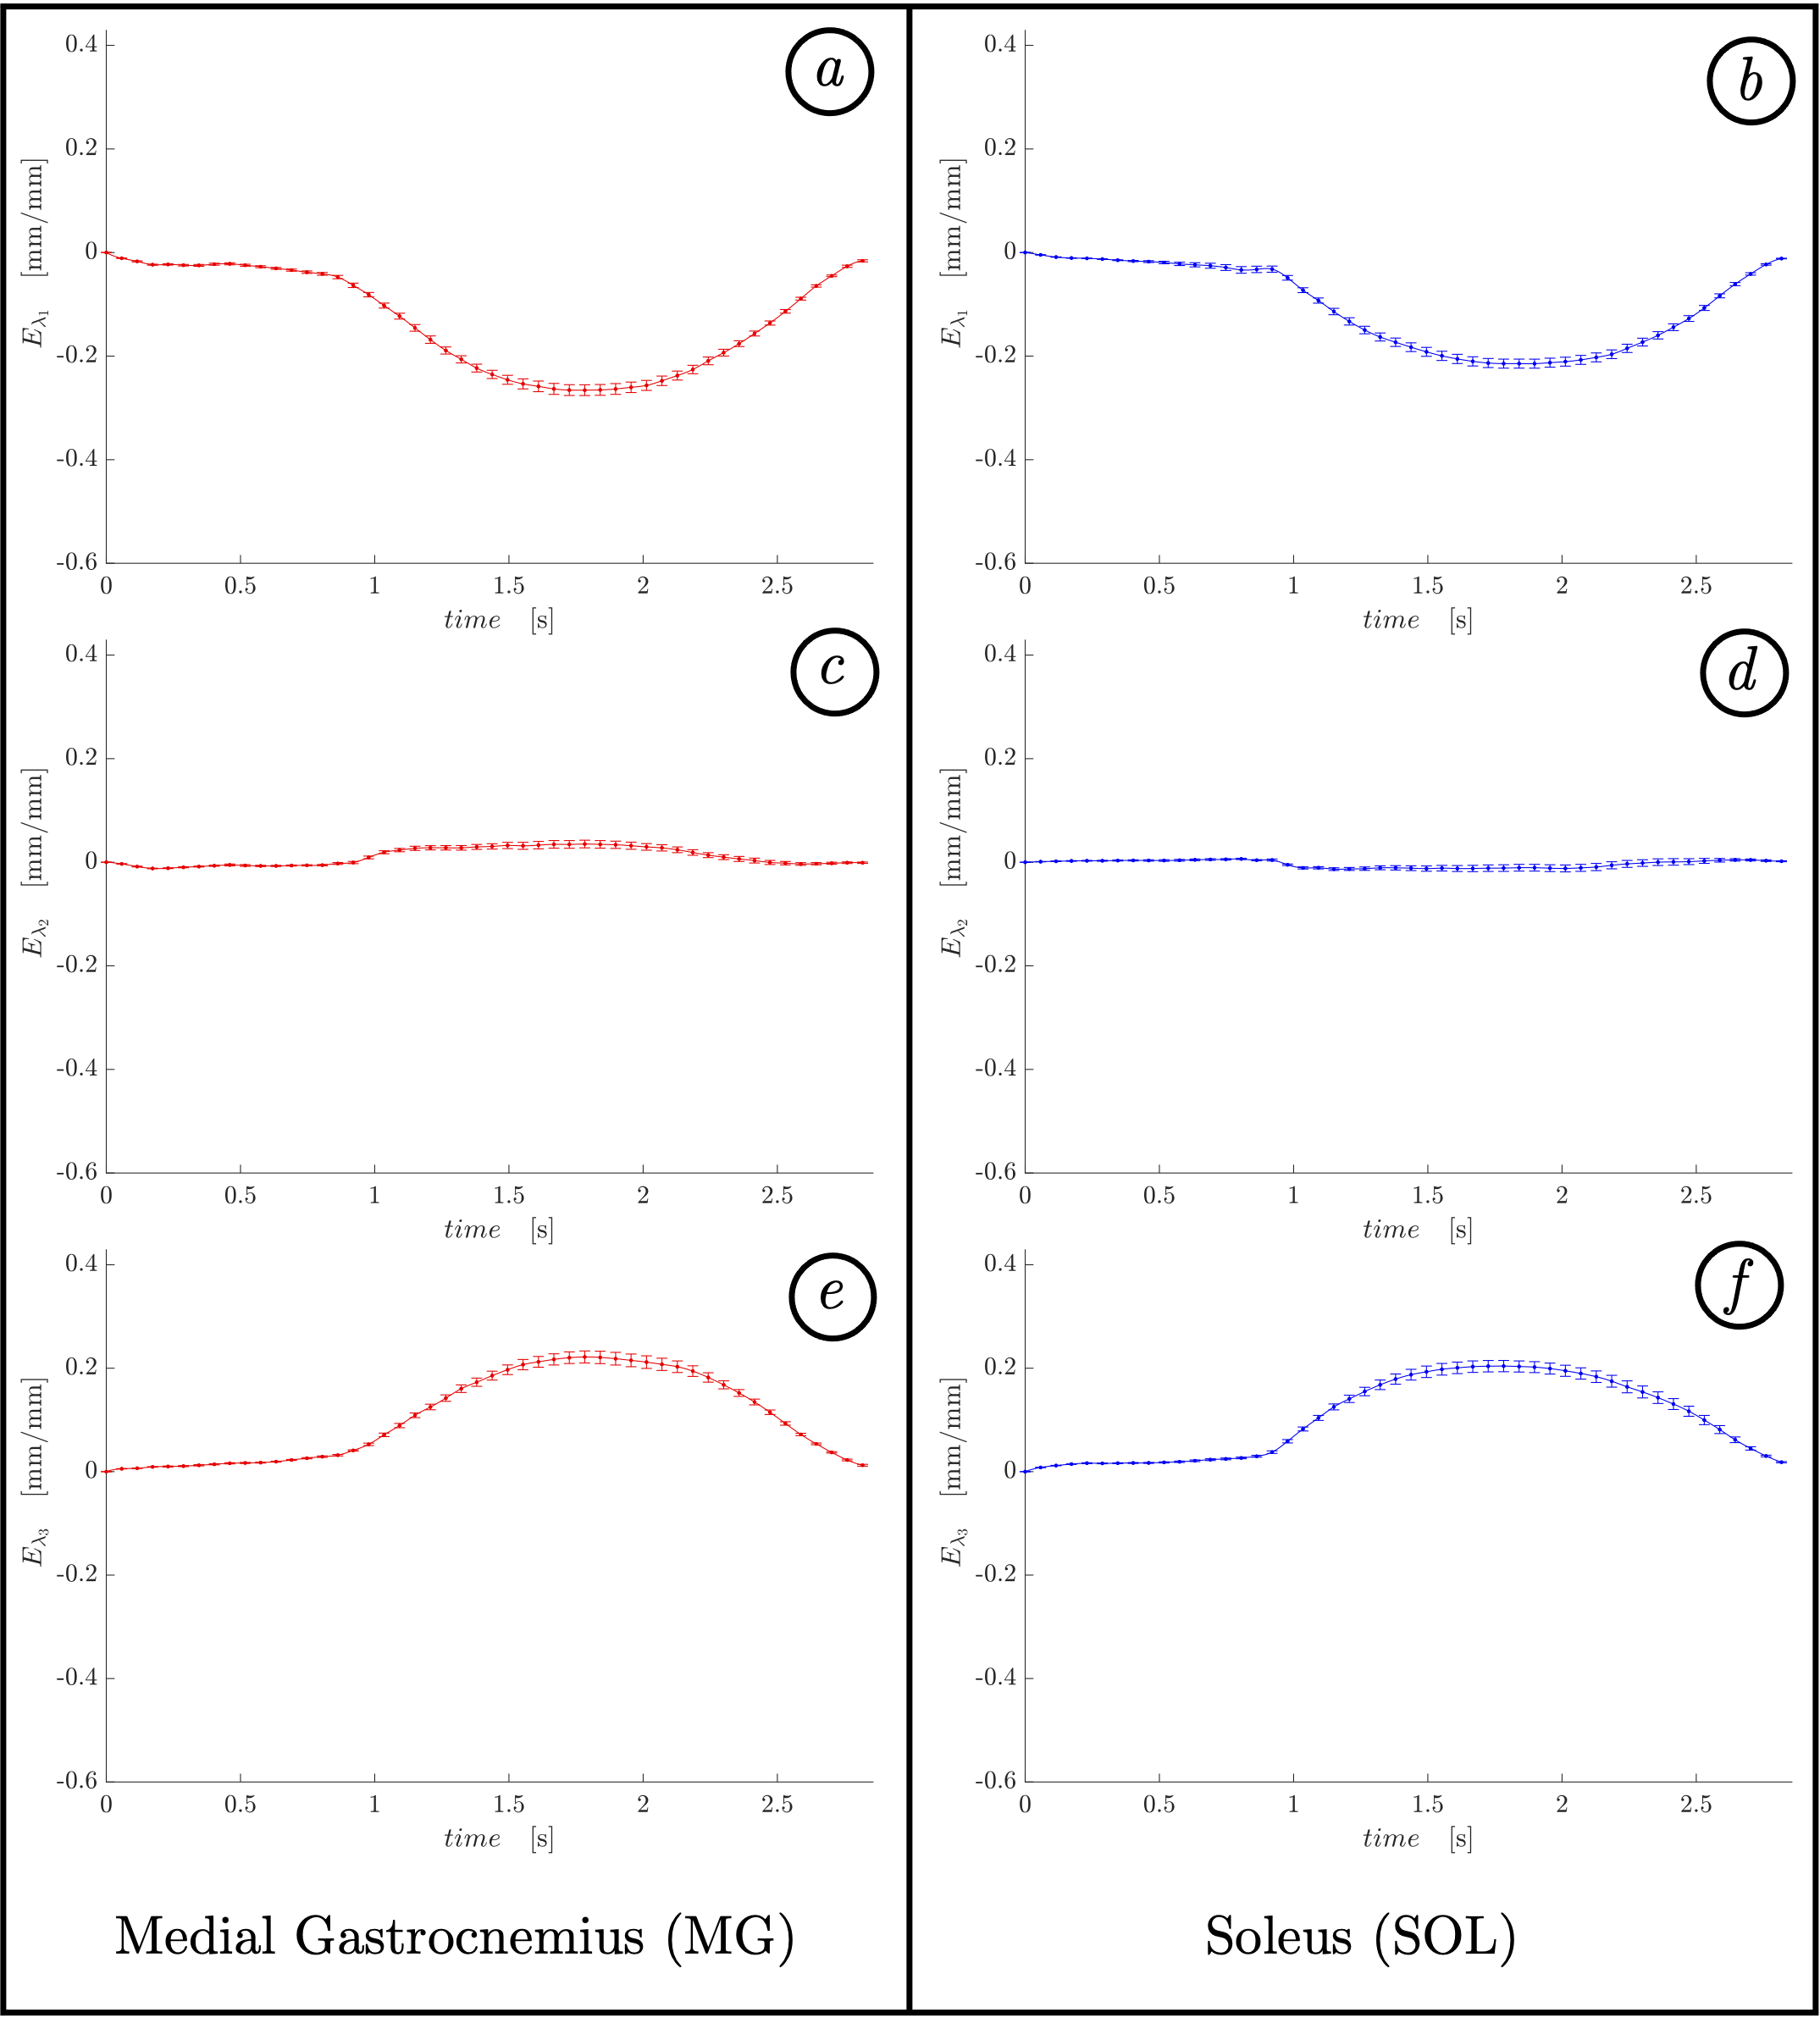
Figure 2. Time
evolution of eulerian
strain eigenvalues during a single contraction-relaxation averaged for two
regions of interest in MG (a, c, e) and
SOL (b,
d, f). Note pronounced
extremum
for 1st
(a,
b)
and 3rd
(e, f)
eigenvalues for both muscles slightly after the middle of the cycle
Figure
3. Changes in strain rate eigenvalues SRλ1 (a),
SRλ3 (b), and max shear strain rate SRmax (c)
during a contraction-relaxation cycle. Strain rate colormaps are superimposed
over magnitude images. Cycle progress is shown at the bottom.
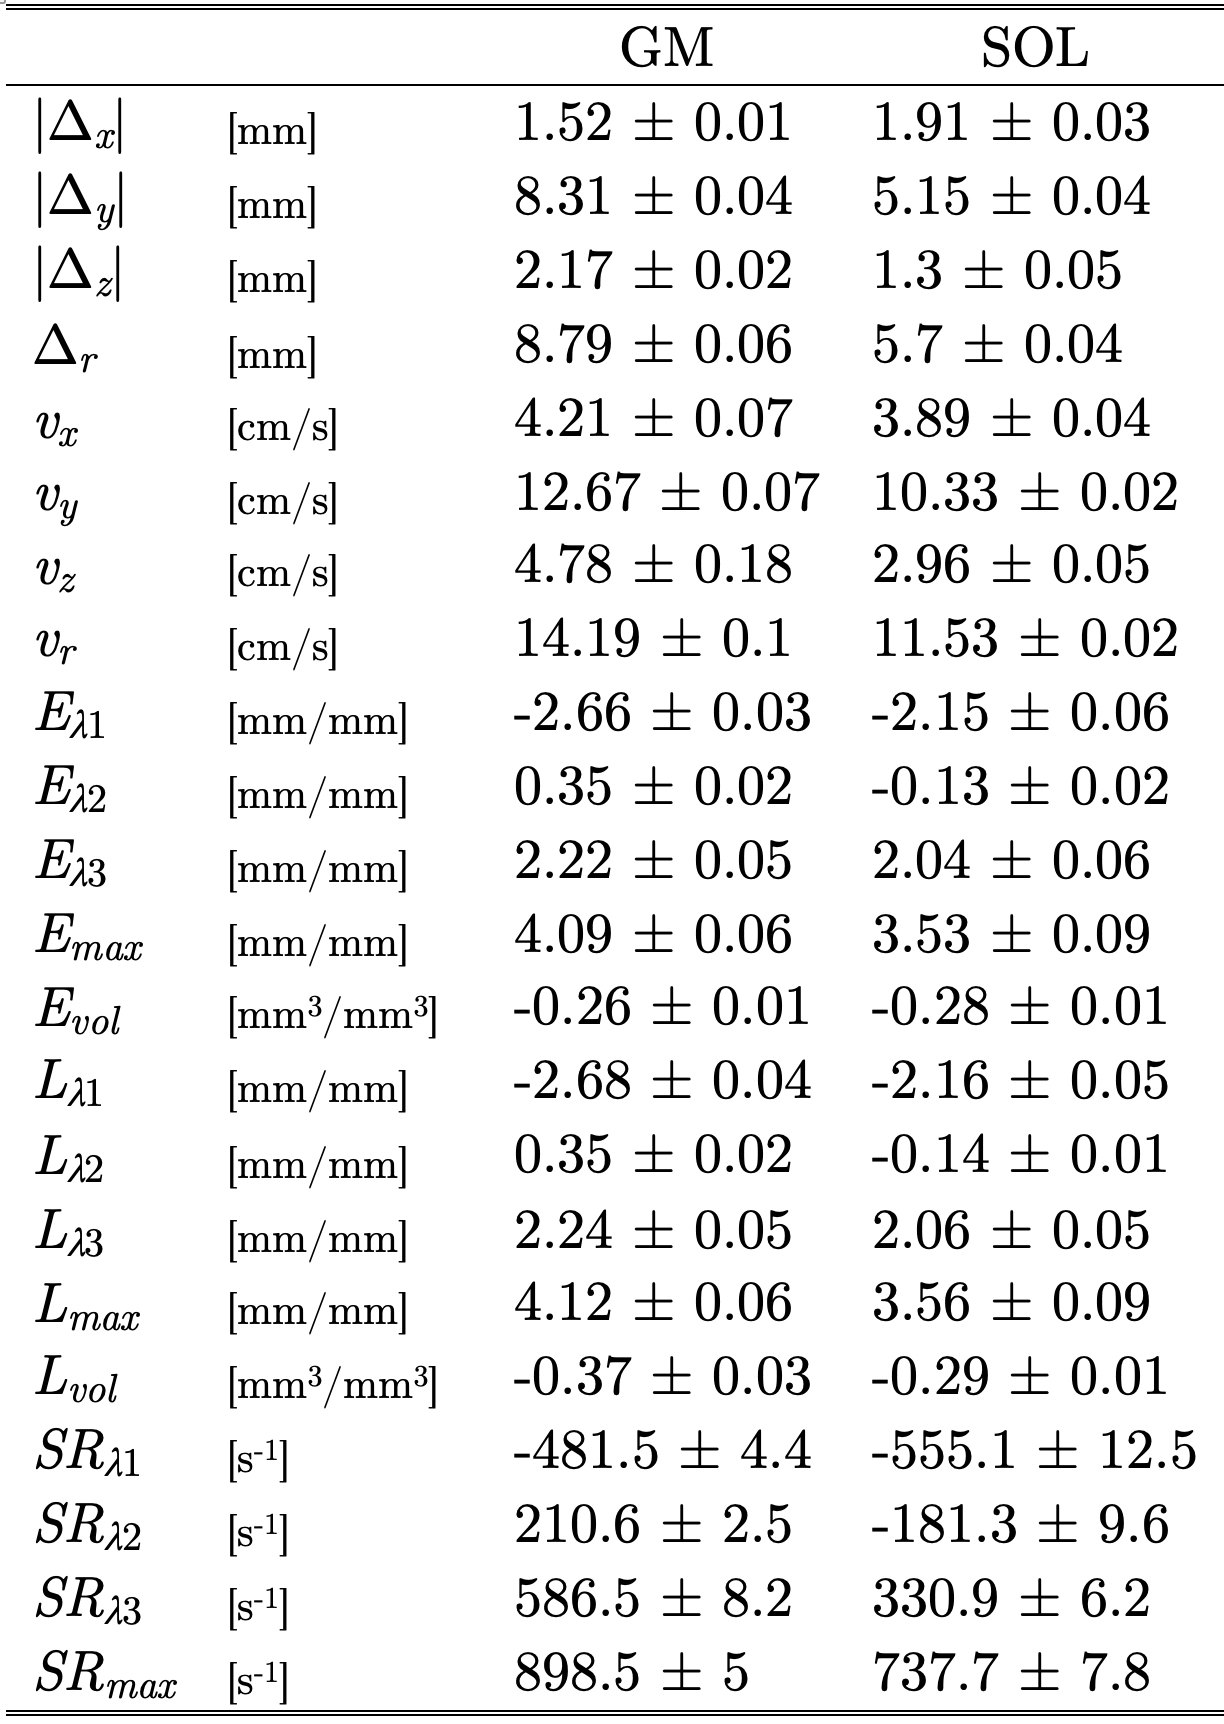
Table
1. Peak values of the parameters derived
from velocity encoded phase-contrast images for two regions of interest placed
in MG and SOL muscles
DOI: https://doi.org/10.58530/2022/2311