2307
Repeatability of Cartilage T2 relaxation times measures at 3T and 7T using quantitative double-echo in steady-state1Radiology, Stanford University School of Medicine, Stanford, CA, United States, 2Electrical Engineering, Stanford University, Stanford, CA, United States, 3Biomedical Data Science, Stanford University School of Medicine, Stanford, CA, United States, 4Orthopaedic Surgery, Stanford University School of Medicine, Stanford, CA, United States, 5Bioengineering, Stanford University, Stanford, CA, United States
Synopsis
Quantitative MRI can be used to track subtle cartilage microstructure changes within a subject, which could be helpful in the early detection, treatment, and prevention of osteoarthritis. Increased field strength may offer higher resolution for detecting these changes. This study demonstrated the repeatability of mean T2 relaxation times measured at 3T and 7T. Full thickness cartilage T2 relaxation times at 3T and 7T had excellent ICCs, with CVs at 3T generally lower than 7T. This study suggests 3T and 7T measures are repeatable and can be used in longitudinal studies of cartilage changes.
Introduction
T2 relaxation times are a quantitative MRI measure used to assess collagen microstructure and hydration levels of cartilage tissues. T2 relaxation times have widely been used to study early osteoarthritis (OA) changes, as increased T2 has been linked to future cartilage loss and OA disease progression1. These approaches have largely been applied at 3T2. However, the clinical approval of ultra-high field (7T) scanners for musculoskeletal applications offers new capabilities for quantitative T2 MRI mapping. Increasing field strength improves signal-to-noise ratio (SNR), which can be leveraged for faster acquisitions, higher resolutions, or improved signal levels and data fitting. However, a challenge of 7T imaging is the increase in B1 inhomogeneity, which may affect quantitative measures and compromise the reliability of the acquired data. The purpose of our study was to evaluate the repeatability of cartilage T2 relaxation times measurements performed using the qDESS sequence at 3T and 7T at one site.Methods
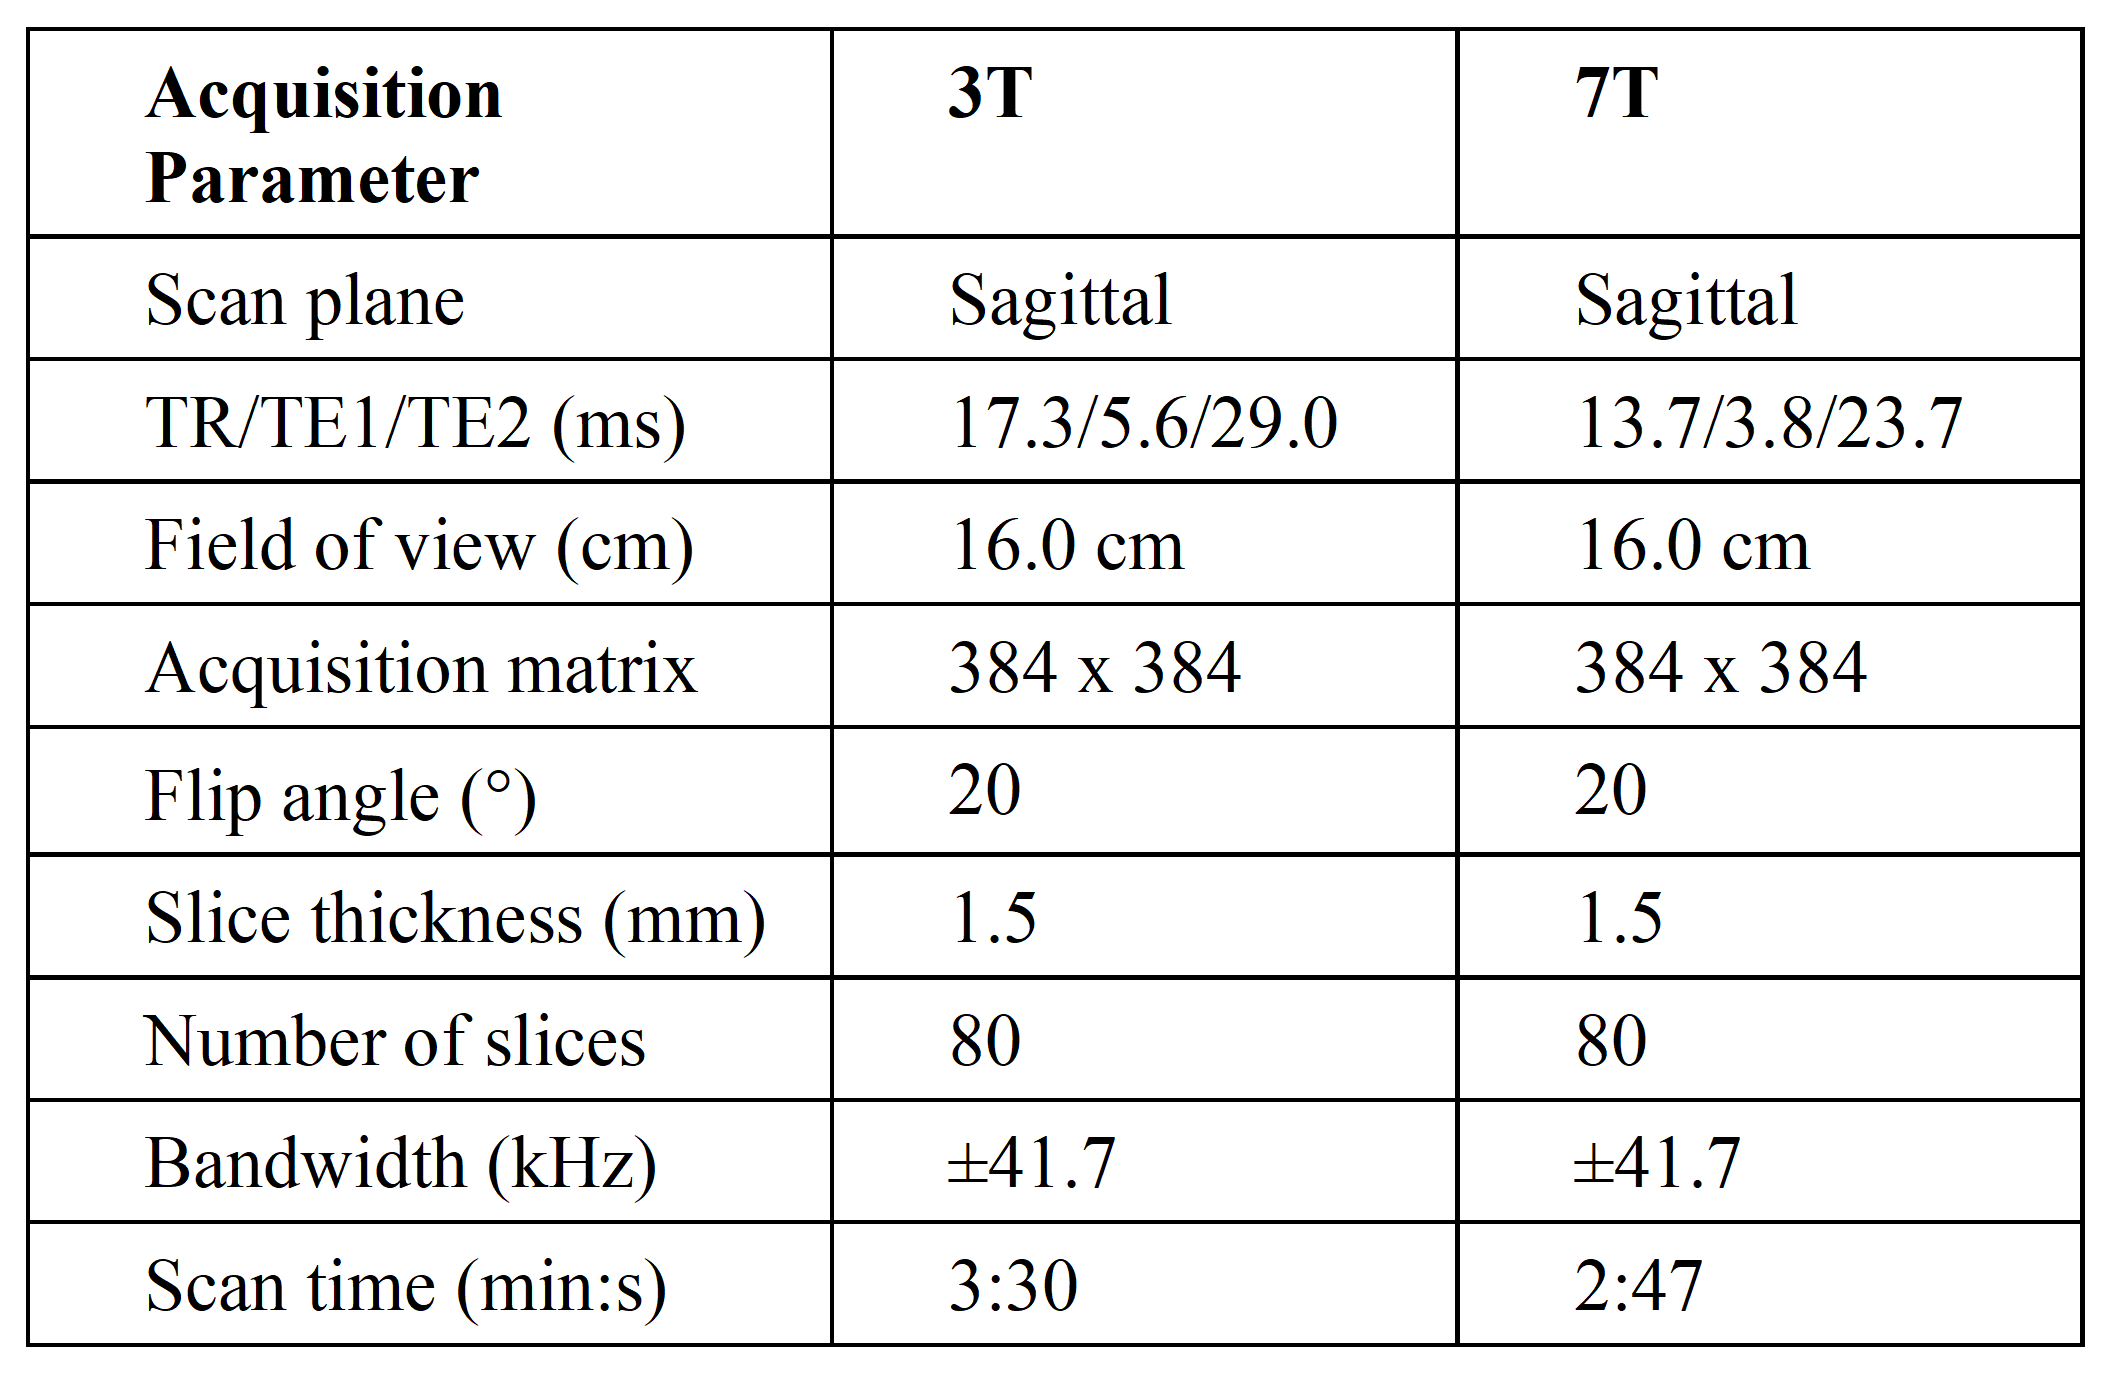
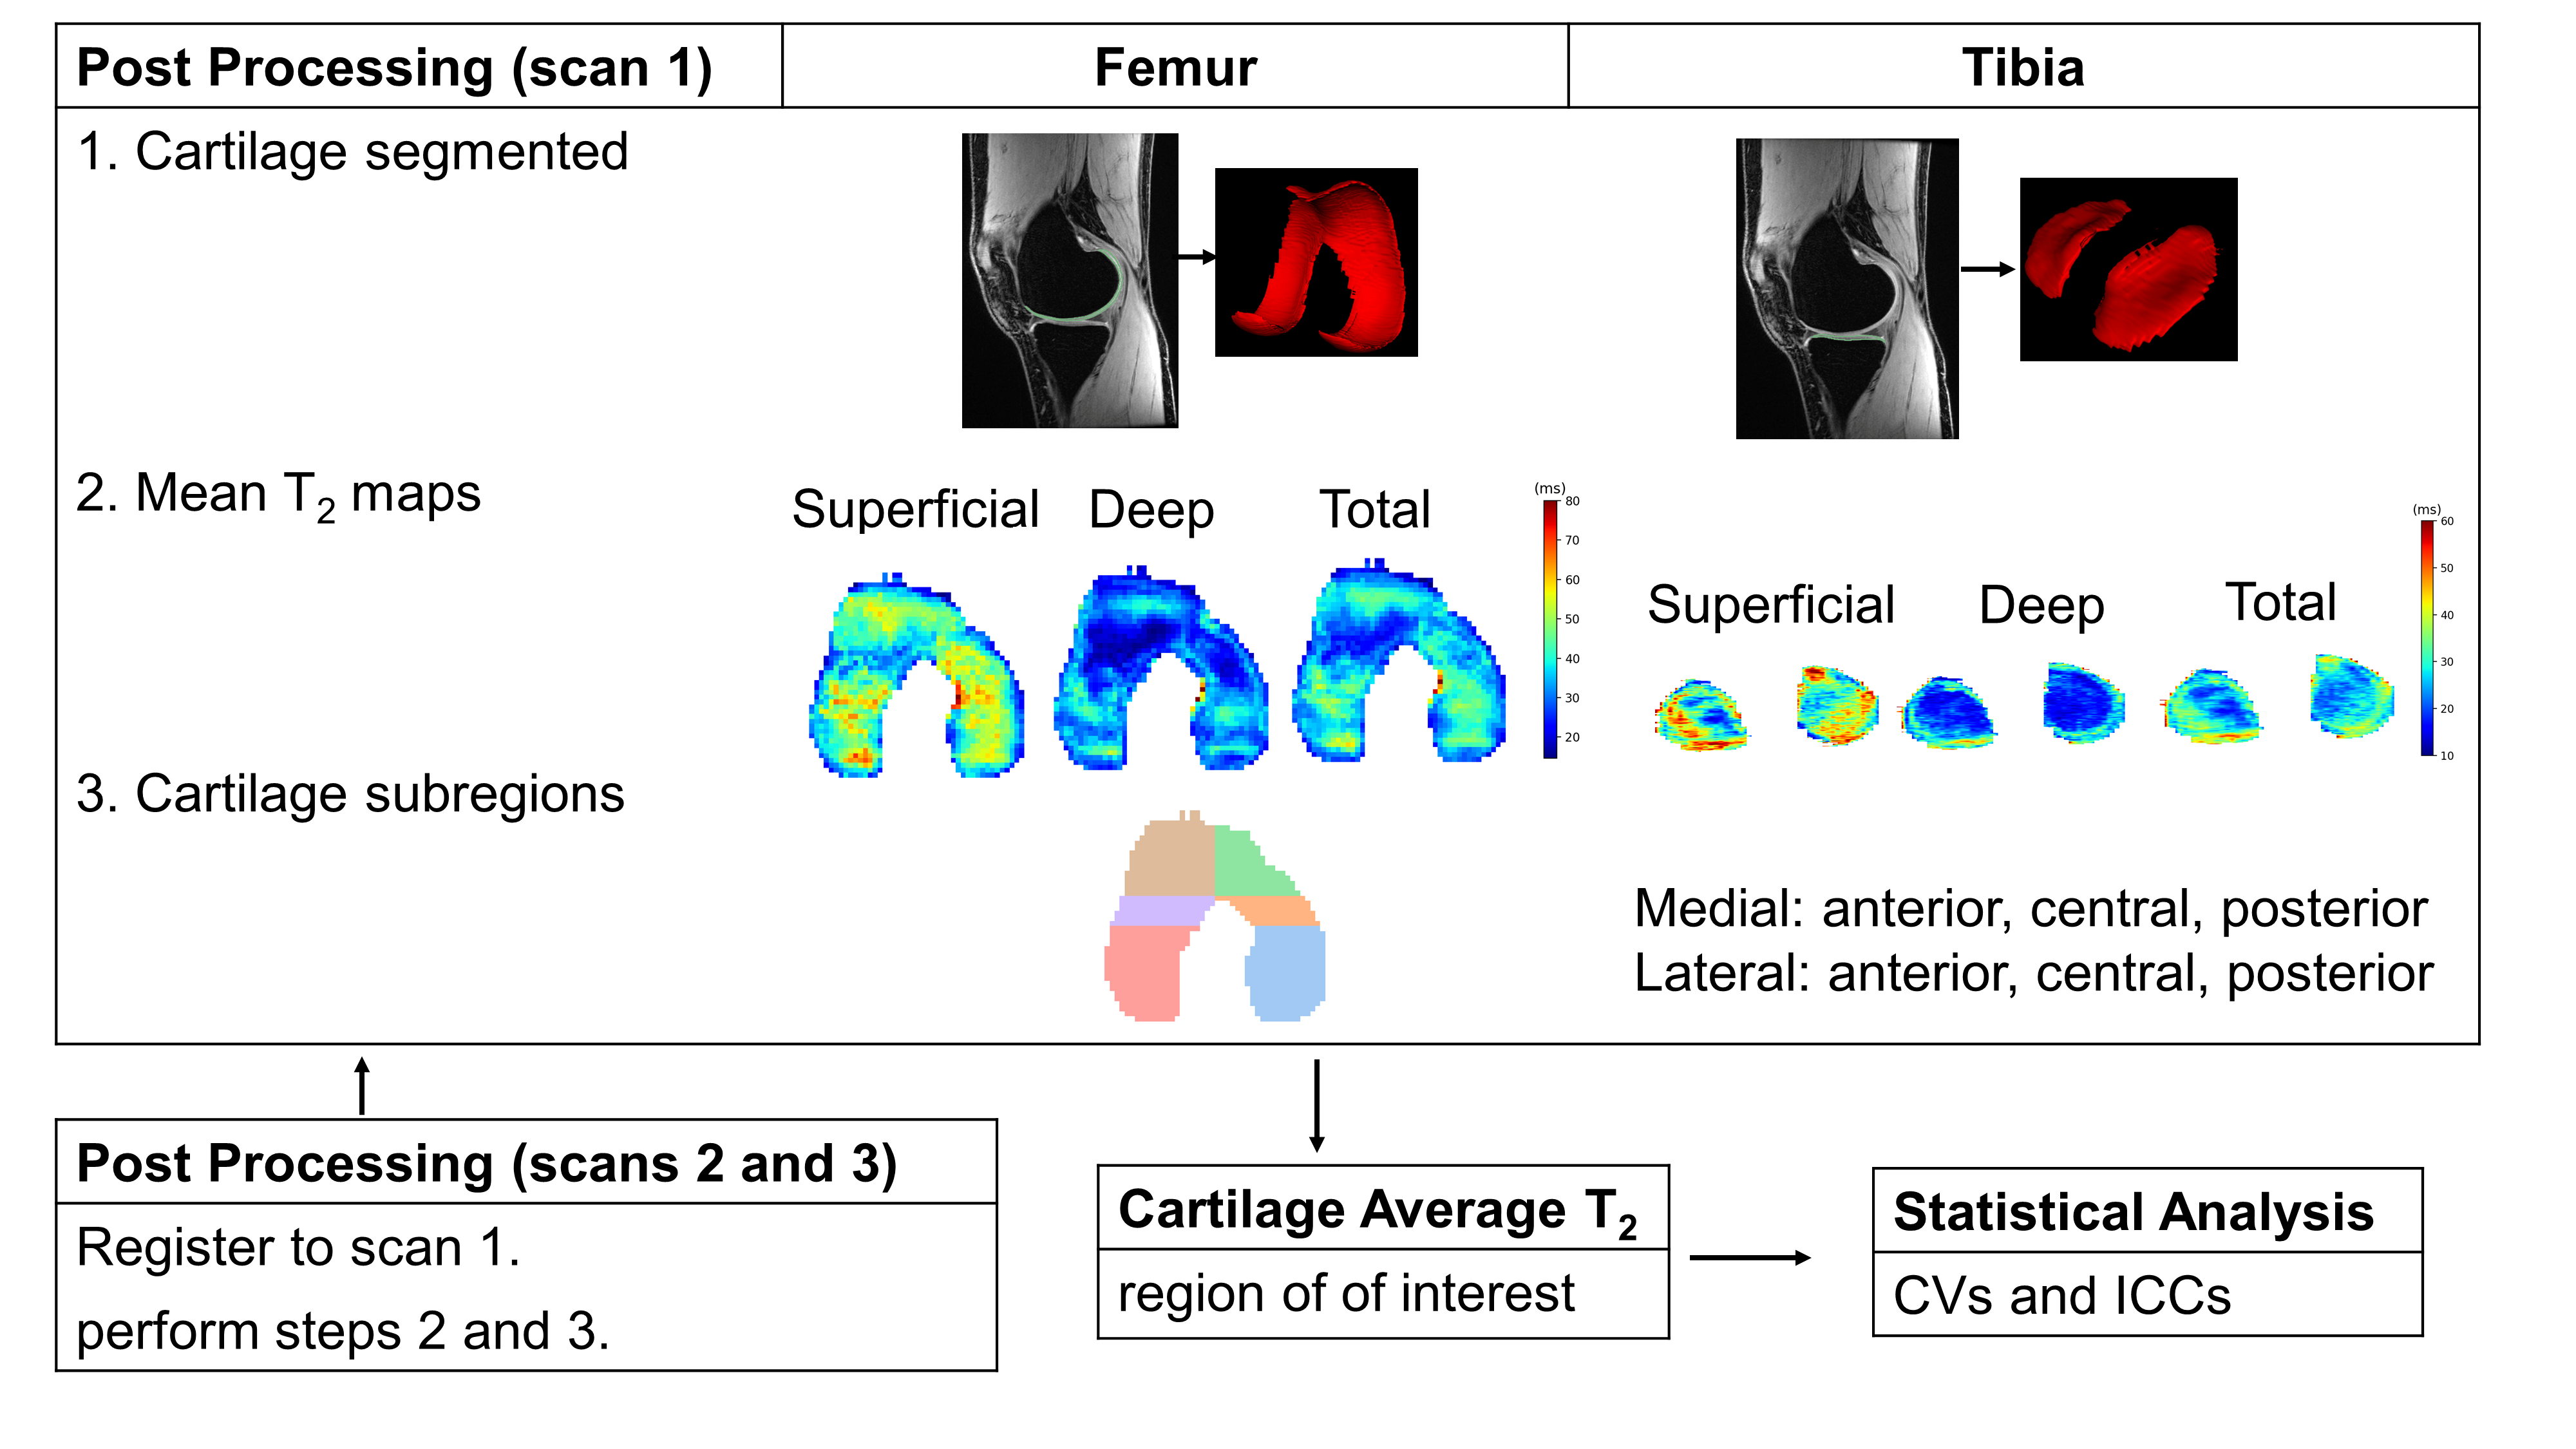
Nine healthy young adults (3 males, 28.8±4.7 yrs) without history of lower limb joint trauma were enrolled in this Institutional Review Board approved study. Unilateral MRI scans of their knees (6 left knees) were completed using a whole-body 3 Tesla MRI scanner (GE Healthcare, Waukesha, WI, USA) with a 16-channel flexible phased-array-receive-only coil (NeoCoil, Pewaukee, WI, USA) and a whole-body 7 Tesla MRI scanner (GE Healthcare, Waukesha, WI, USA) with a 28 Channel Transmit/Receive Knee Coil (Quality Electrodynamics, Cleveland, OH USA). In both scanners, qDESS sequences were used to acquire T2 relaxation times of the knee3 (scan parameters listed in Table 1).At each field strength, subjects were scanned 3 times and asked to walk around between scans. Cartilage T2 relaxation times were determined analytically using Extended Phase Graph (EPG) modeling of the relationship between the two qDESS echo signals3. The 3T scans were segmented using a convolutional neural network (CNN) trained specifically for the 3T qDESS sequence and scanners4. The 7T scans were segmented using a CNN trained on 3T scans from GE (fast spoiled gradient recalled), Siemens (Dual Echo in the Steady State) and Philips (WATSf)5. This second CNN was used because qualitatively it generalized better to the 7T images. All segmentations were manually checked, and five of the 7T scans required minimal correction. To keep segmentations consistent between repeated scans, one scan at each field strength per participant was segmented while the other two repeated scans were registered to it using Elastix6. Using the finalized segmentations, mean T2 was calculated separately for superficial, deep, and total thickness cartilage of six tibial and six femoral regions (anterior, central, and posterior of the medial and lateral compartments) (Figure 1).
Type 2,1 intraclass correlation coefficients (ICC) and the coefficient of variation as a percentage (CV) was calculated for every region of the tibia and femur at each magnet strength. Type 2,1 ICC, a relative measure of reliability, partitions measurement variances into factors of participant, rater, and random error while treating rater as a random sample from the pool of possible raters. CV was calculated as: (standard deviation of repeated measurements/mean of repeated measurements)*100. CVs and ICCs are presented as the average over all anatomical regions for superficial, deep, and total thickness T2. CVs ≤5% and ICCs ≥ 0.75 were considered to have excellent reliability, while CVs ≤ 10%7 and ICCs ≥ 0.708 were considered to have good reliability.
Results
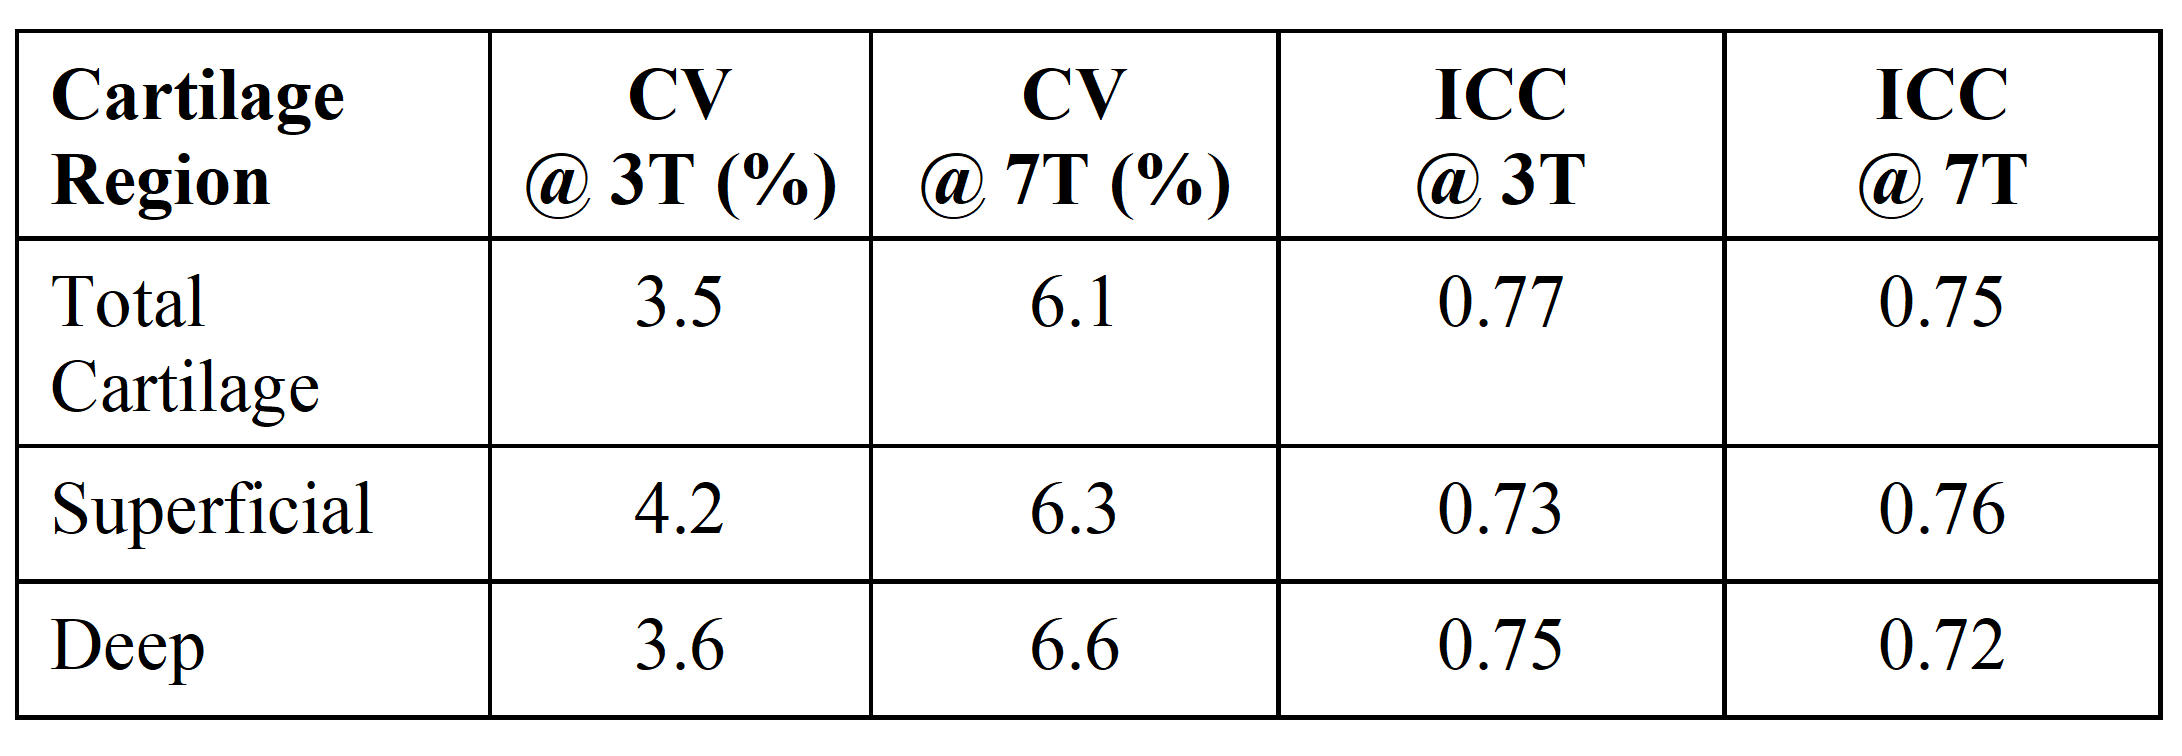
The T2 relaxation times at 3T and 7T (Table 2) depicted total cartilage average CVs means of ~3.5% and 6.1% for 3T and 7T, respectively. ICCs for total cartilage were excellent at 3T (0.77) and 7T (0.75). For superficial cartilage, average CVs were ~4.2% and 6.3% for 3T and 7T, respectively, which were comparable to the deep cartilage average CVs of ~3.6% and 6.6% for 3T and 7T, respectively. ICCs remained good (ICCs ≥ 0.70) for deep and superficial cartilage T2 relaxation times at both 3T and 7T.Discussion
For total cartilage, the CVs at 3T are aligned with those reported in prior literature7. Compared to 3T, there was an increase of CVs at 7T, which could be caused by more variable field inhomogeneity at increased field strengths. Correcting for B0 and B1 inhomogeneities could potentially improve the repeatability. Also, while it is assumed that SNR is increased for higher static magnetic field, the effects of coil choice on SNR were not evaluated. More comprehensive analysis of SNR can aid in optimizing scan parameters including resolution and scan time for each system. The CVs for our study were also reported over the whole cartilage, not just single slices7. However, at both field strengths, ICCs remained excellent8. Future work hopes to extend this reliability analysis to include T1ρ and T2* relaxation times and across multiple sites and different vendors.Conclusion
This work demonstrates that T2 relaxation times scans performed using qDESS sequences measured at 3T and 7T have good repeatability. Having reliable quantitative measures is important especially for longitudinal studies where small changes can be hard to otherwise detect. Knowledge of early cartilage changes can be key to potential early interventions.Acknowledgements
This work was supported by the National Institutes of Health (R01EB002524, R01AR077604) and GE Healthcare.References
1. Matzat, S.J., Kogan, F., Fong, G.W., and Gold, G.E. Imaging Strategies for Assessing Cartilage Composition in Osteoarthritis. Curr Rheumatol Rep. 2014. 16: 462.
2. Chaudhari AS, Stevens KJ, Sveinsson B, et al. Combined 5‐minute double‐echo in steady‐state with separated echoes and 2‐minute proton‐density‐weighted 2D FSE sequence for comprehensive whole‐joint knee MRI assessment. Magn Reson Imaging. 2019;49:e183-e194.
3. Sveinsson B, Chaudhari AS, Gold GE, Hargreaves BA. A simple analytic method for estimating T2 in the knee from DESS. Magn Reson Imaging. 2017;38:63–70.
4. Desai, A.D., Barbieri, M., Mazzoli, V., Rubin, E., et al. DOSMA: A deep-learning, open-source framework for musculoskeletal MRI analysis. Proc Intl Soc Mag Reson Med. 2019; 1106(27).
5. Gatti, A.A., Maly, M.R. Automatic knee cartilage and bone segmentation using multi-stage convolutional neural networks: data from the osteoarthritis initiative. Magn Reson Mater Phy. 2021; Published online.
6. Klein, S., Staring, M., Murphy, K., Viergever, M.A., Pluim, J. elastix: A Toolbox for Intensity-Based Medical Image Registration. IEEE Transactions on Medical Imaging 2010;29:196–205.
7. Chaudhari, A.K., Black, M.S., Eijgenraam, S., et al. Morphometry and T2 Relaxometryof Cartilage and Meniscus and for Semiquantitative Radiological Assessment Using Double-Echo in Steady-State at 3T. J Magn Reson Imaging. 2018;47:1328–1341.
8. Edd, S., Babel, H., Kerkour N., et al. Comprehensive description of T2 value spatial variations in non-osteoarthritic femoral cartilage using three-dimensional registration of morphological and relaxometry data. The Knee. 2019; 26:555-563.
Figures