2306
Characteristics of maturation-related differences in rabbit cartilage by quantitative µMRI and PLM
Yang Xia1, Hannah Mantebea1, Syeda Batool1, Amanveer Singh1, Mohammed Hammami1, and Farid Badar1
1Oakland Univ, Rochester Hills, MI, United States
1Oakland Univ, Rochester Hills, MI, United States
Synopsis
Immature and mature articular cartilage from the humeral joints of rabbits were studied quantitatively and at microscopic resolutions by µMRI and polarized light microscopy (PLM). µMRI data revealed a number of differences between the immature and mature cartilage, including total thickness and T2 relaxation values. PLM data revealed in addition the cellular differences between the tissues. The mature cartilage has a clearly defined tidemark, which was absent in the immature tissue. The ability to differentiate specific maturation-related characteristics in cartilage could benefit translational studies of degenerative diseases such as osteoarthritis.
Introduction
Rabbits have been used in preclinical studies as the model of osteoarthritis 1. Since the biomechanical properties of cartilage are maintained mostly by its extracellular matrix, it is important to understand the structural characteristics of cartilage during different stages of its growth and development. In preclinical studies involving articular cartilage, microscopic magnetic resonance imaging (µMRI) has been extensively used, in particular, the use of T2 quantification to measures the phase coherence among nuclear spins in the transverse plane 2. In addition, the use of polarized light microscopy (PLM) can quantify tissue’s optical characteristics 3.Methods
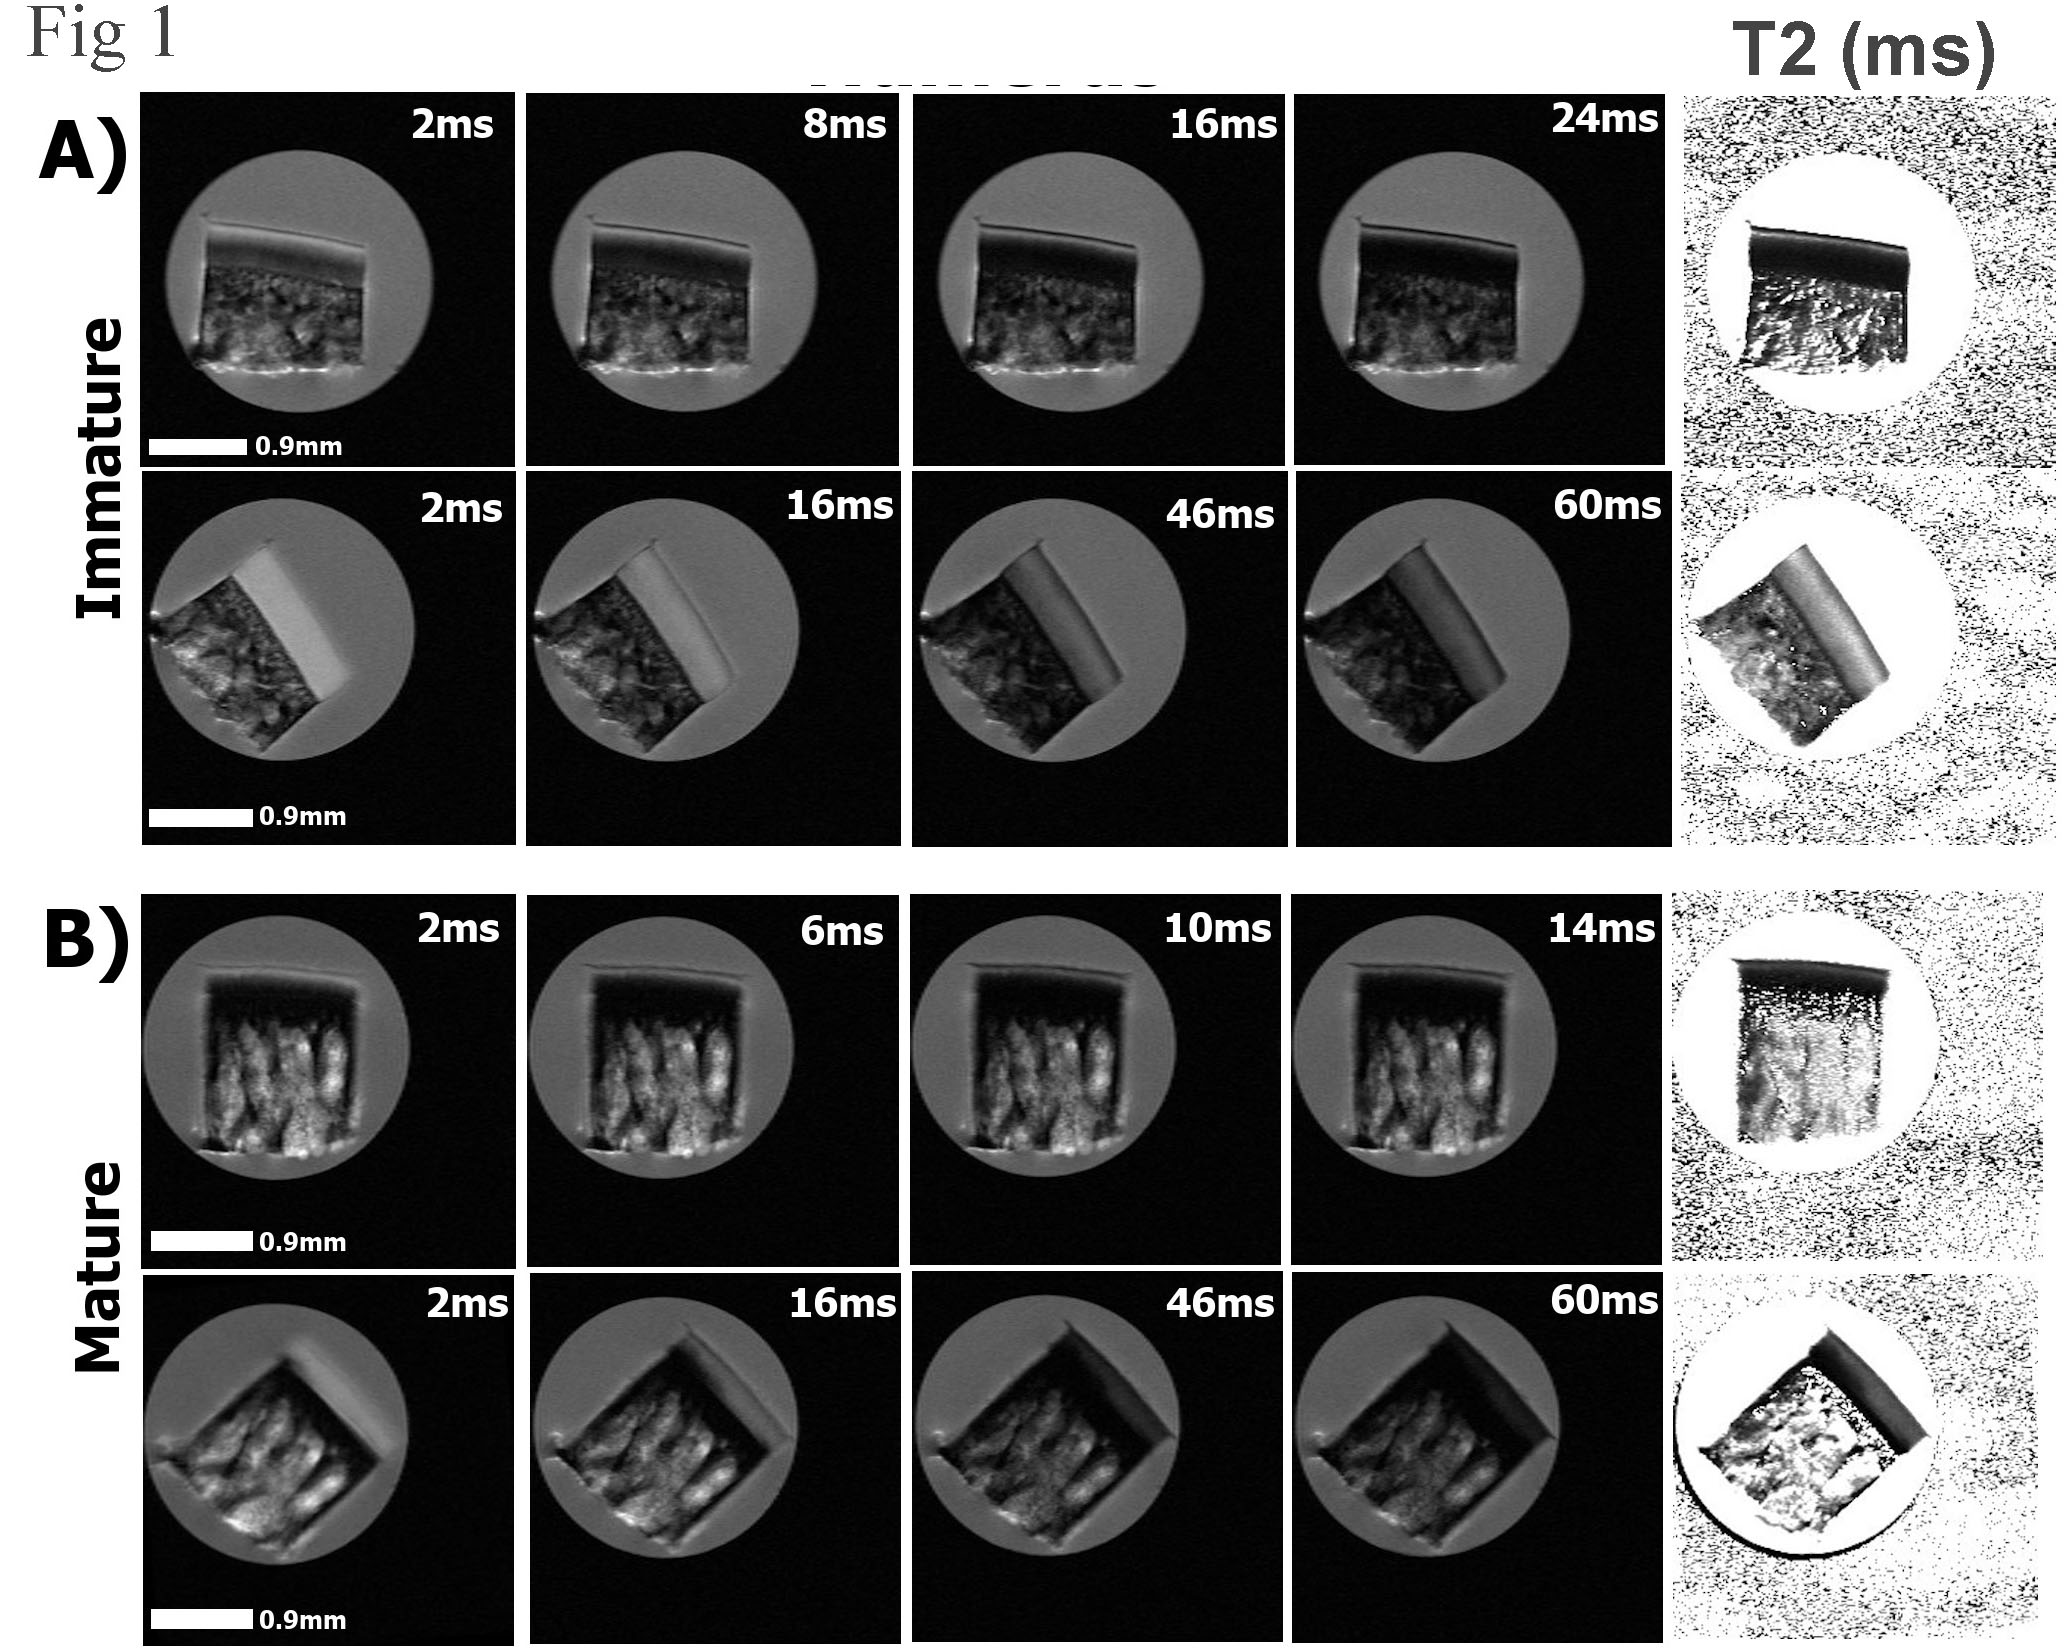
Six NZW rabbits were used in this study - three immature (3-4 months) and three mature (12-18 months). The animals were sacrificed for an unrelated biomedical study, where the uses of animals were approved by the relevant institutional review committees. One cartilage-bone specimen was harvested from each humeral head, approximately 3×2×2 mm3. All specimens were imaged individually in a Bruker 7T micro-imager, with the normal axis of the specimen set at 0˚ and 55˚ with respect to B0. A magnetization-prepared imaging protocol was used, where TE in 2D mapping was kept constant at 7.19 ms, and the T2 weightings were listed in Fig 1. The slice thickness was 0.8 mm and TR was 1800 ms. The pixel resolution was 13.2 µm. All specimens after µMRI were treated with the paraffin method for histology, where three 6µm thick sections were made from each specimen at the location of the µMRI slices. All sections were imaged using a digital PLM system, which produced quantitative 2D images with a pixel resolution of 1 µm (10x objective) and 0.25 µm (40x objective) respectively.Results
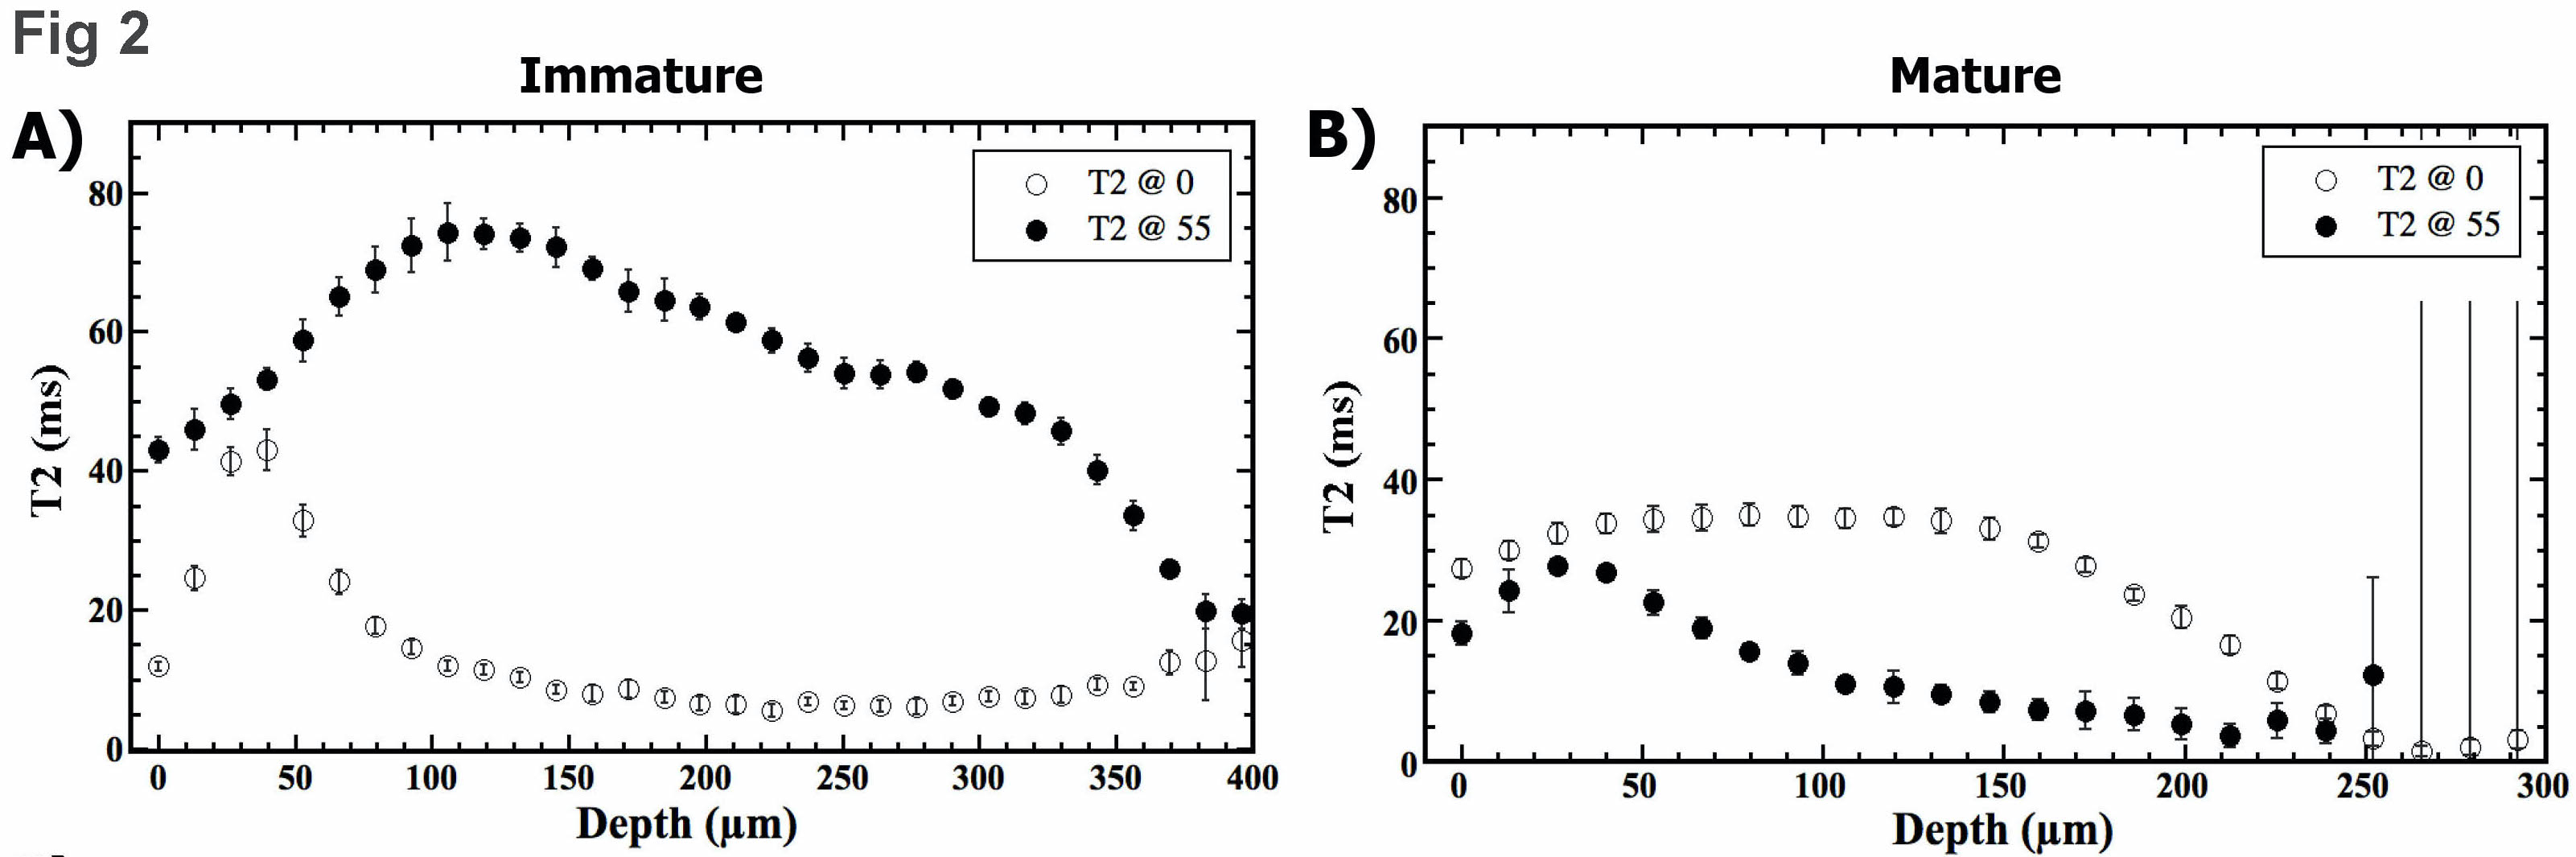
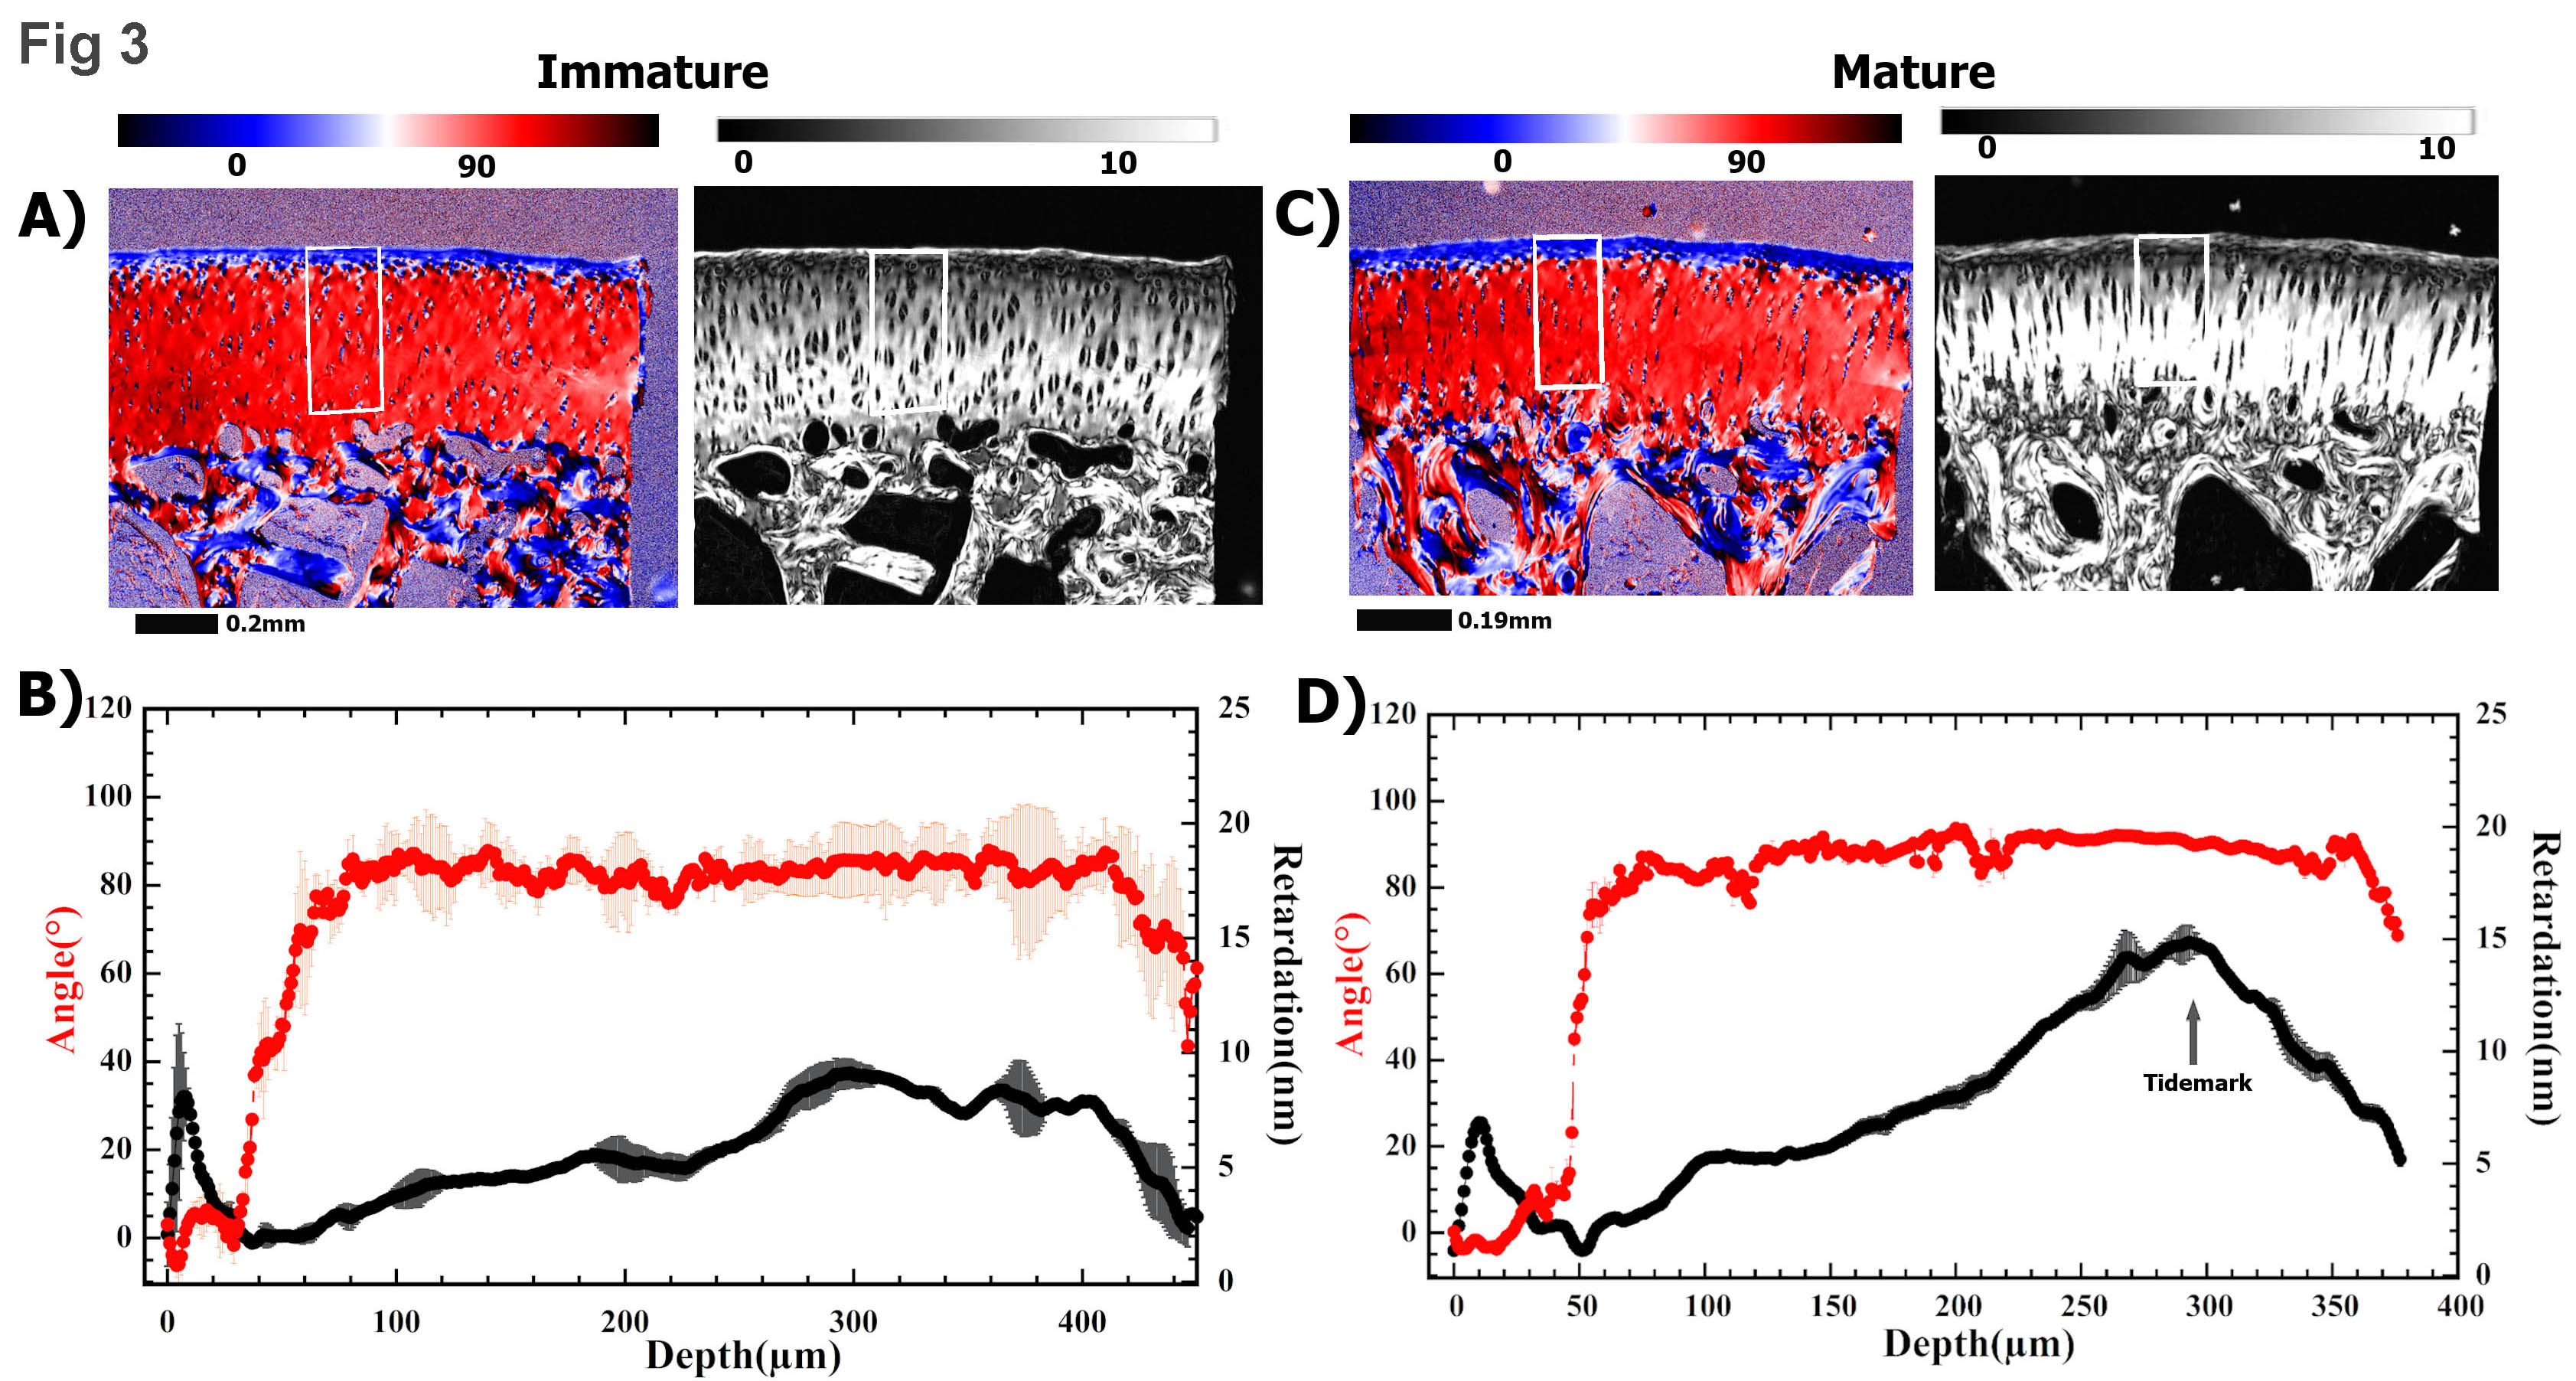
Fig 1 summarizes the µMRI results, where the laminar appearance of cartilage can be seen in all samples when their orientations are at 0˚ with respect to B0. For immature cartilage at 0˚, cartilage and bone are visible. For mature cartilage at 0˚, however, it is difficult to distinguish cartilage from bone, even at the shortest TE (2ms). When the tissue is oriented at 55˚ to B0 (i.e., the magic angle), all cartilage samples appear homogenous as a result of the minimization of the dipolar interaction. Fig 2 shows the depth-dependent relaxation profiles of the cartilage. Several features of these profiles can be noted. First, the mature cartilage is about 25% thinner than the immature cartilage. Second, the mature cartilage has lower T2 values than the immature cartilage. Third, T2 profiles of both mature and immature cartilage have a similar magic angle effect, which has a peak at about 50µm below the articular surface when the specimens were oriented at 0˚ with respect to B0. Fig 3 shows the 2D angle and retardation images and their depth-dependent profiles. One can see that both immature and mature cartilage have a well-recognized fibril transition of ~90˚ between the surface fibers and the deep fibers. The retardation images/profiles of the mature cartilage in rabbits have features that are consistent with the mature tissue from canines, which has the lowest dip at 50µm below the articular surface, representing the middle of the transitional zone; at the same time, the peak at the deep tissue, about 300µm in depth, represents the tidemark that separates the uncalcified cartilage from the rest of the deep tissue that interfaces with the subchondral bone. In comparison, the retardation profile of the immature cartilage has an ill-defined dip in the transitional zone and no clear tidemark in the deep tissue. The established tissue-sub-division criteria 4 were used to determine the zonal thicknesses in both µMRI and PLM, and the zonal averaged values of T2 relaxation. The superficial zones and transitional zones of the immature cartilage show a slight increase in thickness as compared to mature cartilage. A significant increase in the relative thickness of the radial zone in immature cartilage was noted (about an average of 27% increment).Discussion
The high-resolution imaging modalities used in this study allows us to determine the structure of cartilage through their cells and the ECM components. The MRI images from the mature cartilage appeared darker in intensity than the immature tissue, even at the shortest echo time of 2ms, which indicates the short T2 values in the tissue. The retardation of the mature cartilage in PLM is about 50% higher than the immature cartilage. Since the retardation values in PLM are proportional to the fibril content (concentration, packing density, etc) in cartilage, our µMRI and PLM data collectively demonstrated that the mature cartilage has higher fibril contents and better organized fibril structure than the immature cartilage.Conclusion
The immature and mature cartilages have significant structural differences, which can be measured in imaging in terms of their T2 relaxation times, thickness, cellular and physical appearances. For studies and models involving MRI, any pulse sequence with shorter echo delays (e.g. UTE, or ultra-short-echo) could be more beneficial if the cartilage bone interface is of concern. Better knowledge on the characteristic differences between immature and mature cartilage could lead to an improved understanding of developmental biology and special needs in translational research that involves rabbit model.Acknowledgements
Yang Xia is grateful to the National Institutes of Health (NIH) for a R01 grant (AR 69047). The authors thank Dr. Adam Lauver and Ms Barbara Christian (Department of Pharmacology & Toxicology, Michigan State University) for providing the immature rabbit samples.References
1. Williams GM, Klisch SM, Sah RL. Bioengineering cartilage growth, maturation, and form. Pediatric Research. 2008; 63(5): 527–534. 2. Xia Y. Relaxation Anisotropy in Cartilage by NMR Microscopy (µMRI) at 14-pm Resolution. Magn Reson Med. 1998; 39(6): 941-949. 3. Xia Y, Moody J, Burton-Wurster N, Lust G. Quantitative in situ correlation between microscopic MRI and polarized light microscopy studies of articular cartilage. Osteoarthritis and Cartilage. 2001; 9(5), 393–406. 4. Lee JH and Xia Y. Quantitative zonal differentiation of articular cartilage by microscopic magnetic resonance imaging, polarized light microscopy, and Fourier-transform infrared imaging. Microscopy Research and Technique. 2013; 76(6), 625–632.Figures
Figure
1
MRI
images of immature (a) and mature (b) cartilage blocks at 0˚ and 55˚
orientations to B0, which points vertically up. The first four
columns are the T2 weighted intensity images, while the last column is the
calculated T2 images. All relevant images are plotted on the same grey scale.
Figure
2
T2 depth-dependent
profiles of immature and mature cartilage at 0˚ and 55˚ orientations to B0,
respectively.
Fig
3
2D
angle and retardation images (a, c) of immature and mature cartilage and their
depth dependent profiles (b, d). The rectangular boxes on 2D images indicate
where the region of interest (ROI) was taken for the profile analysis.
DOI: https://doi.org/10.58530/2022/2306