2305
3-D T1 relaxation time measurements in an equine model of mild post-traumatic osteoarthritis using MB-SWIFT1Department of Applied Physics, University of Eastern Finland, Kuopio, Finland, 2Research Unit of Medical Imaging, Physics and Technology, University of Oulu, Oulu, Finland, 3Department of Clinical Sciences, Faculty of Veterinary Medicine, Utrecht University, Utrecht, Netherlands, 4Science Service Center, University Hospital, Kuopio, Finland, 5School of Information Technology and Electrical Engineering, The University Queensland, Brisbane, Australia
Synopsis
In this study, we examined the variation in T1 relaxation times in a mild OA model of surgically grooved (sharp and blunt) articular cartilage of equine carpal joints. The study revealed that T1 relaxation time is significantly increased in bluntly-grooved cartilage with respect to control cartilage. No significant differences between sharply-grooved and control groups were seen for T1 relaxation. Moreover, strong variations in T1 relaxation times and proteoglycan (PG) contents were observed in the superficial half of the cartilage. T1 relaxation times correlated weakly (R≈0.33) with equilibrium mechanical modulus and with PG content (R≈0.23).
Introduction
Quantitative MRI (qMRI), more specifically T1 relaxation time without contrast agent, has shown promise in the detection of tissue damage in articular cartilage [1-2] in animal models of post-traumatic osteoarthritis [3]. Following these studies, we explored degenerative changes due to surgically induced grooves in the cartilage of equine carpal joints ex vivo. The aim of the study was to investigate whether the damage in cartilage caused by the grooves, could be detected with 3-D T1 relaxation time measured using variable flip angle multiband-SWIFT (VFA-MB-SWIFT)-sequence [4]. As references, the proteoglycan content and biomechanical properties of the samples were measured.Materials and Methods
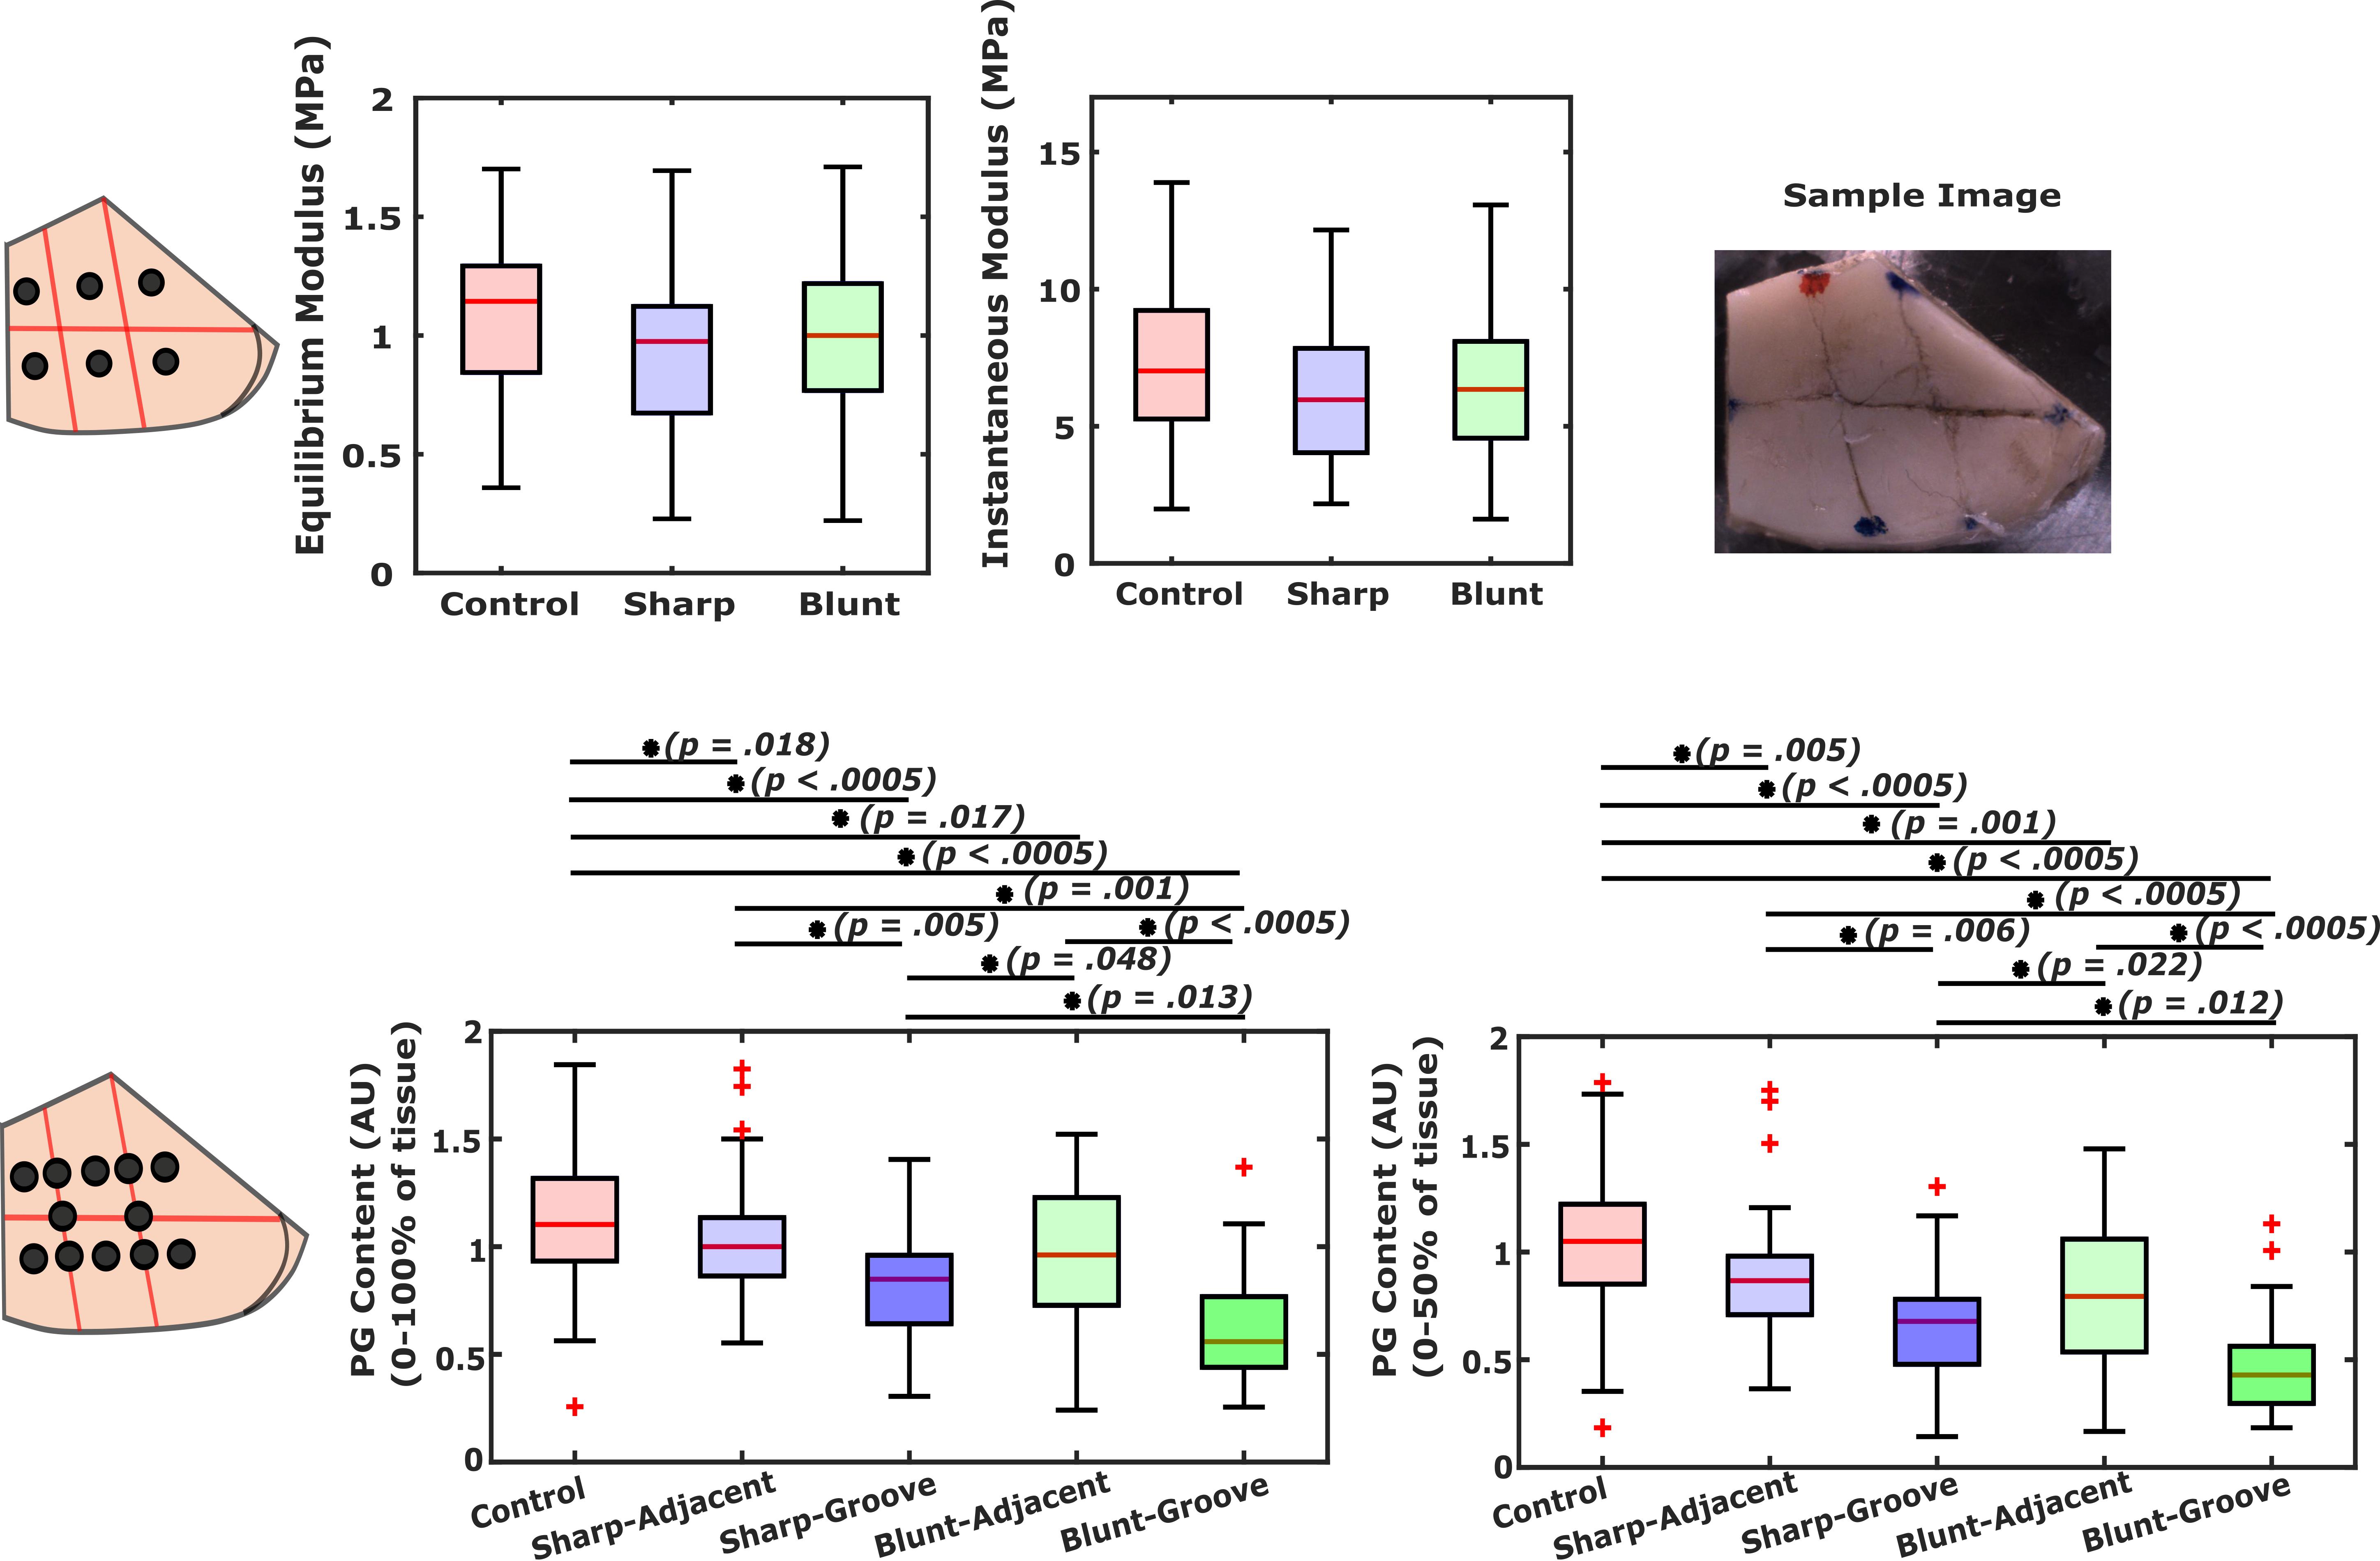
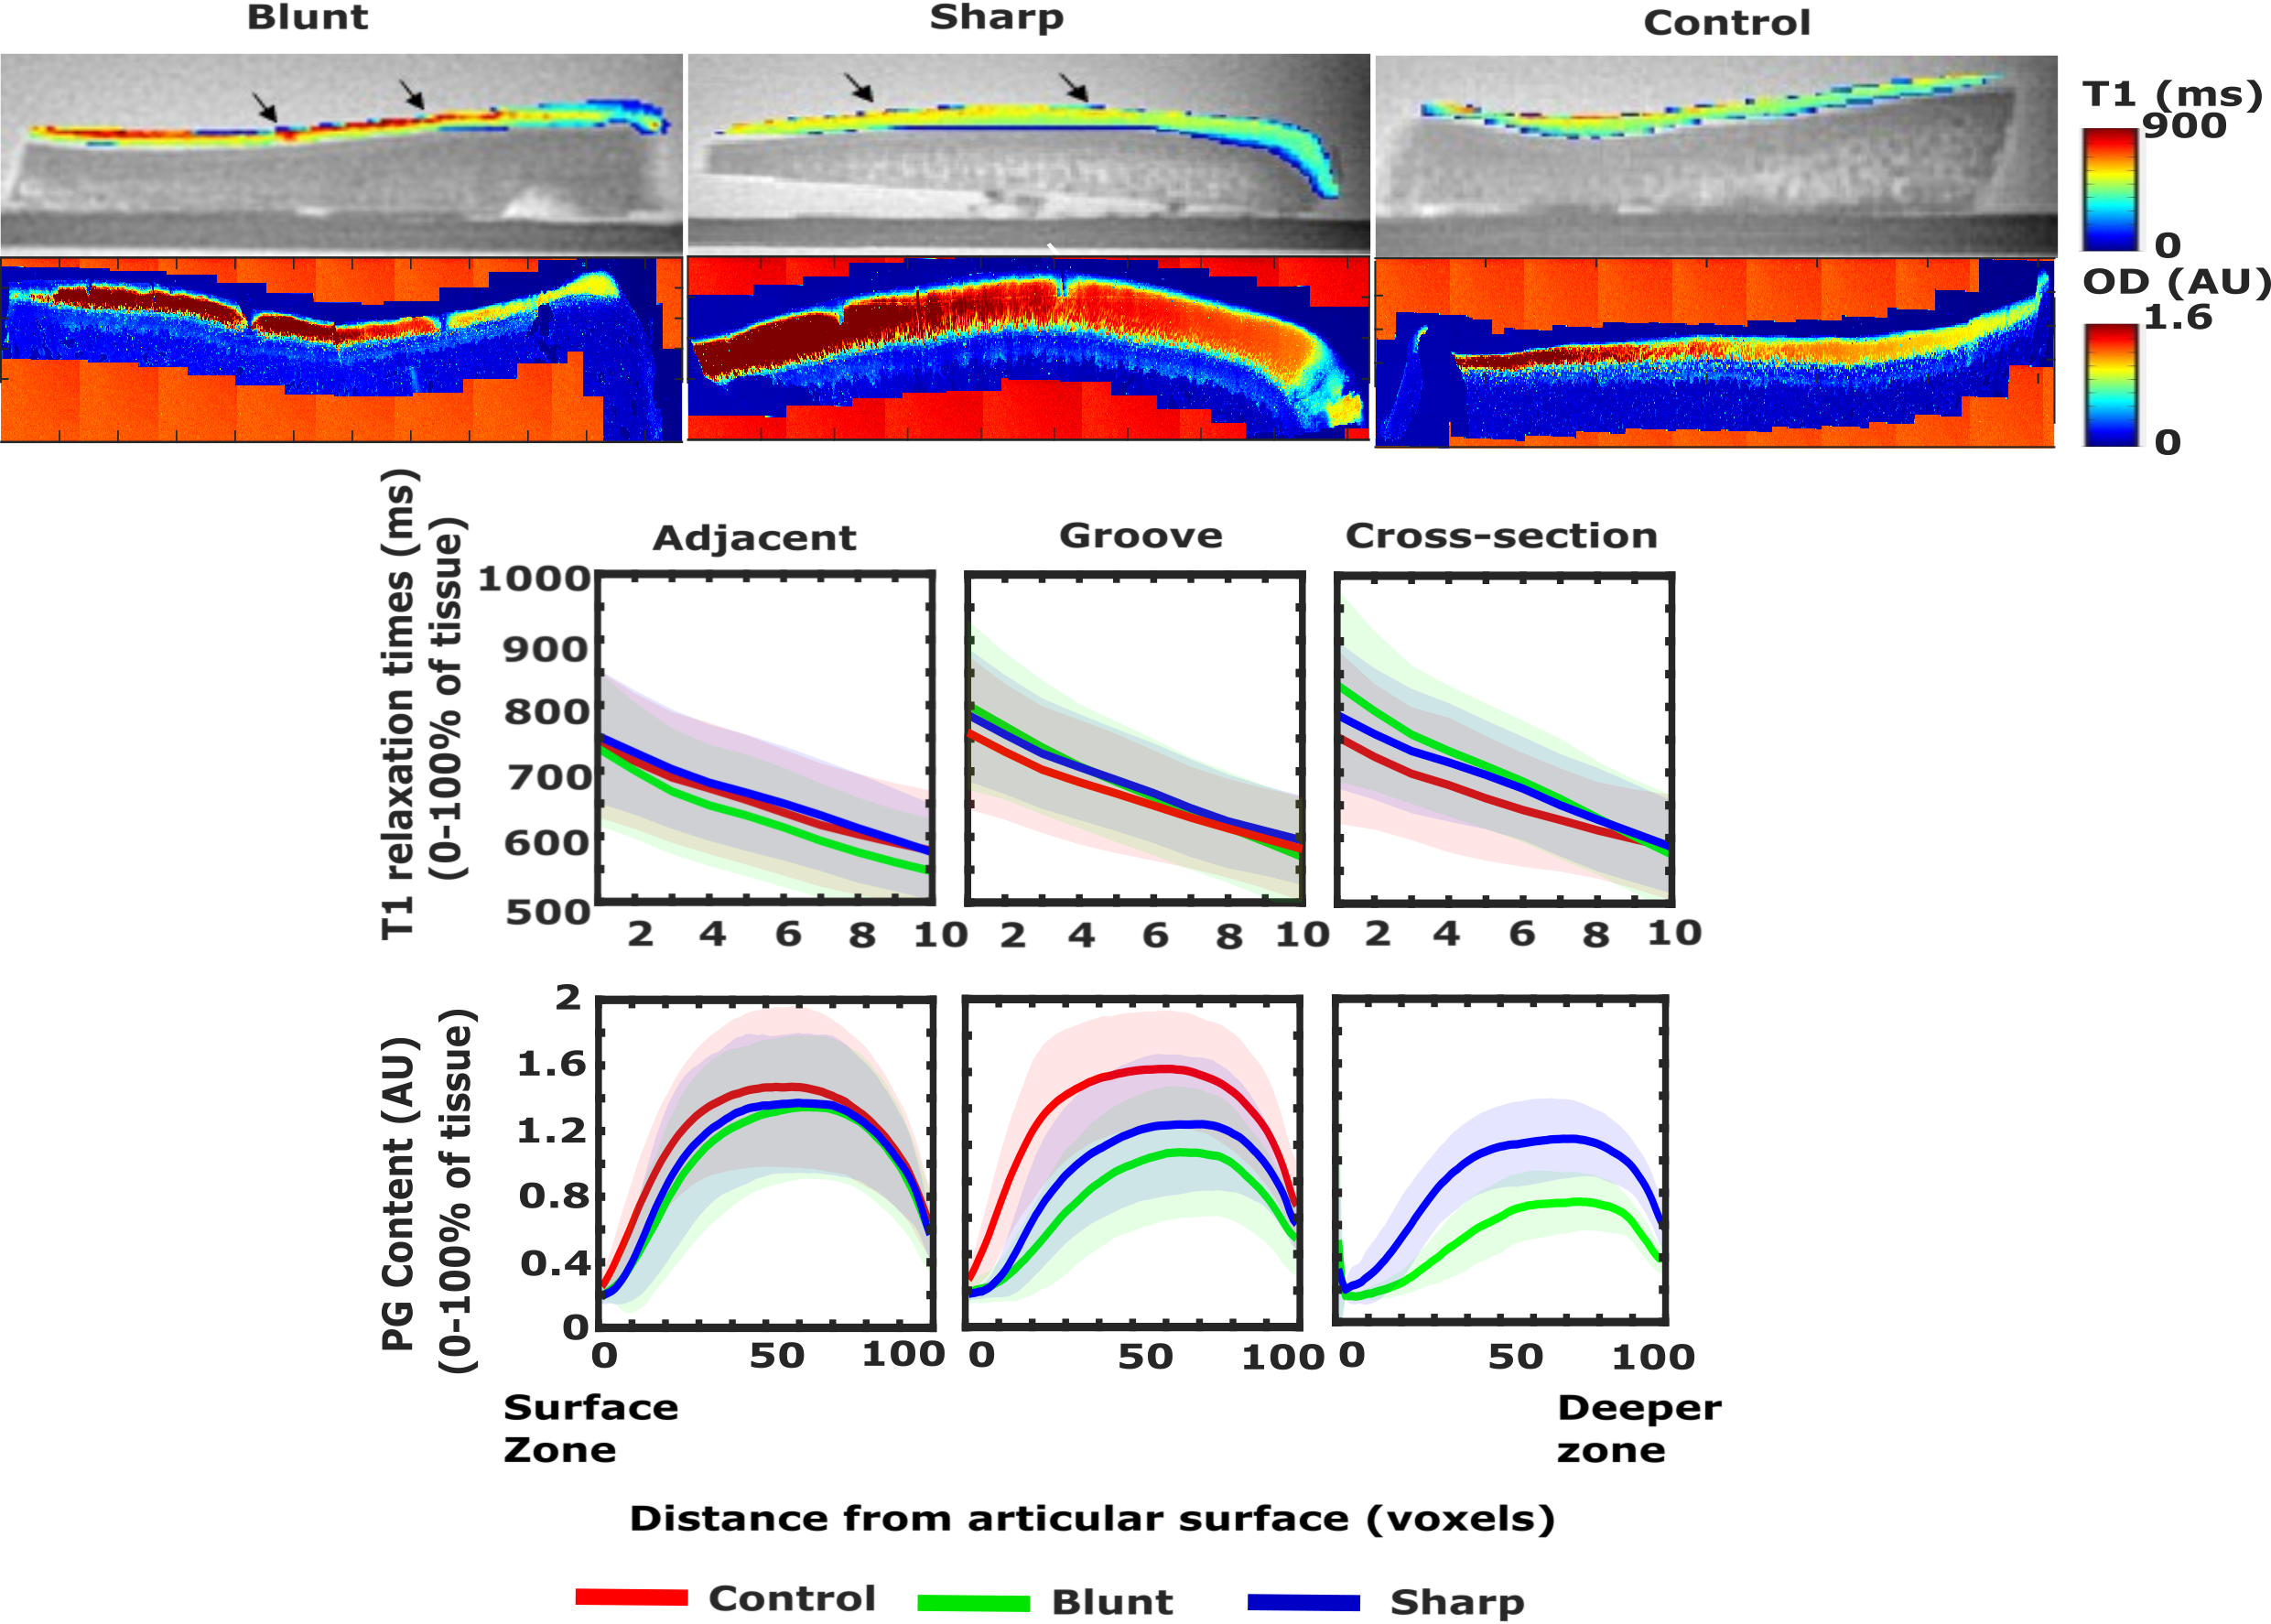
In 9 healthy adult female Shetland ponies (aged 4-13 years) [5], either blunt or sharp grooves were surgically induced at two different anatomical locations: the radial facet of the third carpal bone (midcarpal joint) and the intermediate carpal bone (radiocarpal joint). The same anatomical locations of the contralateral joints served as controls. The surgical procedure was performed under relevant ethical permissions [5]. The ponies were euthanized at week 39 after the surgical intervention, and osteochondral samples (n=8 blunt, n=8 sharp, and n=12 controls) were obtained. Prior to the MRI, equilibrium and instantaneous Young’s moduli were measured at six locations (Fig. 1) between the grooves, using a indentation testing [5]. Proteoglycan content was measured as optical density (OD), obtained from digital densitometry of Safranin-O-Fast-Green-stained histological sections after the MRI at the same locations.MRI experiments were carried out on two separate 9.4 Tesla pre-clinical Varian/Agilent scanners (Vnmrj DirectDrive console v. 3.10) using the same 19 mm quadrature RF volume transceiver on both scanners (Rapid Biomedical GmbH, Rimpar, Germany). T1 relaxation times were measured with VFA-MB-SWIFT-sequence, using 11 flip-angles spanning 1° to 20°, bandwidth (385 kHz), TR (2.97 ms), FOV (3 cm), and 32 dummy projections before spatial encoding. Individual contrast-weighted images (256^3 voxels) were reconstructed using a gridding algorithm, and the T1 maps were calculated by nonlinear Gauss-Newton fitting with in-house built MATLAB algorithm. Depth-wise profiles of T1 relaxation times were calculated in 12 volumes-of-interest (VOIs) (width≈4 voxels) in all samples and the length of the profiles was normalized to 10 points.
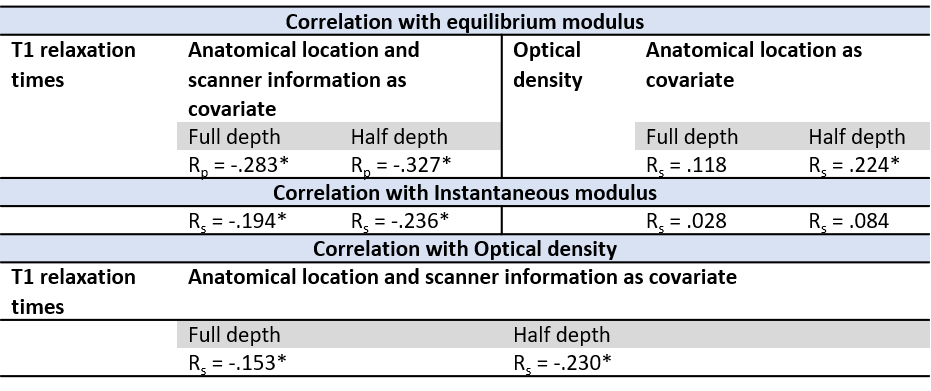
The statistical analyses were carried out using a linear mixed-effects (LME) model for T1, OD (both with full-thickness and superficial 50%), and equilibrium and instantaneous Young’s moduli. In this model, ponies were selected as subject for random effects, accounting for additional covariance caused by taking observations from multiple locations within the same animal. The type of the cartilage surface (control tissue as well as tissue at the grooves and adjacent to the grooves for both groove types) were set as fixed variables, and the scanner information (for T1) and anatomical location of the groove (radiocarpal or midcarpal joint) were considered as covariates. Partial correlation analysis was performed to evaluate the relationship between OD values, T1 relaxation times and biomechanical properties, accounting for the different magnets and the different joint surfaces. All statistical analyses were carried out using IBM SPSS Statistics (v. 27 SPSS Inc., IBM Company).
Results
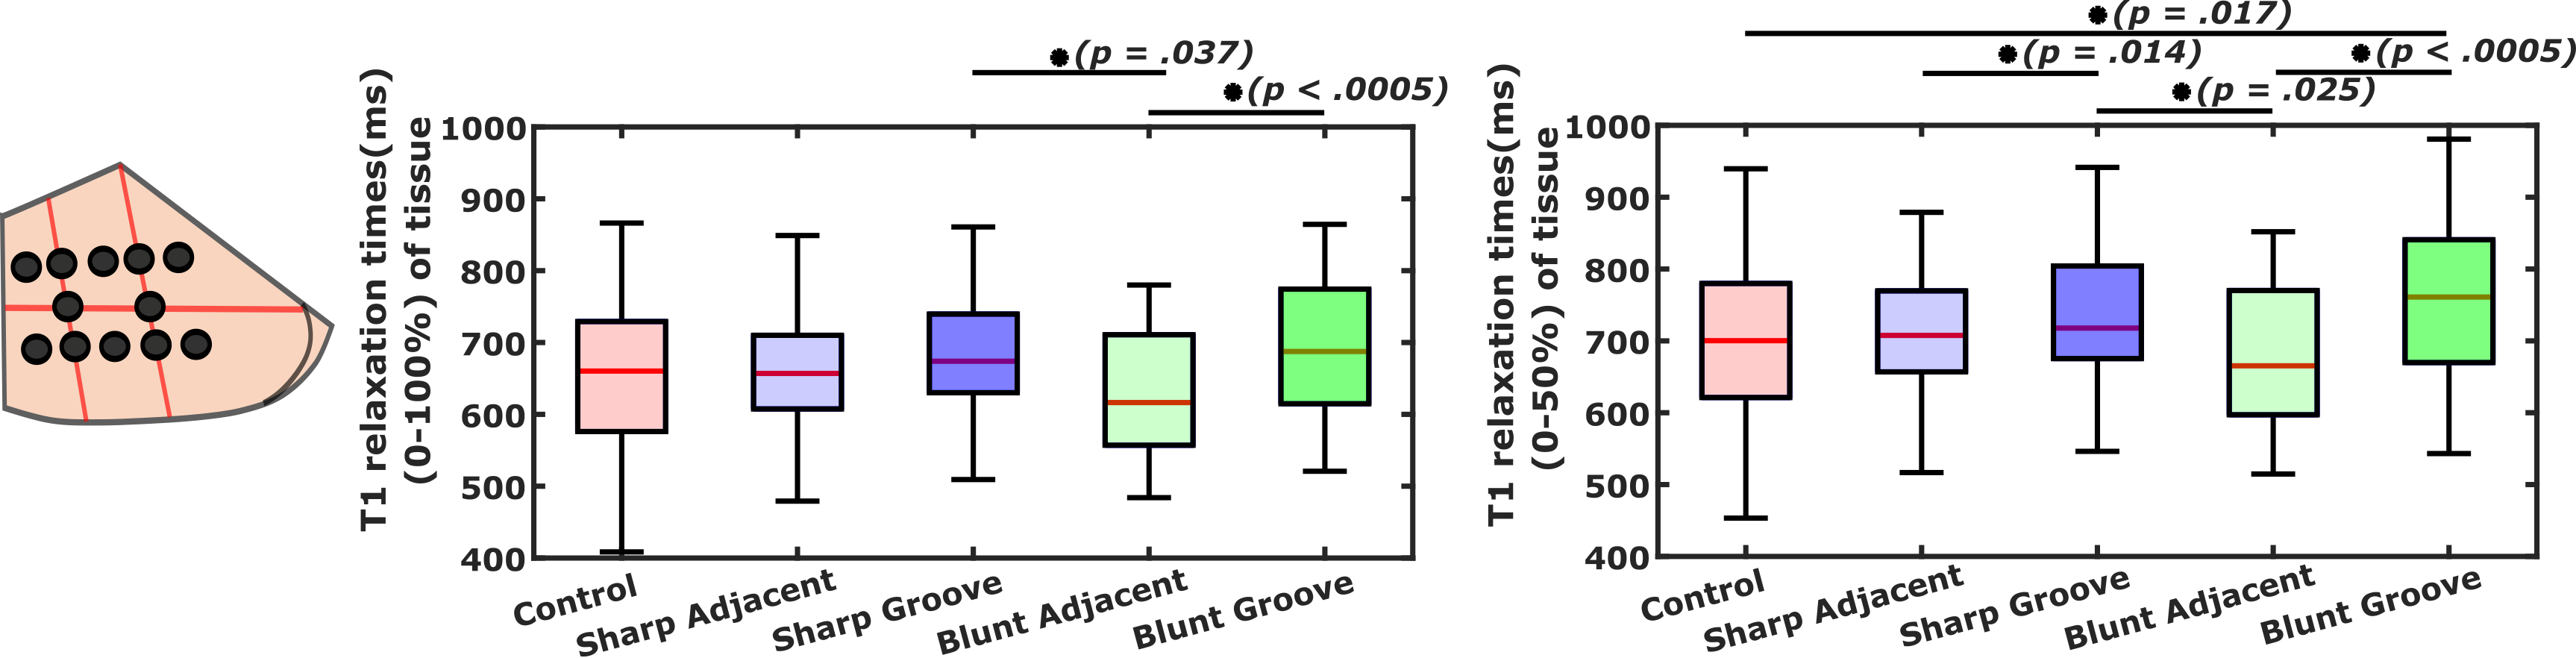
While no significant differences (p>0.05) were observed in biomechanical properties, lowest mean values of the equilibrium and instantaneous moduli were noted at the locations adjacent to the lesions in the grooved joints (Fig. 1). Proteoglycan content measured as OD exhibited more significant differences (p<0.05) between the control and grooved groups (Figs. 1 & 2). T1 relaxation times were visually elevated in the superficial cartilage for both blunt and sharp grooves (Fig. 2). The elevation of superficial T1 relaxation time was statistically significant in both grooved groups, at the grooved regions compared to the adjacent tissue. In the blunt grooves, superficial T1 relaxation times were also significantly elevated when compared to the control group (Fig. 3). However, the full-thickness T1 relaxation time values from both groove types overlapped with the values of the control samples (Fig. 3). The correlations between the T1, OD and equilibrium modulus were significant, but weak (Table. 1).Discussion and Conclusion
The results indicated that T1 relaxation time in the superficial articular cartilage is sensitive to blunt groove defects. Sharp grooves, on the other hand, did not induce noticeable changes in the relaxation time with respect to controls, suggesting that the induced changes might not lead to damage that could be revealed by VFA-based T1 relaxation time measurement, at least not at the 39-week time-point after the induction. However, superficial T1 relaxation time was elevated in the sharp grooves when compared to the tissue adjacent to these grooves, indicating at least minor sensitivity towards sharp grooves. Full thickness T1 relaxation time displayed less differences between tissue types, which is to be expected, given the damage was inducted by superficial grooving. In conclusion, the changes induced by the surgical model were modest, as evidenced by the reference findings. Nevertheless, the superficial T1 relaxation times evaluated in small VOIs, at the grooved regions showed significant differences in bluntly-grooved with respect to healthy cartilage. Together with the previous reports [3], the findings promote 3-D T1 mapping as a feasible method to assess the status of articular cartilage.Acknowledgements
This study was made possible by the Academy of Finland projects (#285909, #319440, #325146, #325022, #337550), Finnish Cultural Foundation (#00180787), an NWO Graduate Programme Grant (022.005.018), and support from Dutch Arthritis Association grant LLP‐22. Funding sources had no role in the design of the study, analysis, and interpretation of the results, or writing and submission of the abstract.References
[1] J. Rautiainen et al., “Multiparametric MRI assessment of human articular cartilage degeneration: Correlation with quantitative histology and mechanical properties,” Magn. Reson. Med., vol. 74, no. 1, pp. 249–259, 2015, doi: 10.1002/mrm.25401.
[2] M. J. Nissi et al., “Multi-parametric MRI characterization of enzymatically degraded articular cartilage,” J. Orthop. Res., vol. 34, no. 7, pp. 1111–1120, 2016, doi: 10.1002/jor.23127.
[3] A. W. Kajabi et al., “Evaluation of articular cartilage with quantitative MRI in an equine model of post-traumatic osteoarthritis,” J. Orthop. Res., vol. 39, no. 1, pp. 63–73, 2021, doi: 10.1002/jor.24780.
[4] D. Idiyatullin, C. A. Corum, and M. Garwood, “Multi-Band-SWIFT,” J. Magn. Reson., vol. 251, no. 1, pp. 19–25, 2015, doi: 10.1016/j.jmr.2014.11.014.
[5] N. C. R. te Moller et al., “Structural, compositional, and functional effects of blunt and sharp cartilage damage on the joint: A 9-month equine groove model study,” J. Orthop. Res., no. September 2020, pp. 1–13, 2020, doi: 10.1002/jor.24971.
Figures