2304
Improved accuracy and precision in 3D T2 mapping of knee cartilage with dictionary fitting and patch-based denoising1Department of Radiology, Lausanne University Hospital (CHUV) and University of Lausanne (UNIL), Lausanne, Switzerland, 2Department of Cardiovascular Imaging, Hôpital Cardiologique du Haut-Lévêque, CHU de Bordeaux, Bordeaux, France, 3IHU LIRYC Electrophysiology and Heart Modeling Institute, Université de Bordeaux, Bordeaux, France, 4CIBM Center for BioMedical Imaging, Lausanne, Switzerland, 5In Vivo Imaging Facility (IVIF), Department of Research and Training, Lausanne University Hospital (CHUV) and University of Lausanne (UNIL), Lausanne, Switzerland, 6Department of Diagnostic, Interventional and Pediatric Radiology (DIPR), Inselspital, Bern University Hospital, University of Bern, Bern, Switzerland, 7Translational Imaging Center, Sitem-Insel, Bern, Switzerland, 8Department of Musculoskeletal Medicine, Lausanne University Hospital (CHUV) and University of Lausanne (UNIL), Lausanne, Switzerland
Synopsis
We implemented and compared three different reconstructions for 3D T2 mapping of the knee: I) a standard image reconstruction followed by an analytical fit, II) a standard image reconstruction followed by a dictionary fit, and III) a denoised image reconstruction followed by a dictionary fit. We optimized and compared these techniques in phantoms, five healthy volunteers, and five patients with mild osteoarthritis. The third reconstruction resulted in the highest accuracy and precision while retaining the spatial resolution, and allowed the load-bearing cartilage in the mild-OA patients to be differentiated from that in the healthy volunteers.
Introduction
Osteoarthritis (OA) of the knee is a degenerative joint disease with a large socio-economic impact, so non-invasive methods for the detailed and early diagnosis of OA are highly needed1. Since the T2 relaxation time is highly sensitive to changes from healthy to degraded cartilage, it is an ideal candidate for the diagnosis of early-onset OA2. Furthermore, when isotropic 3D T2 mapping3,4 is used, the maps can be reformatted to any desired angle while maintaining the same spatial resolution. This isotropic high spatial resolution is however achieved at the cost of a relatively poor precision as well as moderate accuracy4. The aim of this study was therefore to remove several of these drawbacks by developing a technique 1) with improved mapping precision by using the HD-PROST patch-based denoising (PBD) algorithm5 and 2) with improved accuracy by performing the T2 mapping with dictionary matching6. We calibrated and validated techniques with these improvements in phantom studies, and compared them to one another in both healthy volunteers and patients with mild knee OA.Material and Methods
Data were acquired on a 3T clinical system (Magnetom PrismaFit, Siemens Healthineers), using a 15-channel knee coil (Quality Electrodynamics). A 0.6mm isotropic 3D segmented gradient-recalled echo (GRE) pulse sequence with LIBRE water-selective excitation and variable T2 preparation (T2prep) time was used with centric Cartesian k-space ordering (Fig.1A), and was named Lib3DGRE4. Further acquisition parameters included Np=100 readouts per segment, GRAPPA factor 2, four T2 preparation times TET2prep= {0,23,38,53}ms, and scan time 11.1min. All image reconstructions and analyses were performed in Matlab (The MathWorks).GRAPPA-reconstructed images (called “standard” images) were processed with HD-PROST to create denoised images. The signal S in standard images was fitted with the previously studied4 analytical T2 decay equation with an offset to account for T1 recovery:
$$S=S_0\cdot (e^{-\frac{TET_2prep}{T_2}}+\frac{\delta}{T_2}) ,$$ (1)
which was dubbed mapping technique I (Fig.1B). Both the standard and denoised images were also matched with a T2 dictionary that was generated with Bloch equation simulations of the sequence, which resulted in mapping techniques II and III, respectively.
A NIST phantom (QalibreMD) was used to optimize the offset δ of Eq.1 for technique I, as well as the number of lines N per segment that was averaged to represent the magnetization in the dictionary for techniques II and III. To this end, we performed linear regressions of the resulting T2 values for ranges of δ and N against a spin-echo gold standard and retained the versions with the slope closest to identity.
All human studies were approved by the local ethics committee. Two groups of five subjects each were selected from a preexisting dataset. The first group (two female, age 39±15y) were healthy volunteers with no history of knee lesions. The second group (three female, age 49±13y) were patients diagnosed with mild OA in the knee cartilage, which was defined as lesions on exams diagnosed by an experienced radiologist and no pain in the knee. In each subject, knee cartilage was segmented in a single source image and this segmentation was copied to the three T2 maps. The cartilage T2 values and coefficient of variation (CoV=mean/stdev, ~1/precision) were computed for each subject. We also computed the lateral and medial segmental T2 values, since the latter region is known to be more load-bearing7 and thus to contain more lesions, therefore causing potential T2 elevation. Comparisons were made with ANOVA and Student's t-tests as appropriate.
Results
In the phantoms, the optimized parameters were δ=5ms and N=5. The analytical fit (technique I) led to a slight T2 underestimation, while the dictionary fits both led to a slight but consistent overestimation that was nevertheless more accurate (Fig.2). Dictionary matching with the denoised instead of the standard images did not significantly alter the T2 mapping (P=0.86).In knee cartilage, the standard images with both techniques I and II resulted in visually noisy maps, while the combined denoised images and dictionary fitting of technique III led to smooth cartilage T2 values (Fig.3). Focal lesions that were confirmed in anatomical images were also visible in the denoised maps, but were usually not visible in the other two reconstructions (Fig.4). The cartilage T2 values of the three techniques averaged over all 10 subjects were 27.4±5.7ms, 43.2±4.1ms (P<0.001 vs. technique I), and 40.6±2.8ms (P=0.07 vs. technique II), respectively. When assessing the two subject groups separately, the mean T2 values also did not significantly change (P>0.08) when switching from standard to denoised source images (Fig.5). The T2 CoV did decrease from technique I to III, first by using the dictionary fit and further by denoising (P<0.001). T2 values obtained with technique III were significantly greater in the medial, load-bearing compartment compared to the lateral compartment (P=0.01).
Discussion
The relative differences between the three techniques in vivo were consistent with the phantom results. The obtained precision and the ability to discern between healthy subject and patients with mild OA are very promising, although the impact of this is limited by the small number of subjects. In conclusion, we successfully demonstrated that the proposed dictionary fitting and patch-based denoising increase both the accuracy and precision of the knee cartilage T2 mapping without affecting the map sharpness.Acknowledgements
No acknowledgement found.References
1. Wallace, I. J. et al. Knee osteoarthritis has doubled in prevalence since the mid-20th century. Proc. Natl. Acad. Sci. 114, 9332–9336 (2017).
2. MacKay, J. W. et al. Systematic review and meta-analysis of the reliability and discriminative validity of cartilage compositional MRI in knee osteoarthritis. Osteoarthritis Cartilage 26, 1140–1152 (2018).
3. Colotti, R., Omoumi, P., Bonanno, G., Ledoux, J.-B. & van Heeswijk, R. B. Isotropic three-dimensional T2 mapping of knee cartilage: Development and validation. J. Magn. Reson. Imaging JMRI 47, 362–371 (2018).
4. Colotti, R., Omoumi, P., van Heeswijk, R. B. & Bastiaansen, J. A. M. Simultaneous fat-free isotropic 3D anatomical imaging and T2 mapping of knee cartilage with lipid-insensitive binomial off-resonant RF excitation (LIBRE) pulses. J. Magn. Reson. Imaging JMRI 49, 1275–1284 (2019).
5. Bustin, A. et al. High-dimensionality undersampled patch-based reconstruction (HD-PROST) for accelerated multi-contrast MRI. Magn. Reson. Med. 81, 3705–3719 (2019).
6. Ma, D. et al. Magnetic resonance fingerprinting. Nature 495, 187–92 (2013).
7. Omoumi, P., Michoux, N., Thienpont, E., Roemer, F. W. & Vande Berg, B. C. Anatomical distribution of areas of preserved cartilage in advanced femorotibial osteoarthritis using CT arthrography (Part 1). Osteoarthritis Cartilage 23, 83–87 (2015).
Figures
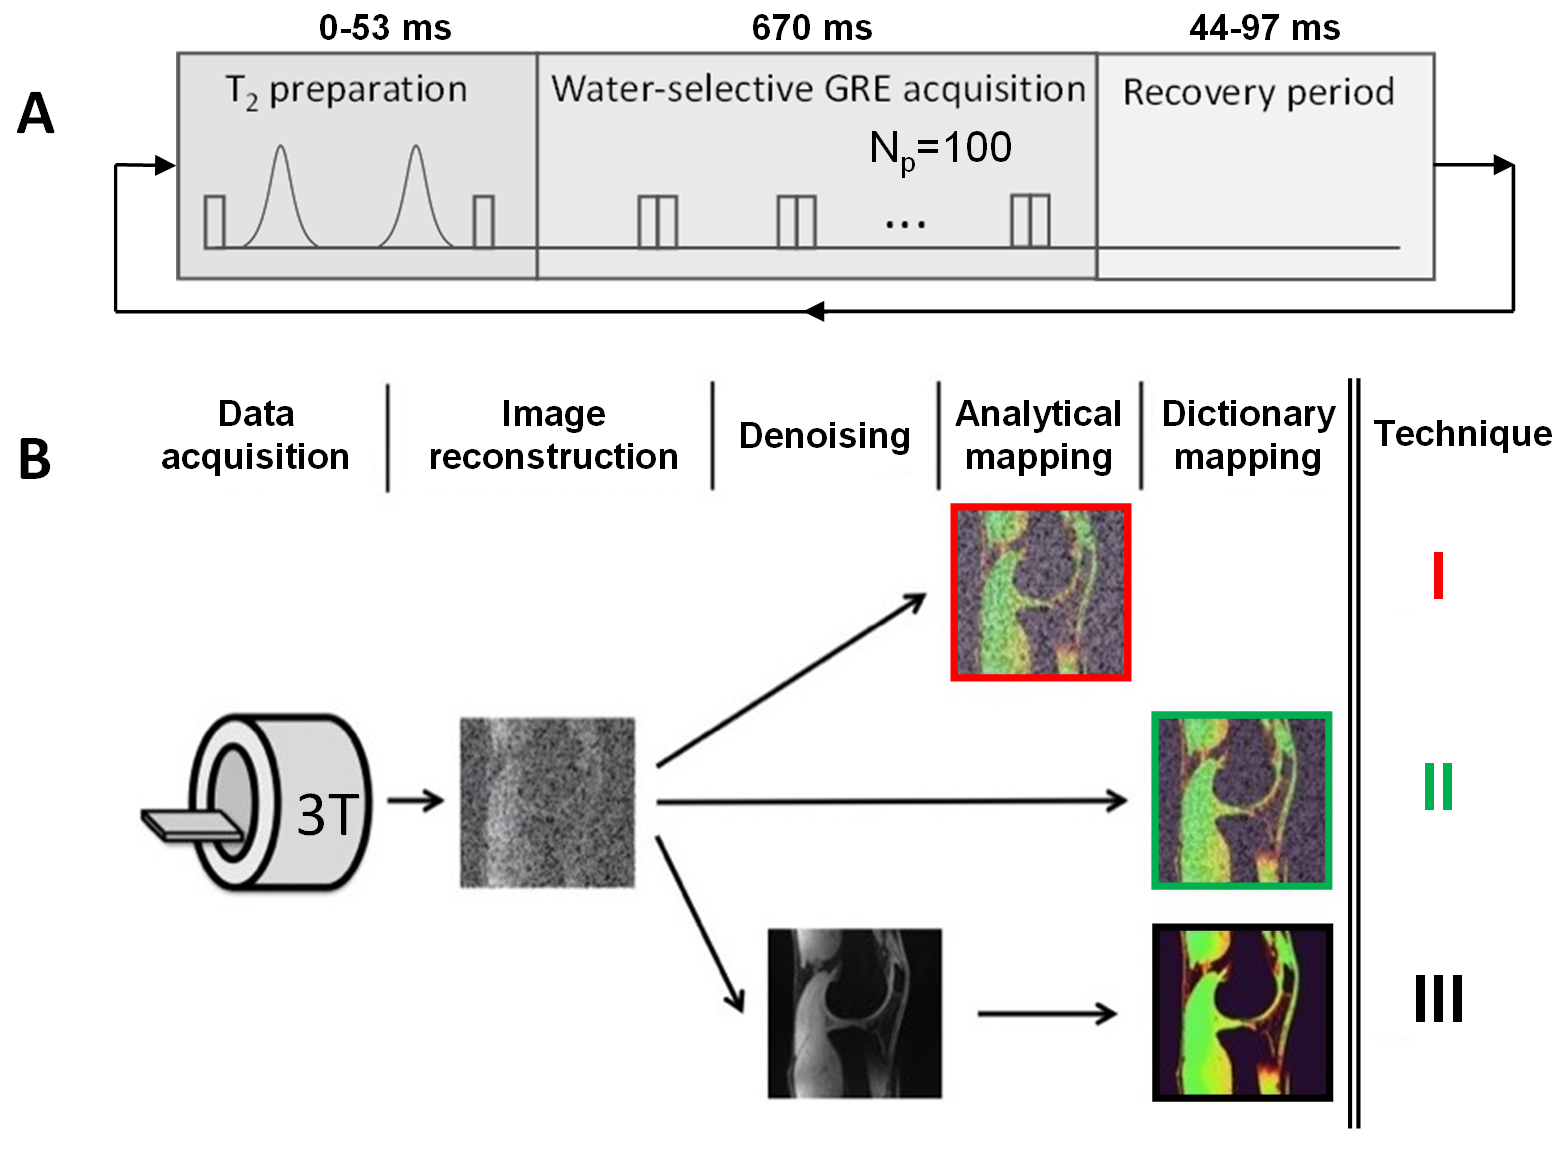
Figure 1. Acquisition and reconstruction of the T2 maps. A) The Lib3DGRE pulse sequence consists of an T2 preparation followed by GRE segments of 100 readouts with LIBRE water excitation and a recovery period. B) Reconstruction of the three types of T2 maps. After GRAPPA-based reconstruction of the source images, a T2 map is computed with the analytical equation (I) or by dictionary matching (II). As a third option, the source images are denoised with HD-PROST and a T2 map is generated with the same dictionary (III). The color-coding of the techniques is used throughout this work.
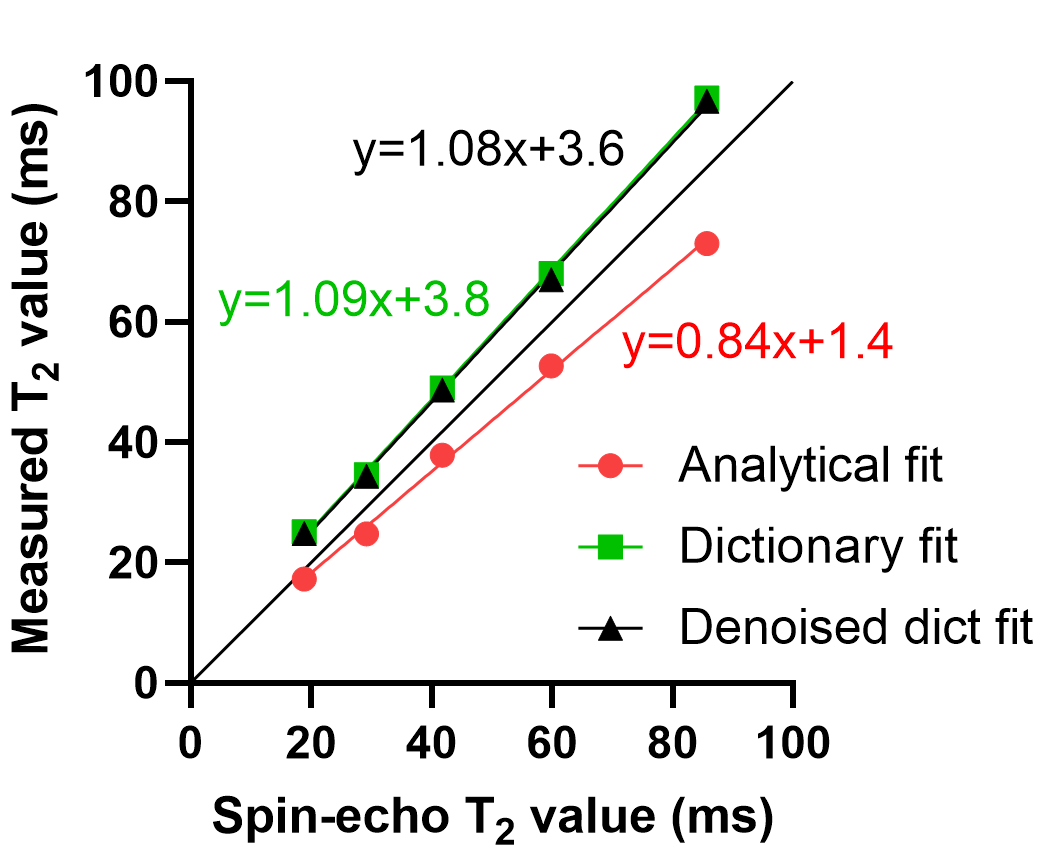
Figure 2. Phantom calibration and validation. The three tested techniques were compared to a spin-echo (SE) gold standard sequence in the T2 layer of the NIST Systems Phantom in compartments with relevant T2 values. The analytical fit slightly underestimated the SE values, while the dictionary fits slightly overestimate them. Interestingly, the denoising of the source images does significantly not affect the dictionary fit. All R2 were >0.99.
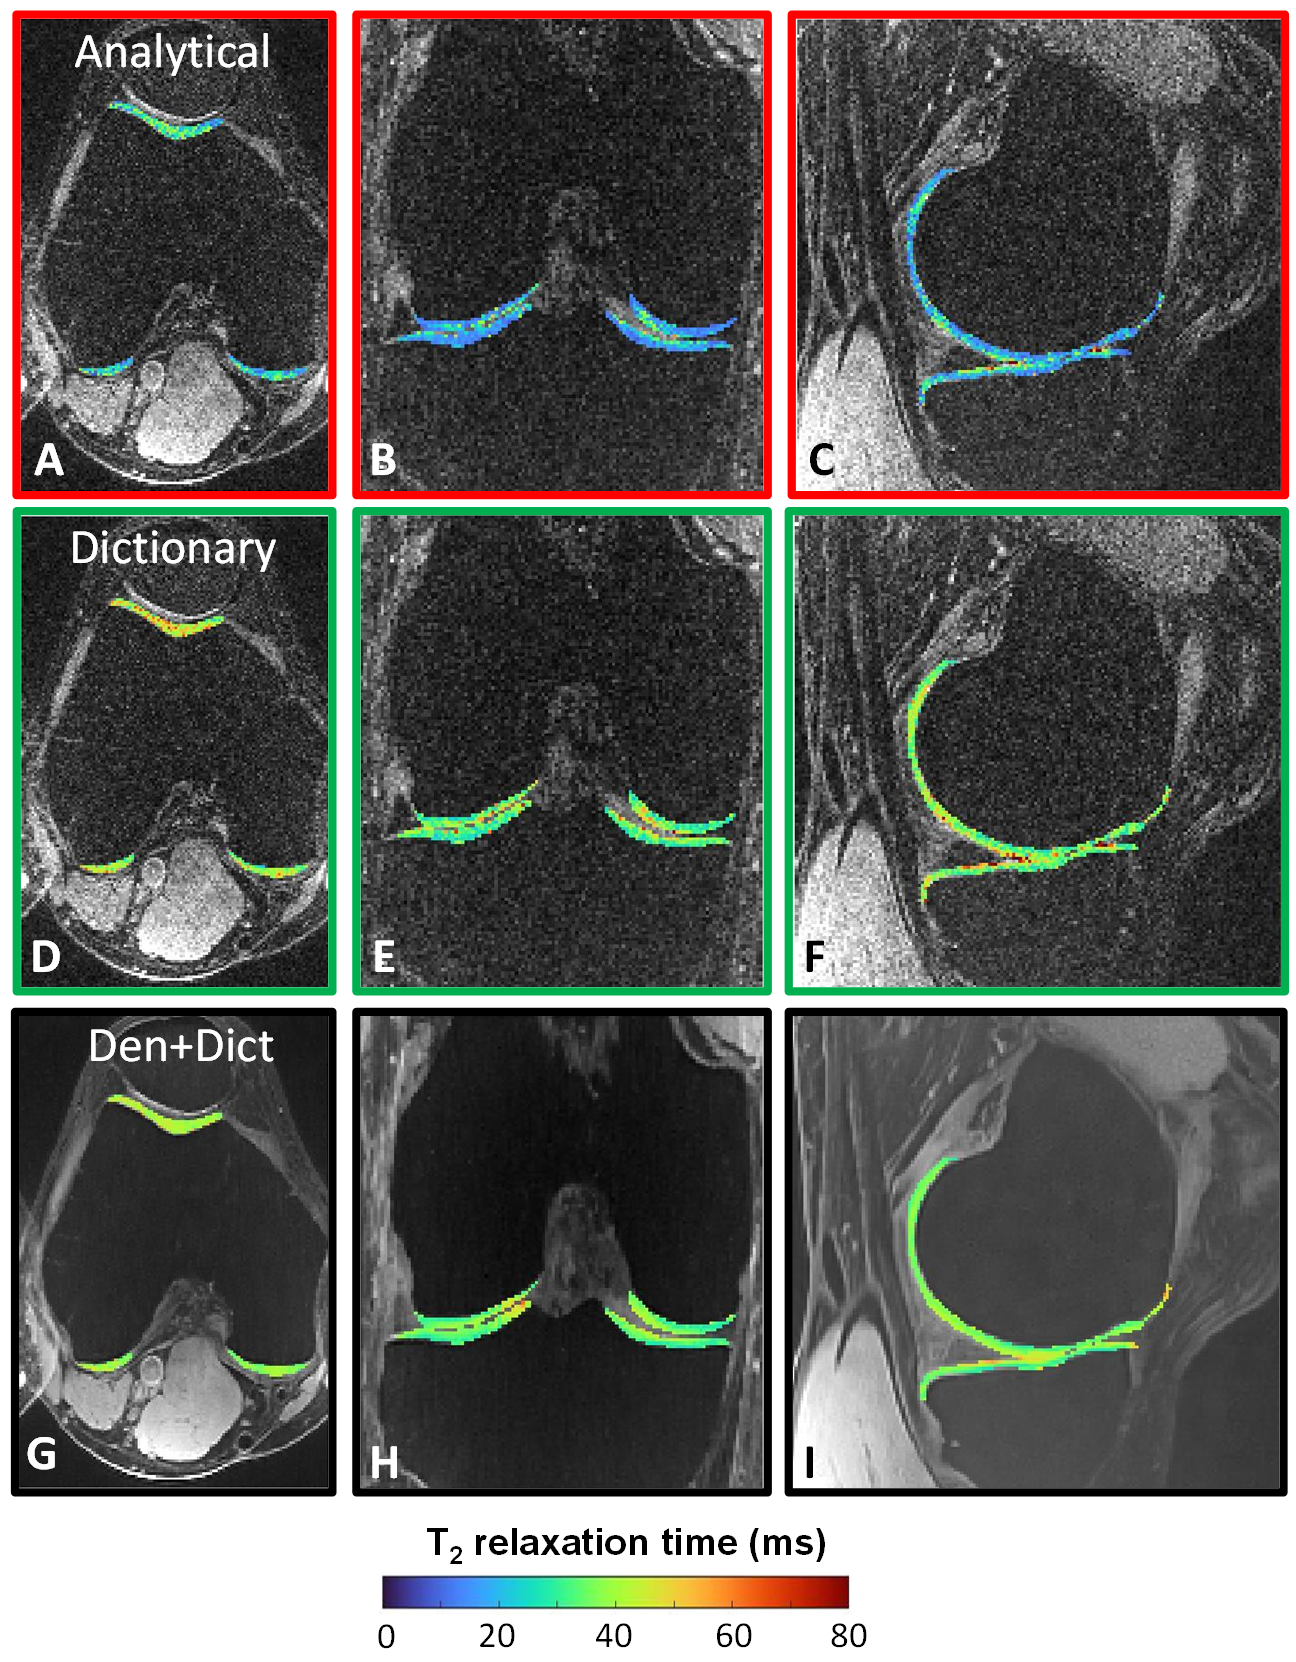
Figure 3. A comparison of the three T2 maps of a healthy volunteer in three orthogonal dimensions. The T2 maps are shown within segmented knee cartilage, superimposed on a T2-prepared knee image from which they were computed. A-C) The analytical fit in more noisy regions results in T2 underestimations (blue). D-F) The dictionary fit appears more stable throughout the cartilage. The values are higher than those of the analytical fit, consistent with the phantom results. G-I) In de denoised+dictionary T2 maps, the precision is high in all compartments.
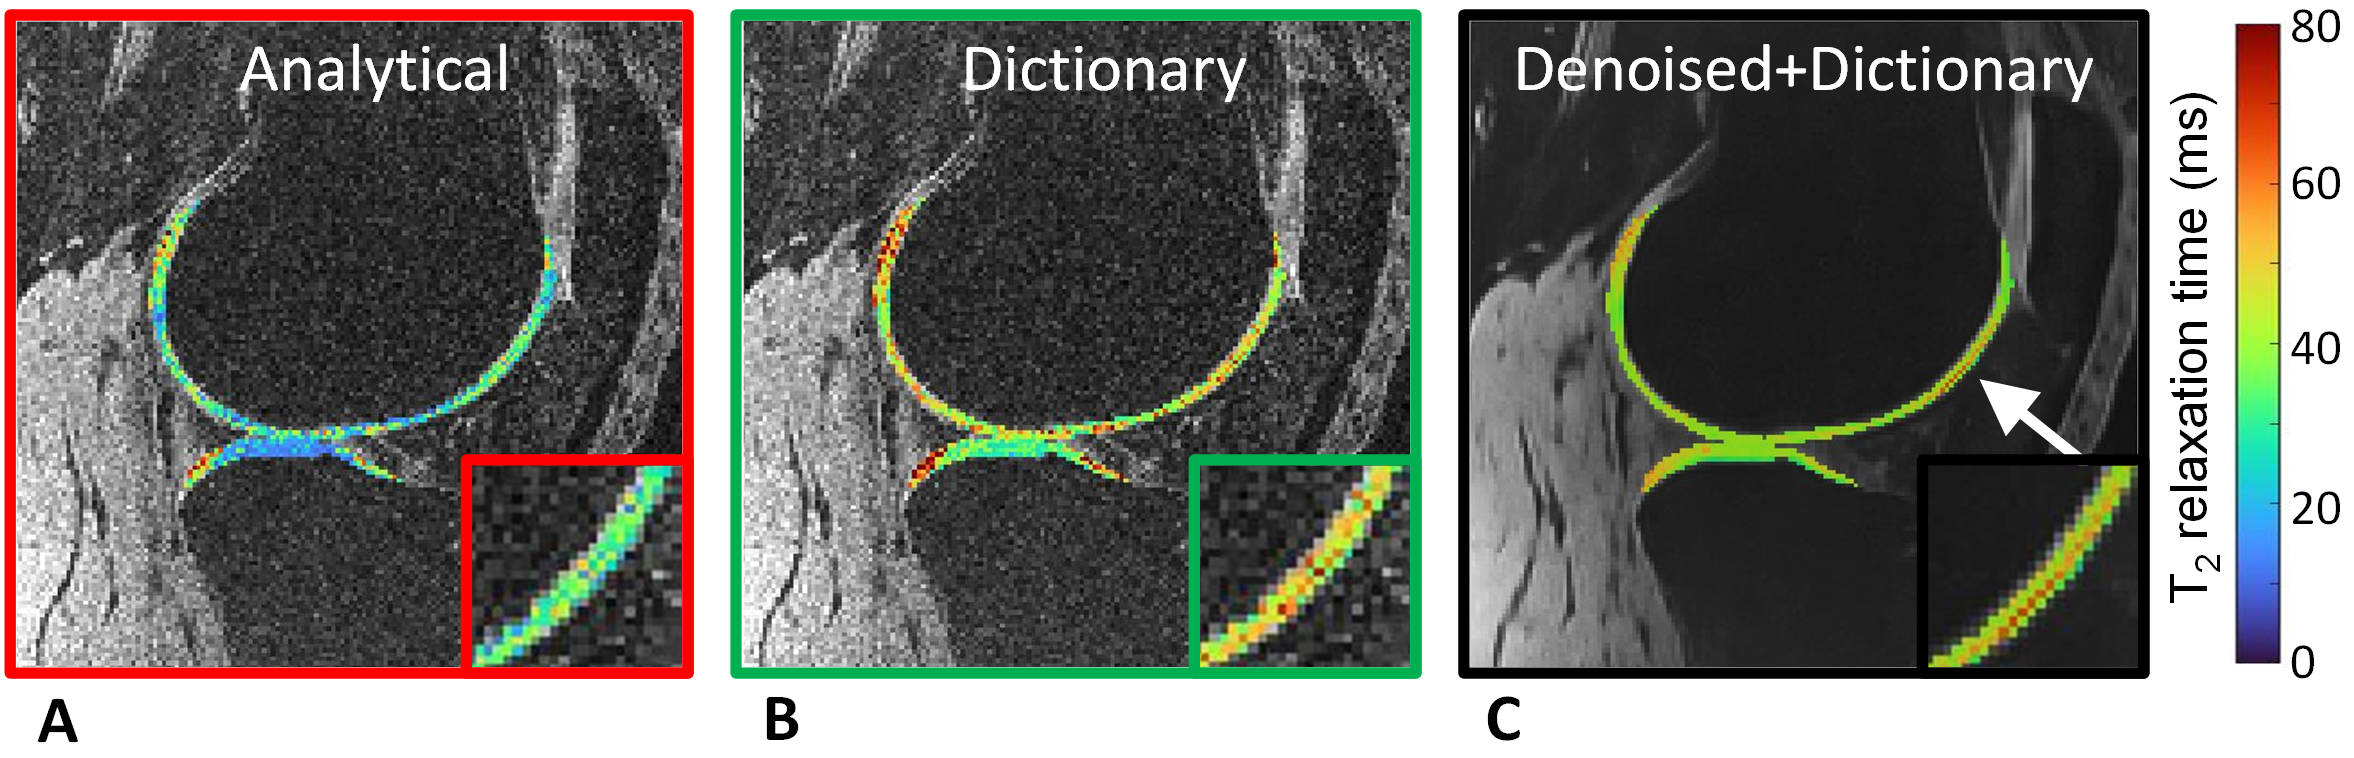
Figure 4. Identification of a lesion in knee cartilage. In this patient with mild osteoarthritis, the denoised-dictionary maps appear smoother and allow a small lesion (arrow and inset) that was previously identified on anatomical imaging to be more readily identified.
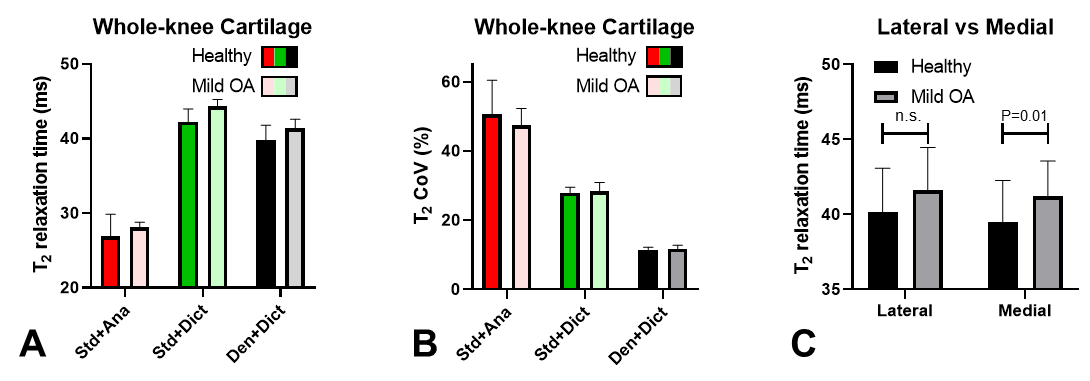
Figure 5. Numerical comparison of the T2 map reconstructions. A) The analytical fit results in lower T2 values than both dictionary fits (P<0.001). No technique shows a difference between the healthy and mild-OA subjects (P>0.08). B) The CoV decreases when changing from the analytical to the dictionary fit, and decreases further when using denoising (all P<0.001). C) When comparing the lateral and medial cartilage regions between healthy and mild-OA subjects, a T2 elevation can be detected with proposed technique III. Colors again represent techniques.