2303
Topographical Associations of Knee Cartilage MRI with Osteoarthritis Pain: Data from the Osteoarthritis Initiative.1Radiological Sciences, Division of Clinical Neuroscience, University of Nottingham, Nottingham, United Kingdom, 2NIHR Nottingham Biomedical Research Centre, University of Nottingham, Nottingham, United Kingdom, 3Department of Radiology, Norfolk and Norwich University Hospitals NHS Foundation Trust, Norwich, United Kingdom, 4Norwich Medical School, University of East Anglia, Norwich, United Kingdom
Synopsis
Pain is a hallmark of knee osteoarthritis, a chronic condition with considerable health and socioeconomic burden. Osteoarthritic changes of the knee cartilage are often used as an outcome marker for clinical trials, but only weakly associated with pain. In this study, we aimed to examine the topographic correlation between intensity differences in knee cartilage MRI and knee pain. Voxel based morphometry (VBM) is used with linear effects modelling to show the spatial localization of knee OA contributing to pain. Local maxima and clusters with extents with P<0.05 are determined using random field theory.
Introduction
Knee osteoarthritis (OA) is a whole organ disease with a considerable health and socio-economic burden. Knee cartilage is a primary target for restorative interventions (1) and serves as an outcome marker in clinical trials (2,3). Semi-quantitative methods exist for scoring the knee joint (4) but are time consuming, require expert knowledge and do not produce the spatial localization of knee pain. Statistical parametric mapping has successfully demonstrated morphological changes via knee cartilage surface mapping (5). However this method currently requires users to manually register a template to test surfaces which limits scalability. We recently constructed an automated anatomical knee atlas and showed topographical associations between bone marrow lesions and OA knee pain in a small sample (6). In this study we develop knee pain pathology mapping using voxel based morphometry further to demonstrate the spatial localization of cartilage abnormalities associated with pain in a large cohort of participants with knee osteoarthritis.Method
3D double echo steady state knee MRI for participants with knee OA from the Osteoarthritis Initiative (OAI) cohort study (7) were selected for this analysis. MRI images underwent bias field correction using ANTs image intensity normalization. Also, right knees underwent an initial reflection along the median plane to have the same structure as left knees. A study specific knee atlas was created using 10 participants from the incident cohort of the OAI with no knee pain, difficulty squatting or pivoting, a knee valgus alignment of 180⁰, a BMI <30 and age between 50 and 70yrs. Knees were iteratively co-registered to an average image using an affine registration, the average image updated after each iteration. A total of 10 iterations were used to create the knee atlas.For these 10 participants, automated cartilage segmentations generated using our recent U-net method (8) were registered to the knee atlas using an initial affine transform (FSL-FLIRT) followed by a non-linear transform (FSL-FNIRT). Cartilage regions of interest (ROI) included: tibial, meniscal, femoral and patella cartilage. Subsequently, knees from the progression cohort of the OAI (n = 1833) were registered to the knee atlas using the same affine and non-linear transforms. MRIs were then blurred using a 3D Gaussian filter with a standard deviation equal to the pixel size in each direction (0.3×0.3×0.5mm). VBM analysis was then used to evaluate parametric associations of cartilage signal intensity vs knee pain using a linear effects model:
M = 1+BMI+Gender+ Pain
The pain was assessed by the valid and reliable Knee injury and Osteoarthritis Outcome Score (KOOS) pain subscale with a range of values: 100 – no pain, 0 – extreme pain (9). Cartilage intensity normalization was performed by dividing each ROI by the maximum intensity value within the ROI. Analysis was performed using SurfStat a MATLAB toolbox for the statistical analysis of univariate and multivariate surface and volumetric data using linear mixed effects models and random field theory (10). Local maxima with P<0.05 and clusters with extents that have P<0.05 area determined using random field theory (11).
Results
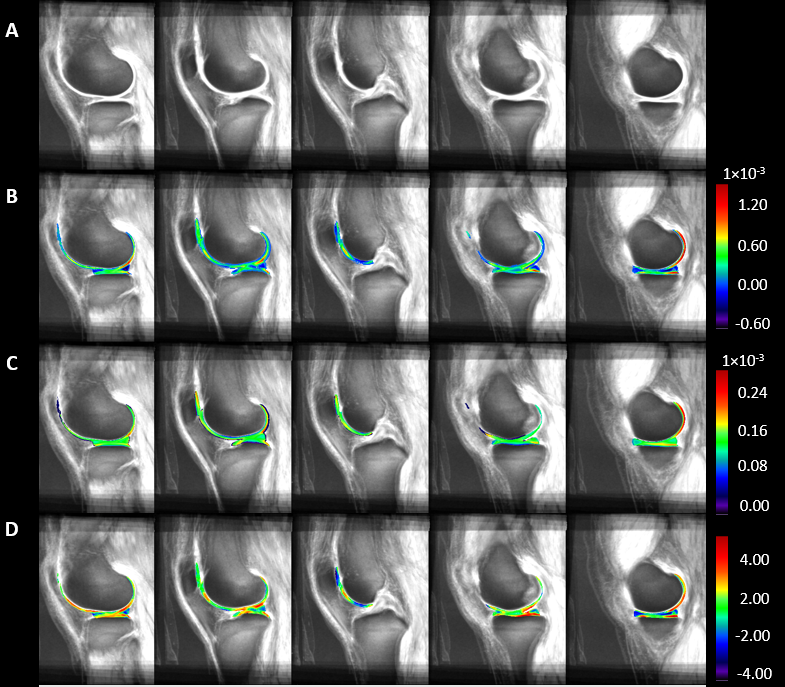
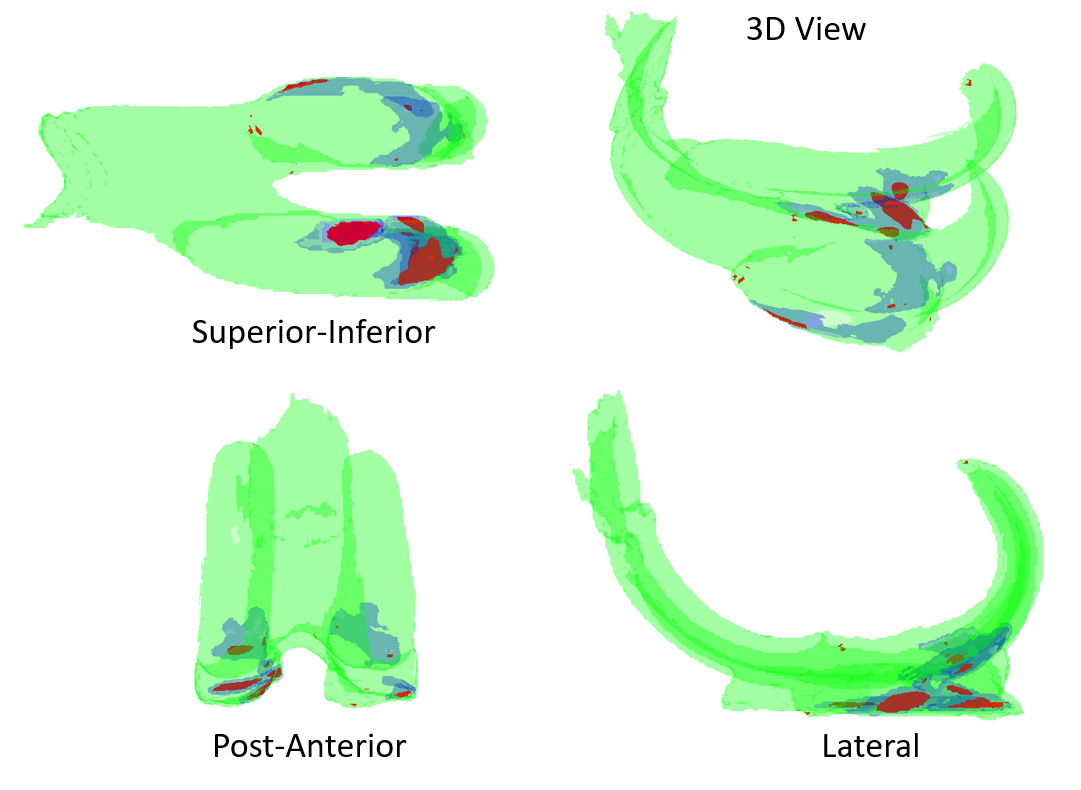
The T-statistic, estimated effect and it’s error for negative effects of knee pain on MRI signal intensity is shown Figure 1. The model had 1831 degrees of freedom. Significant T-statistic using random field thresholding at p-value of 0.05 = 4.27. Significant maximum and clusters with extents with P<0.05 are shown in Figure 2.Discussion
Using voxel based morphometry it is possible to shown the significant regions within cartilage that are associated with pain in knee osteoarthritis. In our analysis using data from the OAI, the significant regions that correlated with knee pain are limited to the cartilage, greater involvement in the medial compartment. Future developments could include groupwise registration such as SimpleElastix (12) and the use of Jakobian corrections to avoid vicarious signal contamination from neighbouring tissues.Cartilage is a non-innervated tissue of the osteochondral structure. Presumably, the level of cartilage damage corresponds to the intensity of pain by sensitising other innervated joint structures, either the denuded bone directly or other joint structures indirectly by degradation products. Combining cartilage with additional tissues such as bone marrow lesions and synovitis may reveal further spatial interrelations pointing to specific drivers of knee pain.
Conclusion
To our knowledge this is the first VBM model developed to investigate knee cartilage changes that are associated with knee osteoarthritis. It offers a systematic extension of the knee pain pathology mapping approach that was focused on bone marrow lesions. Interestingly, both approaches reported medial predominance of pain-pathology associations. The model also provides valuable novel analysis tool, and will enable researchers to systematically study topographical relationship between any MRI detectable knee pathology and symptoms/outcomes in knee OA.Acknowledgements
Data and/or research tools used in the preparation of this manuscript were obtained and analyzed from the controlled access datasets distributed from the Osteoarthritis Initiative (OAI), a data repository housed within the NIMH Data Archive (NDA). OAI is a collaborative informatics system created by the National Institute of Mental Health and the National Institute of Arthritis, Musculoskeletal and Skin Diseases (NIAMS) to provide a worldwide resource to quicken the pace of biomarker identification, scientific investigation and OA drug development.References
1. Mithoefer K, Williams RJ, Warren RF, Potter HG, Spock CR, Jones EC, et al. Chondral resurfacing of articular cartilage defects in the knee with the microfracture technique. Surgical technique. J Bone Joint Surg Am [Internet]. 2006 [cited 2021 Nov 8];88 Suppl 1 Pt 2:294–304. Available from: https://journals.lww.com/jbjsjournal/Fulltext/2006/09001/Chondral_Resurfacing_of_Articular_Cartilage.13.aspx
2. Karsdal MA, et al. Treatment of symptomatic knee osteoarthritis with oral salmon calcitonin: results from two phase 3 trials. Osteoarthr Cartil [Internet]. 2015 Apr 1 [cited 2021 Oct 27];23(4):532–43. Available from: https://pubmed.ncbi.nlm.nih.gov/25582279/
3. McAlindon TE, et al. Effect of Intra-articular Triamcinolone vs Saline on Knee Cartilage Volume and Pain in Patients With Knee Osteoarthritis: A Randomized Clinical Trial. JAMA [Internet]. 2017 May 16 [cited 2021 Oct 27];317(19):1967–75. Available from: https://pubmed.ncbi.nlm.nih.gov/28510679/
4. Arouche Nunes BA, Flament I, Shah R, Bucknor M, Link T, Pedoia V, et al. MRI-based multi-task deep learning for cartilage lesion severity staging in knee osteoarthritis. Osteoarthr Cartil [Internet]. 2019 [cited 2019 Jul 11];27:S398–9. Available from: https://www.oarsijournal.com/article/S1063-4584(19)30441-8/pdf
5. MacKay JW, Kaggie JD, Treece GM, McDonnell SM, Khan W, Roberts AR, et al. Three-Dimensional Surface-Based Analysis of Cartilage MRI Data in Knee Osteoarthritis: Validation and Initial Clinical Application. J Magn Reson Imaging [Internet]. 2020 Oct 1 [cited 2021 Nov 9];52(4):1139–51. Available from: https://onlinelibrary.wiley.com/doi/full/10.1002/jmri.27193
6. Arthofer C, Zedan Y, Tench C, Kurien T, Scammell B, Kerslake R, et al. Construction of an anatomical template of the knee and voxel-based knee pathology-pain mapping. Osteoarthr Cartil. 2021 Apr 1;29:S348–9.
7. Michael Nevitt AC, Felson DT, Lester G. OAI Protocol THE OSTEOARTHRITIS INITIATIVE PROTOCOL FOR THE COHORT STUDY [Internet]. [cited 2019 Jul 30]. Available from: https://oai.epi-ucsf.org/datarelease/docs/StudyDesignProtocol.pdf
8. Peake EJ, Chevasson R, Pszczolkowski S, Auer DP, Arthofer C. Ensemble learning for robust knee cartilage segmentation: data from the osteoarthritis initiative. bioRxiv [Internet]. 2020 Sep 1 [cited 2020 Sep 17];2020.09.01.267872. Available from: https://doi.org/10.1101/2020.09.01.267872
9. Roos EM, Toksvig-Larsen S. Knee injury and Osteoarthritis Outcome Score (KOOS) - validation and comparison to the WOMAC in total knee replacement. Health Qual Life Outcomes [Internet]. 2003 May 25 [cited 2019 Aug 9];1(1):17. Available from: http://www.ncbi.nlm.nih.gov/pubmed/12801417
10. Chung MK, Worsley KJ, Nacewicz BM, Dalton KM, Davidson RJ. General multivariate linear modeling of surface shapes using SurfStat. Neuroimage. 2010 Nov 1;53(2):491–505.
11. Worsley KJ, Andermann M, Koulis T, Macdonald D, Evans AC. Detecting Changes in Nonisotropic Images. Hum Brain Mapp. 1999;8:98–101.
12. Marstal K, Berendsen F, Staring M, Klein S. SimpleElastix: A User-Friendly, Multi-Lingual Library for Medical Image Registration [Internet]. 2016 [cited 2021 Nov 9]. p. 134–42. Available from: https://github.com/kaspermarstal/SimpleElastix.
Figures