2302
Anisotropy of T2 and T1ρ Relaxation in Bovine Articular Cartilage at 3 T1Research Unit of Magnetic Imaging, Physics and Technology, University of Oulu, Oulu, Finland, 2University of Eastern Finland, Kuopio, Finland, 3Department of Diagnostic Radiology, Oulu University Hospital, Oulu, Finland, 4Medical Research Center, University of Oulu and Oulu University Hospital, Oulu, Finland
Synopsis
Multiple studies have investigated the orientation dependence of T2 and T1ρ relaxation in articular cartilage using ultra-high field magnets. This study aims to replicate these findings in a clinical measurement setting, performing a series of measurements at multiple orientations on a 3 T clinical scanner using large ex vivo joint samples. Function of a previously suggested relaxation model was confirmed in a low field-strength environment. Anisotropic components of T2 and T1ρ relaxation varied widely depending on the measured parameter, the spin-lock frequency, the magnetization preparation used for the spin-lock experiment (continuous wave/adiabatic), and the considered cartilage layer (superficial/deep half).
Introduction
The anisotropy of different relaxation parameters, such as T1ρ and T2 in articular cartilage has been reported previously.1,2 These studies, often using ultra-high field magnets, link the orientation to the water-orienting structure and properties of the collagen network. For T2 in particular, the anisotropy has been linked to residual dipolar coupling.3 While often considered a source of measurement artifact, relaxation anisotropy can also be used to obtain clinically relevant information on the studied tissue.4 With a broad enough sampling of cartilage orientations, the isotropic and anisotropic relaxation components can be separated and potentially used to estimate the structural anisotropy of the underlying tissue.5 This study aims to compare the degree of anisotropy in bovine articular cartilage through multiple high resolution T2 and T1ρ measurements with broad sampling of sample orientations using a clinical 3 T MRI device. The main components of the study are the separation of the measured relaxation into isotropic and anisotropic components, the calculation of anisotropy values, and of individual analysis and comparison of the relaxation parameters.Methods
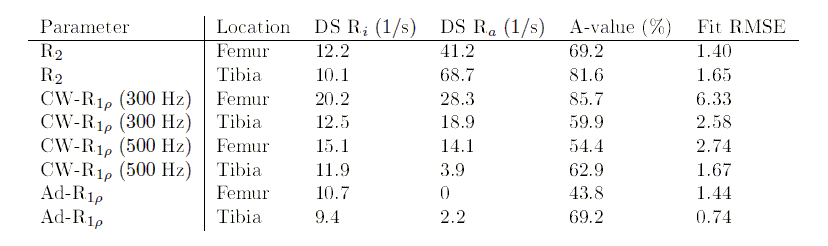
Four bovine stifle joint samples containing femoral and tibial cartilage were purchased from a local farm. The samples were frozen for a period of 1 to 5 weeks at -30°C and thawed at 21°C over a period of 24 hours before preparation. Each thawed sample was placed in a vacuum bag, and a small amount of Dulbecco's phosphate buffered saline (DPBS, Sigma Aldrich) was introduced to the joint capsule in order to stabilize the hydrostatic conditions of the cartilage surfaces. The scanning was performed at the Oulu University Hospital in Oulu, Finland; using a 3 T whole body MRI scanner (MAGNETOM Skyra, Siemens Healthcare). Initial sample orientation was chosen to simulate a patient lying feet first on a sagittal plane on the patient bed. From this orientation, a single 3 mm thick imaging slice with an in-plane resolution of 0.52 $$$\times$$$ 0.52 mm2 was selected for scanning. Each sample was scanned at 22 different orientations from 0 to 220° along the selected plane using a purpose-built rotation platform. Four imaging sequences were used for the measurements with the following properties: T2-weighted multi-echo spin-echo (MESE-T2) sequence with ETL = 12 and echo spacing of 10.7 ms. Continuous-wave T1ρ (CW-T1ρ) utilizing two separate spin lock frequencies of 300 and 500 Hz, with 5 spin-lock durations of 0, 20, 40, 60 and 80 ms. Adiabatic T1ρ (Ad-T1ρ) with a spin-lock frequency of 600 Hz, with 5 spin-lock durations of 0, 24, 48, 76 and 96 ms. Each measurement sequence used 3 averages per scan and TR = 3.5 s. The total scan time of a single sample was on average 4 hours. The images were coregistered using Elastix.6,7 Pixel-wise relaxation time maps were calculated from the coregistered sets. Using the parameter maps and weighted MR images, two rectangular ROIs were selected from each sample, one from femoral and one from tibial cartilage. These ROIs were split depth-wise into two segments: surface segment (SS) and deep segment (DS). Collagen in articular cartilage is assumed to have a high degree of organization in deep cartilage, and a low degree near the surface. The orientation profiles of the relaxation rates $$$(R = 1/T)$$$ of each segment were then fitted with8 $$R = R_{i} + R_{a}(3\cos^2 (\theta + \Delta) - 1)^2/4,\;\;\;\;\;\;\;(1)$$ where Ri is the isotropic relaxation rate, Ra is the anisotropic relaxation rate, θ is the sample orientation with respect to B0, and Δ is the estimated orientation of the bone-cartilage interface normal of each ROI with respect to B0. The fits were calculated using the least squares method. Deep segment ROI anisotropy values were obtained as averages from anisotropy maps calculated using a pixel-wise Michelson contrast: $$ A = (R_{max}-R_{min})/(R_{max}+R_{min})\;\;\;\;\;\;\;(2)$$Results
All orientation dependence profiles (Fig. 1-4) showed a varying degree of anisotropy, with the largest changes in relaxation rates present in MESE-T2 (Fig. 1). While the anisotropic component of the relaxation rate (Ra) obtained from the studied samples varies, their isotoropic components (Ri) have relatively similar values (Table 1). Generally, Ra was faster in each deep segment when compared to its corresponding surface segment. The fastest Ra components were found in MESE-T2, followed by CW-T1ρ 300 Hz, CW-T1ρ 500 Hz and finally Ad-T1ρ. In the case of the latter two, Ri was found to be faster than Ra. The anisotropy values of each deep segment ROI (Table 1) show that MESE-T2 displayed on average the largest degree of anisotropy.Discussion
The aim of the study was to compare the anisotropy of different relaxation parameters determined with high angular resolution in a 3 T clinical MRI device. Ra were found to depend on both the measured relaxation rate (R2 and R1ρ) and on the preparation (CW-R1ρ and Ad-R1ρ), highlighting the importance of sequence selection on reducing the effect of relaxation anisotropy during imaging when such contrast is needed.2 The comparative insensitivity of Ri to the aforementioned factors points to the possibility of a deeper correspondence existing between the different isotropic relaxation rates. The systematic orientation dependence observed here could be in the future used to correct images for magic-angle effect, or design new orientation-independent relaxation parameters.Acknowledgements
Jane and Erkko Foundation and Academy of Finland (grants #285909 and #325146) are gratefully acknowledged for financial support.References
1. R. M. Henkelman, G. J. Stanisz, J. K. Kim, and M. J. Bronskill. "Anisotropy of NMR properties of tissues". Magnetic Resonance in Medicine 32.5 (1994), pp. 592 601.
2. N. Hänninen, J. Rautiainen, L. Rieppo, S. Saarakkala, and M. J. Nissi. "Orientation anisotropy of quantitative MRI relaxation parameters in ordered tissue". Scientific reports 7.1 (2017), pp. 1-11.
3. Y. Xia and K. Momot. Biophysics and Biochemistry of Cartilage by NMR and MRI. Royal Society of Chemistry, 2016.
4. M. Bydder, A. Rahal, G. D. Fullerton, and G. M. Bydder. "The magic angle effect: A source of artifact, determinant of image contrast, and technique for imaging". Journal of Magnetic Resonance Imaging 25.2(2007), pp. 290-300.
5. N. E. Hänninen, O. Nykänen, M. Prakash, M. Hanni, M. T. Nieminen, and M. J. Nissi. "Orientation anisotropy of quantitative MRI parameters in degenerated human articular cartilage". Journal of Orthopaedic Research 39.4 (2021), pp. 861-870.
6. S. Klein, M. Staring, K. Murphy, M. A. Viergever, and J. P. Pluim. "elastix: a toolbox for intensity-based medical image registration". IEEE Transactions on Medical Imaging 29.1 (Jan. 2010), pp. 196-205.
7. D. P. Shamonin, E. E. Bron, B. P. Lelieveldt, M. Smits, S. Klein, and M. Staring. "Fast Parallel Image Registration on CPU and GPU for Diagnostic Classification of Alzheimer's Disease". Frontiers in Neuroinformatics 7.50 (Jan. 2014), pp. 1-15.
8. K. I. Momot, J. M. Pope, and R. M. Wellard. "Anisotropy of spin relaxation of water protons in cartilage and tendon". NMR in Biomedicine 23.3 (2010), pp. 313-324.
Figures
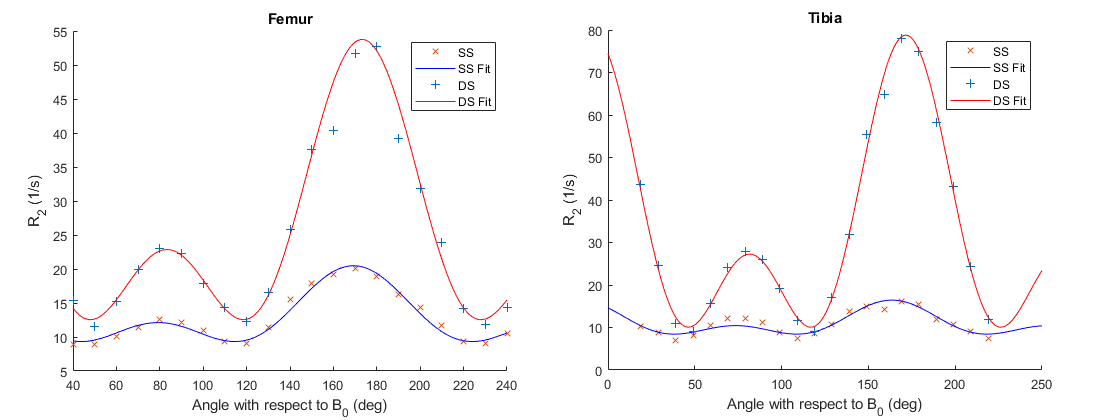
Figure 1. Orientation dependence of R2 (MESE-T2) in bovine articular cartilage. The femoral and tibial ROIs are divided to surface segment (SS) and deep segment (DS) and the relaxation model (Eq. 1) were fitted to these datasets separately.
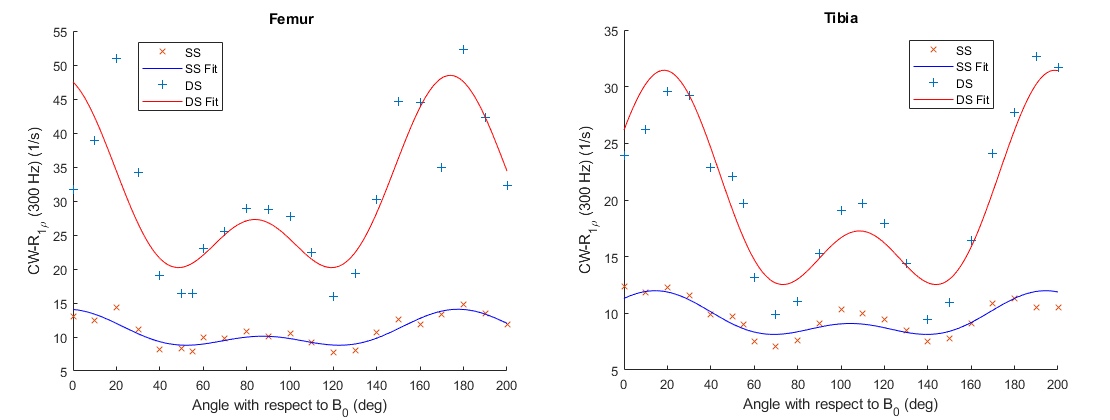
Figure 2. Orientation dependence of CW-R1ρ (300 Hz) in bovine articular cartilage. The femoral and tibial ROIs are divided to surface segment (SS) and deep segment (DS) and the relaxation model (Eq. 1) were fitted to these datasets separately.
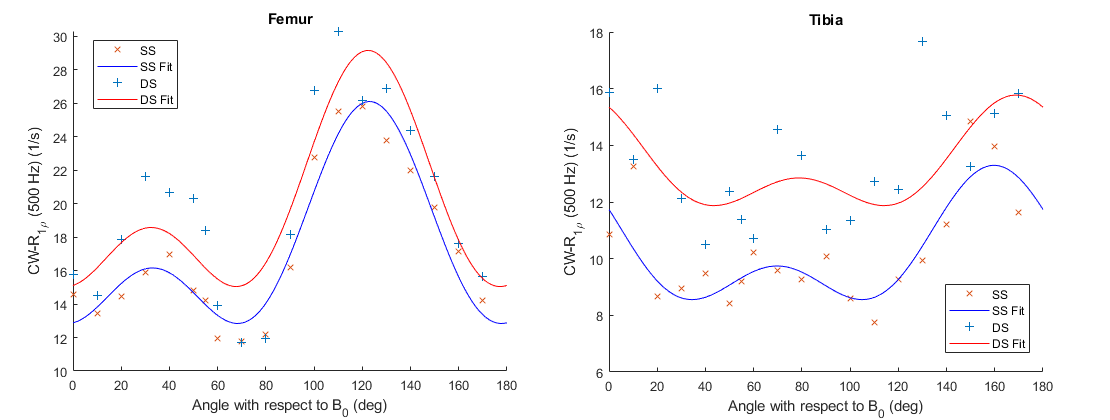
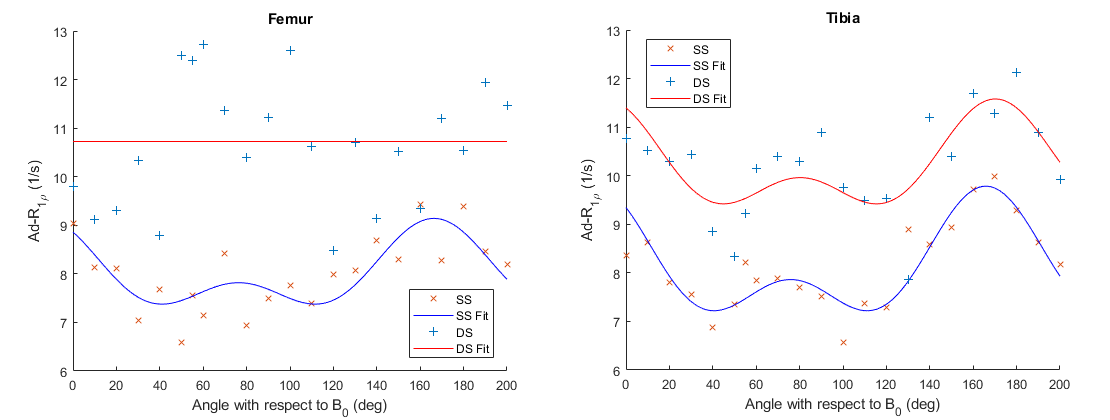
Figure 4. Orientation dependence of Ad-R1ρ in bovine articular cartilage. The femoral and tibial ROIs are divided to surface segment (SS) and deep segment (DS) and the relaxation model (Eq. 1) was fitted to these datasets separately.