2301
Unloaded-to-loaded changes in regional tibial cartilage T1ρ and T2: Utilization of an MRI compatible loading device1Radiology and Imaging, Hospital for Special Surgery, New York, NY, United States, 2Biomechanics, Hospital for Special Surgery, New York, NY, United States
Synopsis
Unloaded and loaded tibial cartilage T1ρ and T2 values were evaluated regionally. Only T1ρ, significantly changed from the unloaded-to-loaded condition. Shortening of loaded T1ρ values may be attributed to matrix water loss due to PG damage and attendant loss of the cartilage FCD. Though not all regions exhibited significant changes in unloaded-to-loaded T1ρ values, previous work demonstrated that tibial cartilage tissue and fibril strains follow the pattern of changes in FCD distribution. Inter-regional T2 variation increased from unloaded-to-loaded conditions, suggesting that T2 values were affected by a decreased FCD of cartilage that allowed water to move more freely between regions.
INTRODUCTION:
Quantitative MRI (qMRI) is increasingly used to evaluate early biostructural changes related to the initiation and progression of osteoarthritis (OA). Typically, T1ρ and T2 values of articular cartilage are prolonged in the setting of degeneration1-5. Compression of cartilage leads to extracellular matrix deformation and alterations in tissue water content that imparts changes to ion concentration and fixed charge density (FCD) 6. The purpose of this study was to utilize an MRI compatible loading device to evaluate tibial cartilage T1ρ and T2 metrics in loaded and unloaded conditions. We hypothesized that regional differences in T1ρ and T2 would exist between unloaded and loaded conditions.METHODS:
Five intact cadaveric knee joint specimens were evaluated. Tibiofibular and femoral osseous ends of the cadaver knee were mounted into an MRI compatible loading device with an incorporated a six axis load cell7. A clinical 3-Tesla scanner (GE Healthcare) and 16-channel flex coil were used to obtain morphologic and quantitative images in an initial, unloaded configuration. Next, a load of 50% body weight (BW) was applied to the joint. After 12 minutes of loading to permit tissue stress relaxation8, an additional set of MR-images were obtained. A combined T1ρ-T2 acquisition9 was utilized for assessment of proteoglycan content and collagen organization (matrix: 256x128; slice thickness: 4mm, field-of-view: 15cm; Spin Lock Times: 0, 10, 40, 80ms; Echo times: 0, 12.9, 25.7, 51.4ms).Medial and lateral tibial cartilage surfaces were manually segmented (MeVisLab) and cartilage T1ρ and T2 metrics were calculated across all voxels defined within each compartment10. Each compartment was separated into five regions (Central, Anterior, Posterior, Internal and External) using a previously described method (Figure 1)11. Two-way repeated measures ANOVAs were used to compare the mean changes in T1ρ and T2 values within each compartment and region before and after the application of load. Significance was set at p < 0.05.
RESULTS:
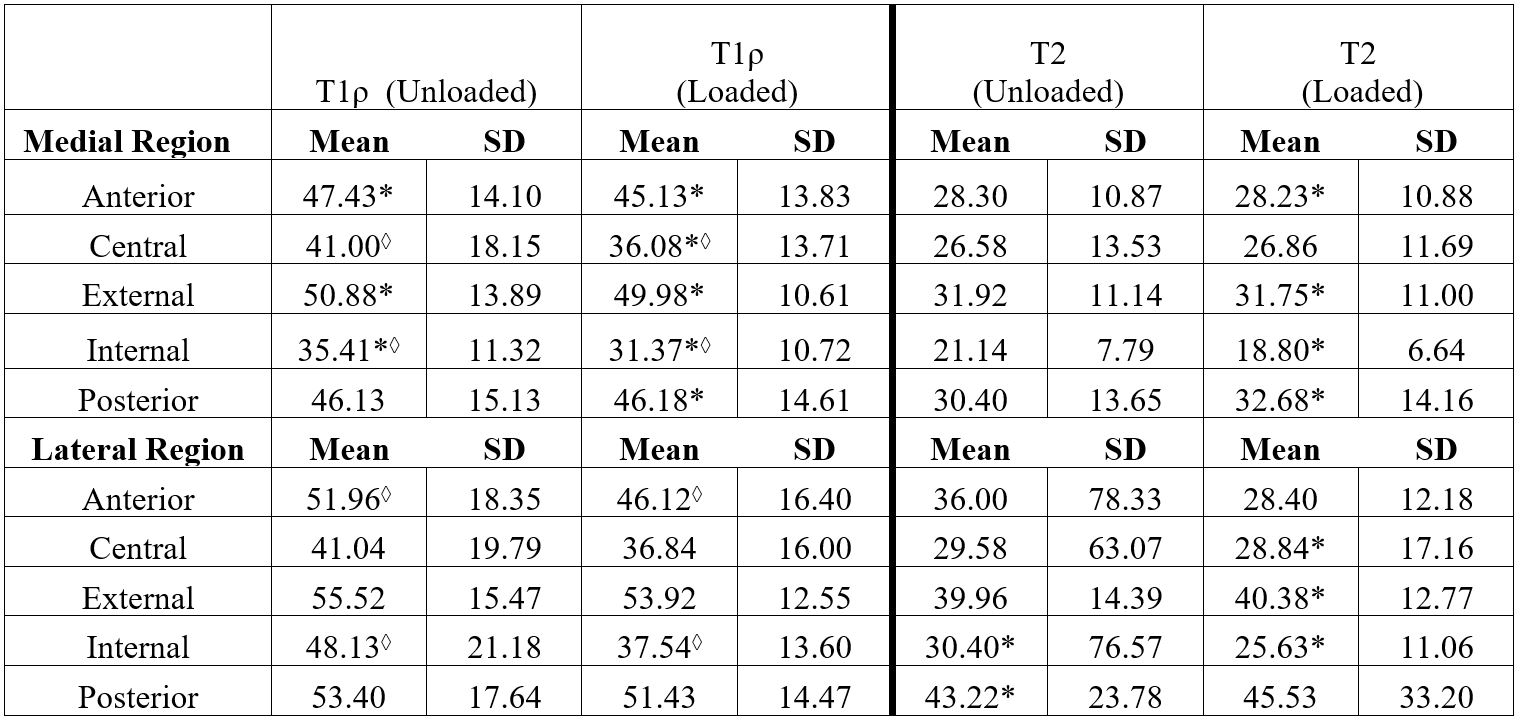
Unloaded Inter-Regional Differences of T1ρ and T2: Medial Compartment: The Internal region had significantly shorter T1ρ values as compared to the Anterior region (mean difference=12.0ms; p=0.033) and External region (mean difference=15.5ms; p=0.004). No significant differences in T2 values were found in the medial compartment. Lateral Compartment: No significant differences in T1ρ values were found between regions in the lateral compartment. However, the Posterior region had significantly longer T2 values than the Internal (mean difference=9.3ms, p=0.046; Figure 2)Loaded Inter-Regional Differences of T1ρ and T2: Medial Compartment: The Internal region had significantly shorter T1ρ values compared to the Anterior (mean difference=13.8ms, p=0.009) and Posterior regions (mean difference=14.8ms; p=0.006). In addition, the External region had significantly longer T1ρ values compared to the Central (mean difference=13.9, p=0.008) and Internal regions (mean difference=18.6ms, p=0.0004). Shorter T2 values were found in the Internal region compared to the Anterior (mean difference= 9.4, p=0.026), Posterior (mean difference=13.9ms, p=0.0008) and External regions (mean difference=13.0, p=0.002; Table 1). Lateral Compartment: The External region had significantly longer T1ρ values than the Central (mean difference=17.1ms, p=0.025) and Internal regions (mean difference=16.4, p=0.033). No significant differences in loaded T2 values were found between lateral tibial cartilage regions (Figure 2).
Unloaded-to-Loaded Intra-Regional Changes of T1ρ and T2: Medial Compartment: Significant T1ρ decreases were detected following load application within the Central region (Δ=-4.9ms; Percent change=11.8%; p=0.005) and Internal region (Δ=-4.04ms; Percent change=11.3%; p=0.021). Lateral Compartment: Significant T1ρ decreases were detected following load application within the Anterior region (Δ=-5.9ms; Percent change=11.6%; p=0.047) and Internal region (Δ=-9.82ms ; Percent change=19.6%; p=0.0008). No significant changes in unloaded-to-loaded cartilage T2 values were found within either the medial or lateral compartments (Table 1; Figure 1).
DISCUSSION:
Unloaded and loaded tibial cartilage T1ρ and T2 values were evaluated regionally. Prolongation of cartilage T2 and T1ρ values are commonly associated with disruption of collagen fibrils and proteoglycan (PG) damage, respectively. Evaluation of intra-regional cartilage changes revealed shortening of only T1ρ, and not T2, from the unloaded-to-loaded conditions. Shortening of loaded T1ρ values may be attributed to water loss from the cartilage matrix due to PG damage and attendant loss of the cartilage FCD. Though all cartilage regions did not exhibit significant changes in unloaded-to-loaded T1ρ values, previous work has demonstrated that tibial cartilage tissue and fibril strains follow the pattern of changes in FCD distribution.6 While the FCD generated by PGs control the compressive equilibrium stiffness of cartilage, the dynamic stiffness can also be influenced through generation of pre-tension in the collagen network. Application of load did not directly affect T2 values, though inter-regional variation increased from unloaded-to-loaded conditions. These findings suggest that regional variation in T2 values were impacted by a decreased FCD of cartilage that allowed water to move more freely between cartilage regions. Additionally, variation in cartilage composition, morphology, and permeability across regions results in varied regional responses to applied load12. Our results emphasize the need to incorporate a regional analysis within each compartment as local changes may be obscured if averaging values across the entire compartment13, 14.CONCLUSION:
As both the static and dynamic responses of cartilage to load are impacted by degeneration, quantification of unloaded-to-loaded T1ρ and T2 values may provide additional insight into cartilage health. Future work will evaluate unloaded-to-loaded cartilage T2* metrics to better elucidate the movement of free and bound water pools.Acknowledgements
Research reported in this abstract was supported by NIH/NIAMS under award number R01AR06663. The content is solely the responsibility of the authors and does not necessarily represent the official views of the NIH. The authors would also like to acknowledge The Russell Warren Chair in Tissue Engineering as well as the technologists and staff of the MRI department at HSS for their support with this study.
References
1. Regatte et al., 2006 J Magn Reson Imaging
2. Souza et al., 2014 OA&C
3. Li et al., 2009 Magn Reson Med
4. Li et al., 2015 OA&C
5. Schooler et al., 2014 OA&C
6. Räsänen et al., 2017 J Biomech
7. Maher et al., 2017 J Orthop Res.
8. Wang et al., 2015 J Biomech
9. Li et al., 2014 J Magn Reson Imaging
10. Koff et al., 2008 J Magn Reson Imaging
11. Wirth et al., 2008 IEEE TMI
12. Potter et al., 2012 AJSM
13. Cotofana et al., 2011 Eur Radiol
14. Argentieri et al., 2014 OA&C
Figures
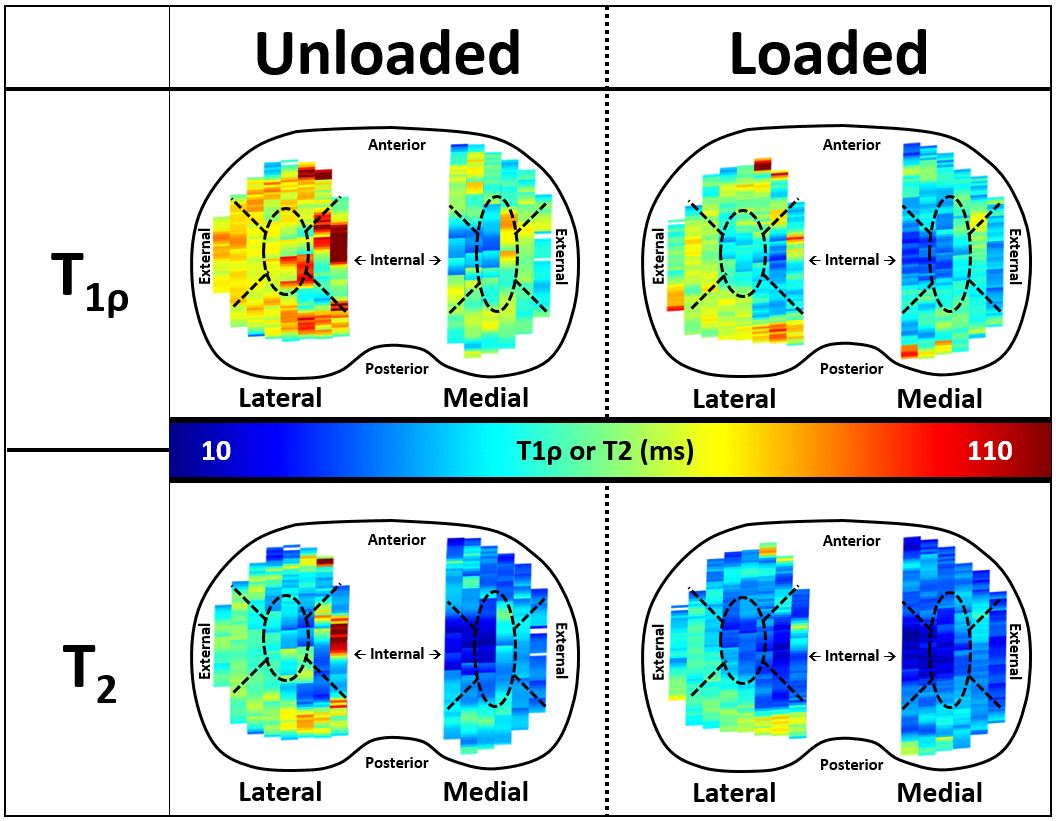
Figure 1. Medial and lateral cartilage surfaces were broken into 5 sub-regions: Anterior, Central, External, Internal and Posterior. Representative maps demonstrate the significant reduction of T1ρ with the application of load. T2 values exhibited no significant changes in response to load.
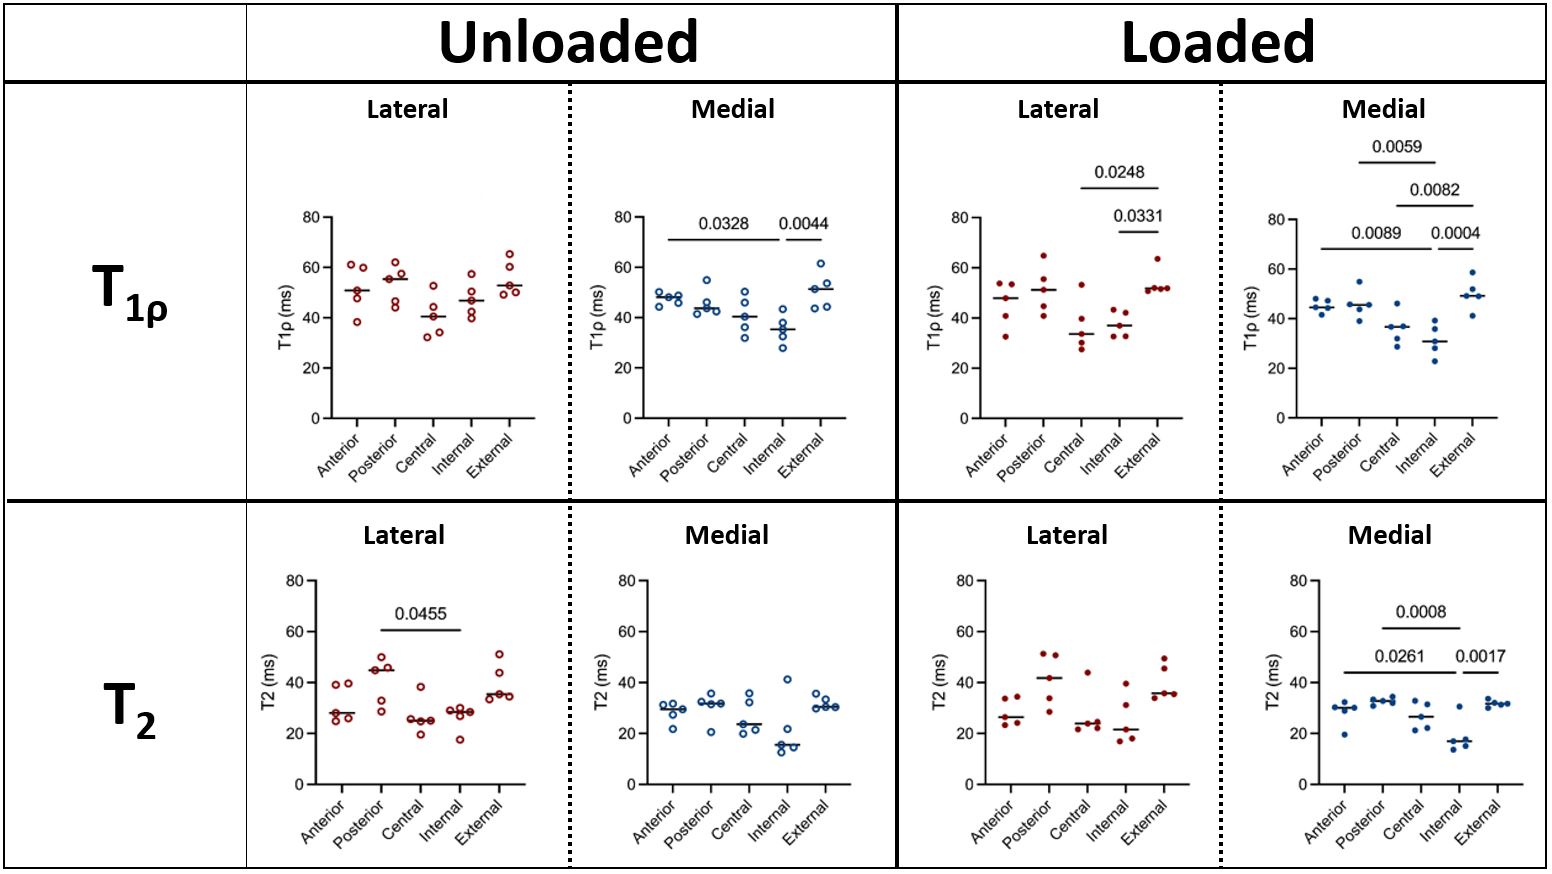
Figure 2: Inter-regional comparison of unloaded and loaded of T1ρ and T2 values within the medial and lateral compartments.
*= Significant inter-regional variation in unloaded and loaded conditions respectively (p<0.05)
◊ = Significant intra-regional changes from unloaded-to-loaded conditions (p<0.05)