2300
Early Quantitative Diagnosis of Articular Cartilage Degeneration Using 3D Ultrashort Echo Time Cones Adiabatic T1ρ ( UTE Cones AdiabT1ρ) Imaging1Radiology, Guangzhou First People’s Hospital, School of Medicine, South China University of Technology, Guangzhou, China, 2Radiology, University of California San Diego, San Diego, CA, United States, 3Orthopaedic Surgery, University of California San Diego, San Diego, CA, United States, 4Imaging Department, The First Affiliated Hospital of Guangdong Pharmaceutical University, Guangzhou, China, 5Radiology Service, Veterans Affairs San Diego Healthcare System, San Diego, CA, United States
Synopsis
This study aims to evaluate cartilage degeneration using 3D UTE-Cones-AdiabT1r imaging at 3T. In total 66 human subjects were recruited. KL and WORMS were evaluated by two MSK radiologists. The performance in evaluating cartilage degeneration was assessed via Spearman’s correlation coefficient and the area under the curve (AUC) calculated according to the receiver-operating characteristic (ROC) curve. Higher UTE-Cones-AdiabT1r values were observed in larger and deeper cartilage lesions. The diagnostic threshold of UTE-Cones-AdiabT1r for mild cartilage degeneration was 39.4 ms with 80.8% sensitivity and 63.5% specificity. The AUC value for mild cartilage degeneration (WORMS=1) was 0.8 according to the ROC curves.
Introduction
Spin lattice relaxation in the rotating frame (T1ρ) has been employed to evaluate osteoarthritis (OA) with elevated T1ρ in OA patients over healthy subjects (1,2). A major confounding factor is the magic angle effect with ~100% increase when fibers are reoriented from 0° to ~55° to B0 (3). This is a major limitation given that early OA increases T1ρ by only 10-30% (4). Meanwhile, OA is recognized as a whole-organ disease (5). It is essential to image all major components in the joint for more complete assessment of OA. Unfortunately, many joint tissues, including the deeper cartilage, menisci, ligaments, tendons, and bone have short T2 values, largely “invisible” to clinical MRI sequences (6). Recent studies suggest that Adiabatic T1ρ (AdiabT1ρ) is sensitive to cartilage degradation (7-9), while insensitive to the magic angle effect (10). The 3D ultrashort echo time Cones (UTE-Cones) sequence allows fast volumetric imaging of both short- and long-T2 tissues in the joint (11,12). The combination of 3D UTE-Cones sequence with AdiabT1ρ preparation (UTE-Cones-AdiabT1ρ) enables magic angle-insensitive imaging of various joint tissues (13-15). This study aimed to further evaluate the feasibility and efficacy of 3D UTE-Cones-AdiabT1ρ imaging for in vivo assessment of whole knee cartilage in volunteers and patients with varying degrees of OA.Method
This study was approved by our Institutional Review Board, with 66 human subjects (23-88years) including 20 volunteers and 46 OA patients. Each knee was scanned using the 3D UTE-Cones-AdiabT1ρ sequence on a 3T MR750 scanner. T1ρ contrast was generated using non-selective adiabatic inversion recovery pulses (duration=6ms; bandwidth=1.643kHz; maximum B1=17µT) (13). Multiple spiral spokes (Nsp) were acquired after each AdiabT1ρ preparation to speed up data acquisition, with the following parameters: TR=500ms; FA=10°; matrix=256×256×36; Nsp=25; NIR=0,2,4,6,8,12, and 16, corresponding to spin-locking times (TSLs) of 0,12,24,36,48,72, and 96 ms, respectively; scan time=2.5min for each dataset. Radiography and sagittal fat-suppressed T2-FSE and PD images were obtained for KL grade and WORMS (16). Elastix-based motion registration was applied to all datasets (12). UTE-Cones-AdiabT1ρ of whole knee cartilage was quantified using a single-component fitting model (13). Each knee was independently scored by two musculoskeletal radiologists with 23 and 19 years of experience, respectively, according to KL grade and WORMS. All subjects were classified into three groups according to KL grade: normal controls (KL=0), doubtful-minimal OA (KL≤2), and moderate-severe OA (KL≥3) (17). The cartilage subregions were scored slice-by-slice according to WORMS and further divided into two respective subcategories according to the extent and depth of cartilage lesions (16,17). The extent groups included WORMS=0 (controls); WORMS=1,2, and 2.5 (regional lesions); and WORMS=3,4, and 5 (diffuse lesions). The depth groups included WORMS=0 (controls); WORMS=1,2,3, and 4 (partial thickness lesions); and WORMS=2.5 and 5 (full-thickness lesions) (17,18). Intraclass correlation efficient (ICC) was used to evaluate consistency between radiologists. Correlations between UTE-Cones-AdiabT1ρ and KL grade and WORMS were evaluated using Spearman’s correlation coefficient. Differences in UTE-Cones-AdiabT1ρ among different groups based on KL grade and WORMS were assessed using ANOVA. Receiver operating characteristic (ROC) and area under the curve (AUC) were used to evaluate the diagnostic efficacy in detecting doubtful-minimal OA (KL=1-2) and mild cartilage degeneration (WORMS=1). P-values< 0.05 were considered statistically significant.Results
. A total of 713 cartilage subregions from 66 human subjects were analyzed. Excellent inter-observer agreement (ICC=0.938-0.966;P<0.05) was achieved between the two radiologists for KL grading, WORMS grading, and quantitative analyses. Figure 1 shows the boxplot of UTE-Cones-AdiabT1ρ values in different WORMS groups. Statistically significant differences were observed in UTE-Cones-AdiabT1ρ values between WORMS extent groups and depth groups.The mean UTE-Cones-AdiabT1ρ values of cartilage were 37.3±5.45 ms for normal controls, 39.1±6.46ms for doubtful-minimal OA, and 39.0±6.42ms for moderate-severe OA. Table 1 shows UTE-Cones-AdiabT1ρ in different WORMS groups. Higher UTE-Cones-AdiabT1ρ values were observed in both larger and deeper lesions, with 44.1±5.6ms for cartilage with diffuse lesions and 46.8±6.5ms for cartilage with full-thickness lesions compared to 35.5±4.9ms for normal cartilage.
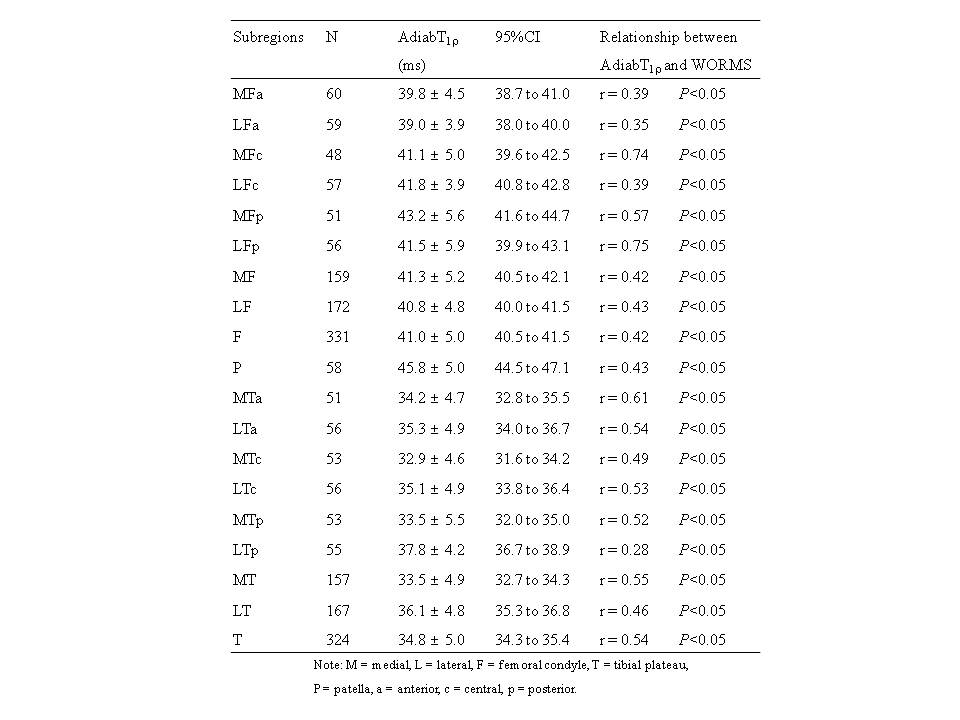
Subregional analyses showed that the correlation between UTE-Cones-AdiabT1ρ and WORMS varied with the location of cartilage. Stronger correlations (r=0.61-0.75;P<0.05) of UTE-Cones-AdiabT1ρ with WORMS were observed in the central subregions of medial femoral cartilage, the posterior subregions of lateral femoral cartilage, and the anterior subregions of medial tibial cartilage, but lower correlations (r=0.28-0.39;P<0.05) in other subregions such as the posterior subregions of lateral tibial cartilage (Table 2).
UTE-Cones-AdiabT1ρ could distinguish doubtful-minimal OA (KL=1-2) from normal controls (KL=0), and mild cartilage degeneration (WORMS=1) from normal cartilage (WORMS=0) (Figure 2). The AUC values of UTE-Cones-AdiabT1ρ were 0.6 (95%CI=0.6-0.7) for doubtful-minimal OA (KL=1-2) and 0.8 (95%CI=0.7-0.8) for mild cartilage degeneration (WORMS=1). The diagnostic threshold value of UTE-Cones-AdiabT1ρ for doubtful-minimal OA was 38.5ms with sensitivity=64.5% and specificity=54.5%, and the diagnostic threshold value of UTE-Cones-AdiabT1ρ for mild cartilage degeneration was 39.4ms with higher sensitivity=80.8% and specificity=63.5%.
Conclusion
The 3D UTE-Cones-AdiabT1ρ biomarker can distinguish mild cartilage degeneration from normal cartilage, with a higher UTE-Cones-AdiabT1ρ value for more degenerated cartilage. The 3D UTE-Cones-AdiabT1ρ sequence may significantly improve the robustness in quantitative systematic evaluation of joint degeneration.Acknowledgements
The authors are thankful for support from NIH (R01AR075825, R01AR062581, and R01AR068987), Veterans Affairs (I01RX002604 and I01CX001388), and GE Healthcare.
References
1. Regatte RR, Akella SVS, Wheaton AJ, Lech G, Borthakur A, Kneeland JB, et al. 3D-T1ρ-relaxation mapping of articular cartilage: in vivo assessment of early degenerative changes in symptomatic osteoarthritic subjects. Acad Radiol 2004; 11:741–749.
2. Li X, Benjamin Ma C, Link TM, et al. In vivo T(1rho) and T(2) mapping of articular cartilage in osteoarthritis of the knee using 3T MRI. Osteoarthr Cartilage. 2007; 15:789–797.
3. Shao H, Pauli C, Li S, Ma Y, Tadros AS, Kavanaugh A, et al. Magic angle effect plays a major role in both T1rho and T2 relaxation in articular cartilage. Osteoarthritis Cartilage 2017; 25:2022-2030.
4. Mosher TJ, Smith H, Dardzinski BJ, Schmithorst VJ, Smith MB. MR imaging and T2 mapping of femoral cartilage: in vivo determination of the magic angle effect. AJR 2001; 177:665-669.
5. Brandt KD, Radin EL, Dieppe PA, Putte L. Yet more evidence that osteoarthritis is not a cartilage disease (Editorial). Ann Rheum Dis 2006; 65:1261-1264.
6. Chang EY, Du J, Chung CB. UTE imaging in the musculoskeletal system. J Magn Reson Imaging 2015; 41(4):870-883.
7. Rautiainen J, Nissi MJ, Liimatainen T, Herzog W, Korhonen RK, Nieminen MT. Adiabatic rotating frame relaxation of MRI reveals early cartilage degeneration in a rabbit model of anterior cruciate ligament transection. Osteoarthritis and Cartilage 2014; 22:1444-1452.
8. Rautiainen J, Nissi MJ, Salo E, Tiitu V, et al. Multiparametric MRI assessment of human articular cartilage degeneration: correlation with quantitative histology and mechanical properties. Magn Reason Med 2015; 74:249-259.
9. Casula V, Nissi MJ, Podlipska J, et al. Elevated adiabatic T1ρ and T2ρ in articular cartilage are associated with cartilage and bone lesions in early osteoarthritis: a preliminary study. J Magn Reson Imaging 2017; 46:678-689.
10. Hänninen N, Rautiainen J, Rieppo L, Saarakkala S, Nissi MJ. Orientation anisotropy of quantitative MRI relaxation parameters in ordered tissue. Sci Rep 2017; 7:9606.
11. Ma YJ, Carl M, Shao H, Tadros AS, Chang EY, Du J. Three‐dimensional ultrashort echo time cones T1ρ (3D UTE‐cones‐T1ρ ) imaging. NMR Biomed 2017; 30:3709.
12. Wu M, Zhao W, Wan L, Kakos L, Li L, Jerban S, Jang H, Chang EY, Du J, Ma YJ. Quantitative three-dimensional ultrashort echo time cones imaging of the knee joint with motion correction. NMR in Biomedicine 2020; 33(1): e4214.
13. Ma Y, Carl M, Searleman A, Lu X, Chang EY, Du J. Three dimensional adiabatic T1ρ prepared ultrashort echo time Cones (3D AdiabT1ρ UTE-Cones) sequence for whole knee imaging. Magn Reson Med 2018; 80(4):1429-1439.
14. Wu M, Ma Y, Wan L, Jerban S, Jang H, Chang EY, Du J. Magic angle effect on adiabatic T1ρ imaging of the Achilles tendon using 3D ultrashort echo time cones trajectory. NMR in Biomedicine 2020; 33(8): e4322.
15. Wu M, Ma Y, Kasibhatla A, Chen M, Jang H, Jerban S, Chang EY, Du J. Convincing Evidence for Magic Angle Less-Sensitive Quantitative T1ρ Imaging of Articular Cartilage Using the 3D Ultrashort Echo Time Cones Adiabatic T1ρ (3D UTE Cones-AdiabT1ρ) Sequence. Magn Reson Med 2020; 84(5): 2551-2560.
16. Peterfy CG, Guermazi A, Zaim S, et al. Whole-Organ Magnetic Resonance Imaging Score (WORMS) of the knee in osteoarthritis. Osteoarthritis Cartilage 2004; 12:177-190.
17. Wang L, Chang G, Xu J, et al. T1rho MRI of menisci and cartilage in patients with osteoarthritis at 3T. Eur J Radiol 2012; 81: 2329-2336.
18. Guermazi A, Eckstein F, Hayashi D, et al. Baseline radiographic osteoarthritis and semi-quantitatively assessed meniscal damage and extrusion and cartilage damage on MRI is related to quantitatively defined cartilage thickness loss in knee osteoarthritis: The Multicenter Osteoarthritis Study. Osteoarthritis Cartilage 2015; 23:2191-2198.
Figures
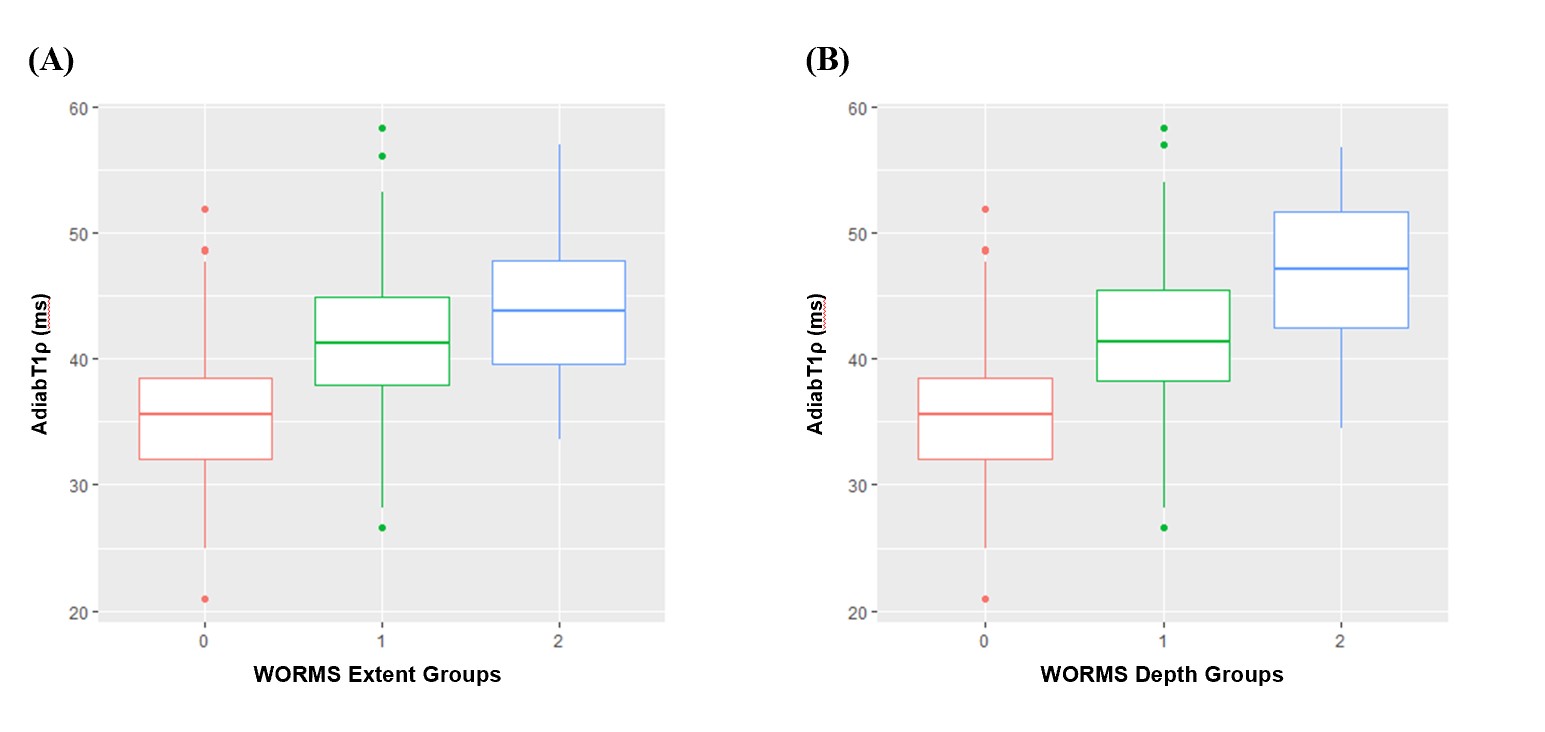
Figure 1. Boxplot of UTE-Cones-AdiabT1r values in different WORMS extent groups (A) and WORMS depth groups (B).
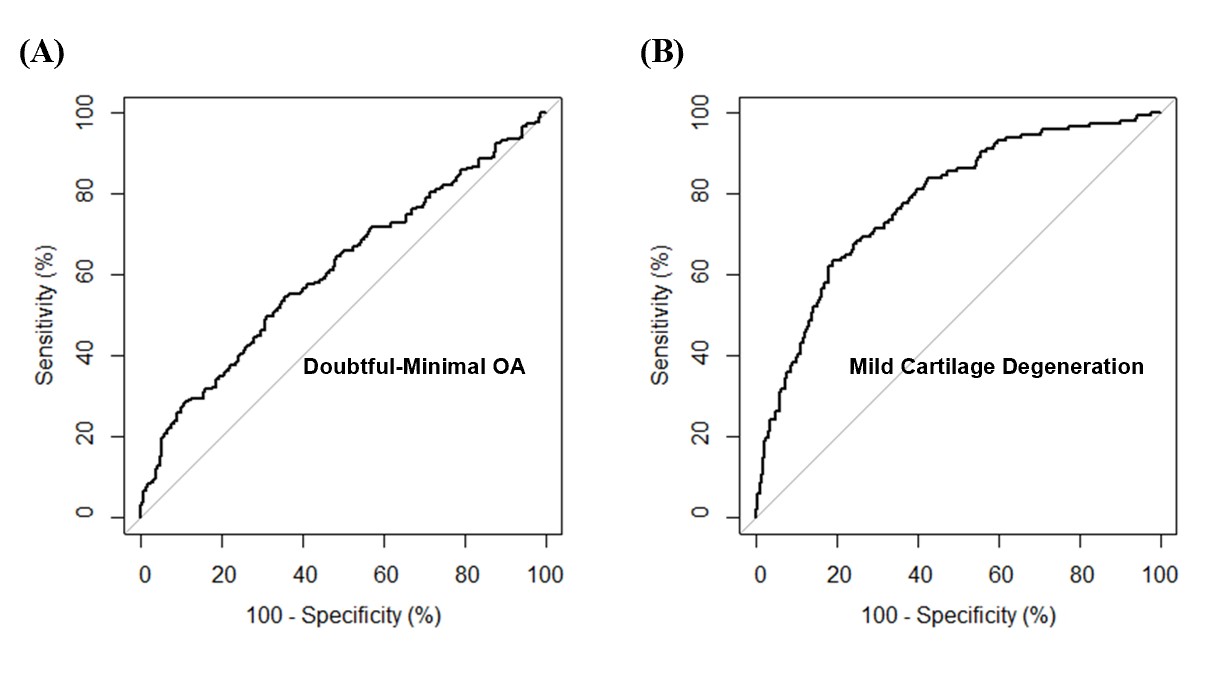
Figure 2. (A) and (B) show ROC curves of AdiabT1r for the diagnosis of doubtful-minimal OA (KL=1-2) and mild cartilage degeneration (WORMS=1). The AUCs of AdiabT1r for doubtful-minimal OA and mild cartilage degeneration are 0.6 and 0.8. The corresponding cutoff points are AdiabT1r≥38.5 ms for doubtful-minimal OA and AdiabT1r≥39.4 ms for mild cartilage degeneration.
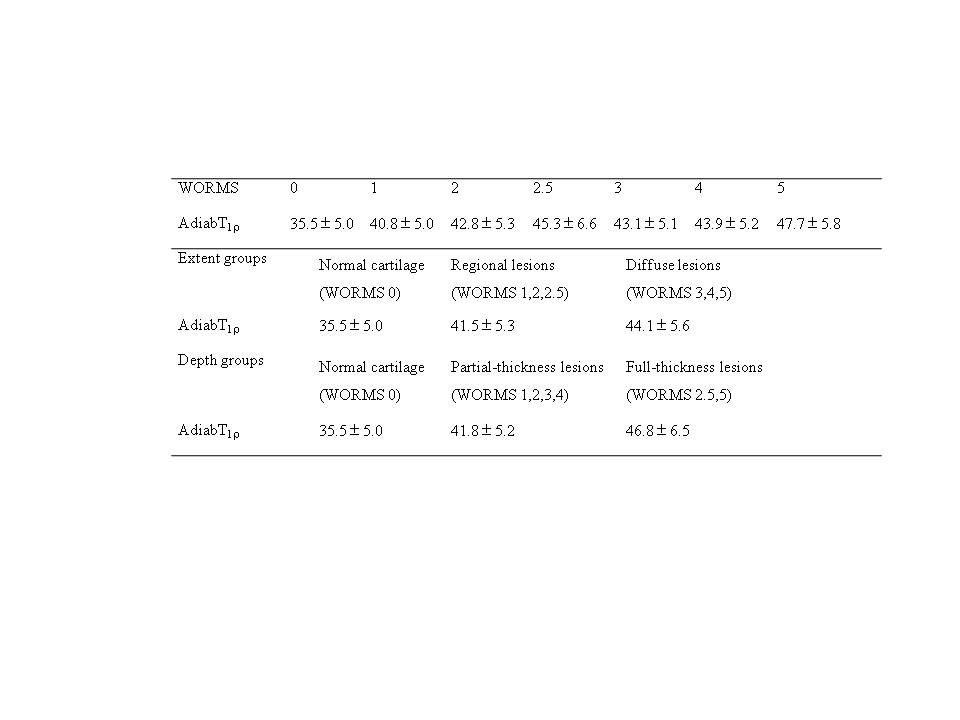
Table 1. Mean UTE-Cones-AdiabT1r (ms) in different WORMS groups