2298
Articular Cartilage T2 Relaxation Time Decreases in Regions of Loaded Contact in Cadaver Knees1Department of Mechanical Engineering, University of Saskatchewan, Saskatoon, SK, Canada, 2Department of Radiology, Stanford University, Stanford, CA, United States, 3Department of Biomedical Engineering, University of Saskatchewan, Saskatoon, SK, Canada
Synopsis
The aim of this work was to identify focal changes in T2 relaxation times inside and outside regions of tibiofemoral contact in loaded cadaver knee articular cartilage. We used a cluster analysis approach to identify focal regions of change in T2 relaxation time. We found clusters of increased and decreased T2 relaxation time when the cartilage was loaded; the majority of the clusters of decreased T2 relaxation time were observed within the tibial and femoral cartilage contact area.
Introduction
Articular cartilage plays a fundamental role in load transmission through the knee joint during activities of daily living and yet it is most often studied in the relaxed, unloaded state. T2 relaxation time mapping is a particularly useful metric to study articular cartilage because it is associated with collagen organization and water content2,3, both of which contribute to the load carrying characteristics of the tissue. While most quantitative MRI studies acquire data in the unloaded knee, it has been shown that T2 relaxation times decrease when the knee is loaded4. Whether this is a global or focal phenomenon has not been ascertained. Therefore, the aim of this work was to identify focal changes in T2 relaxation times inside and outside regions of tibiofemoral contact in loaded cadaver knee articular cartilage.Methods
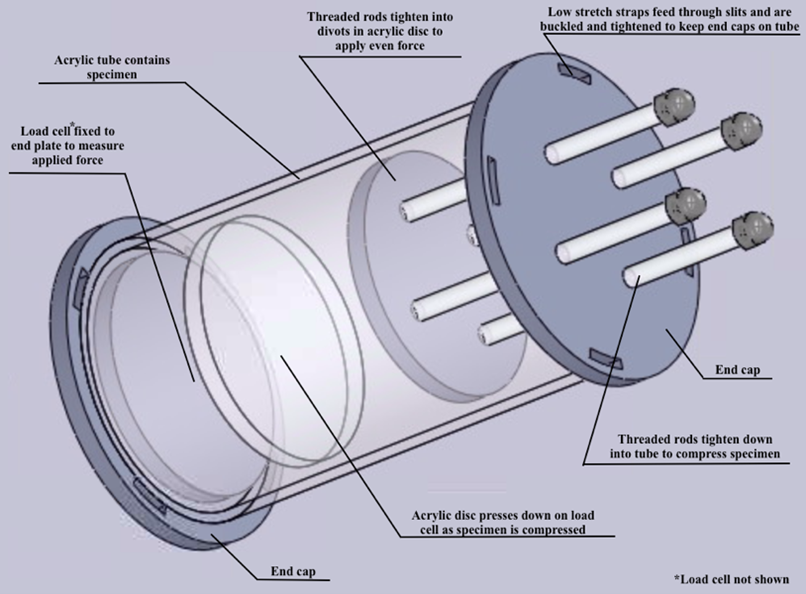
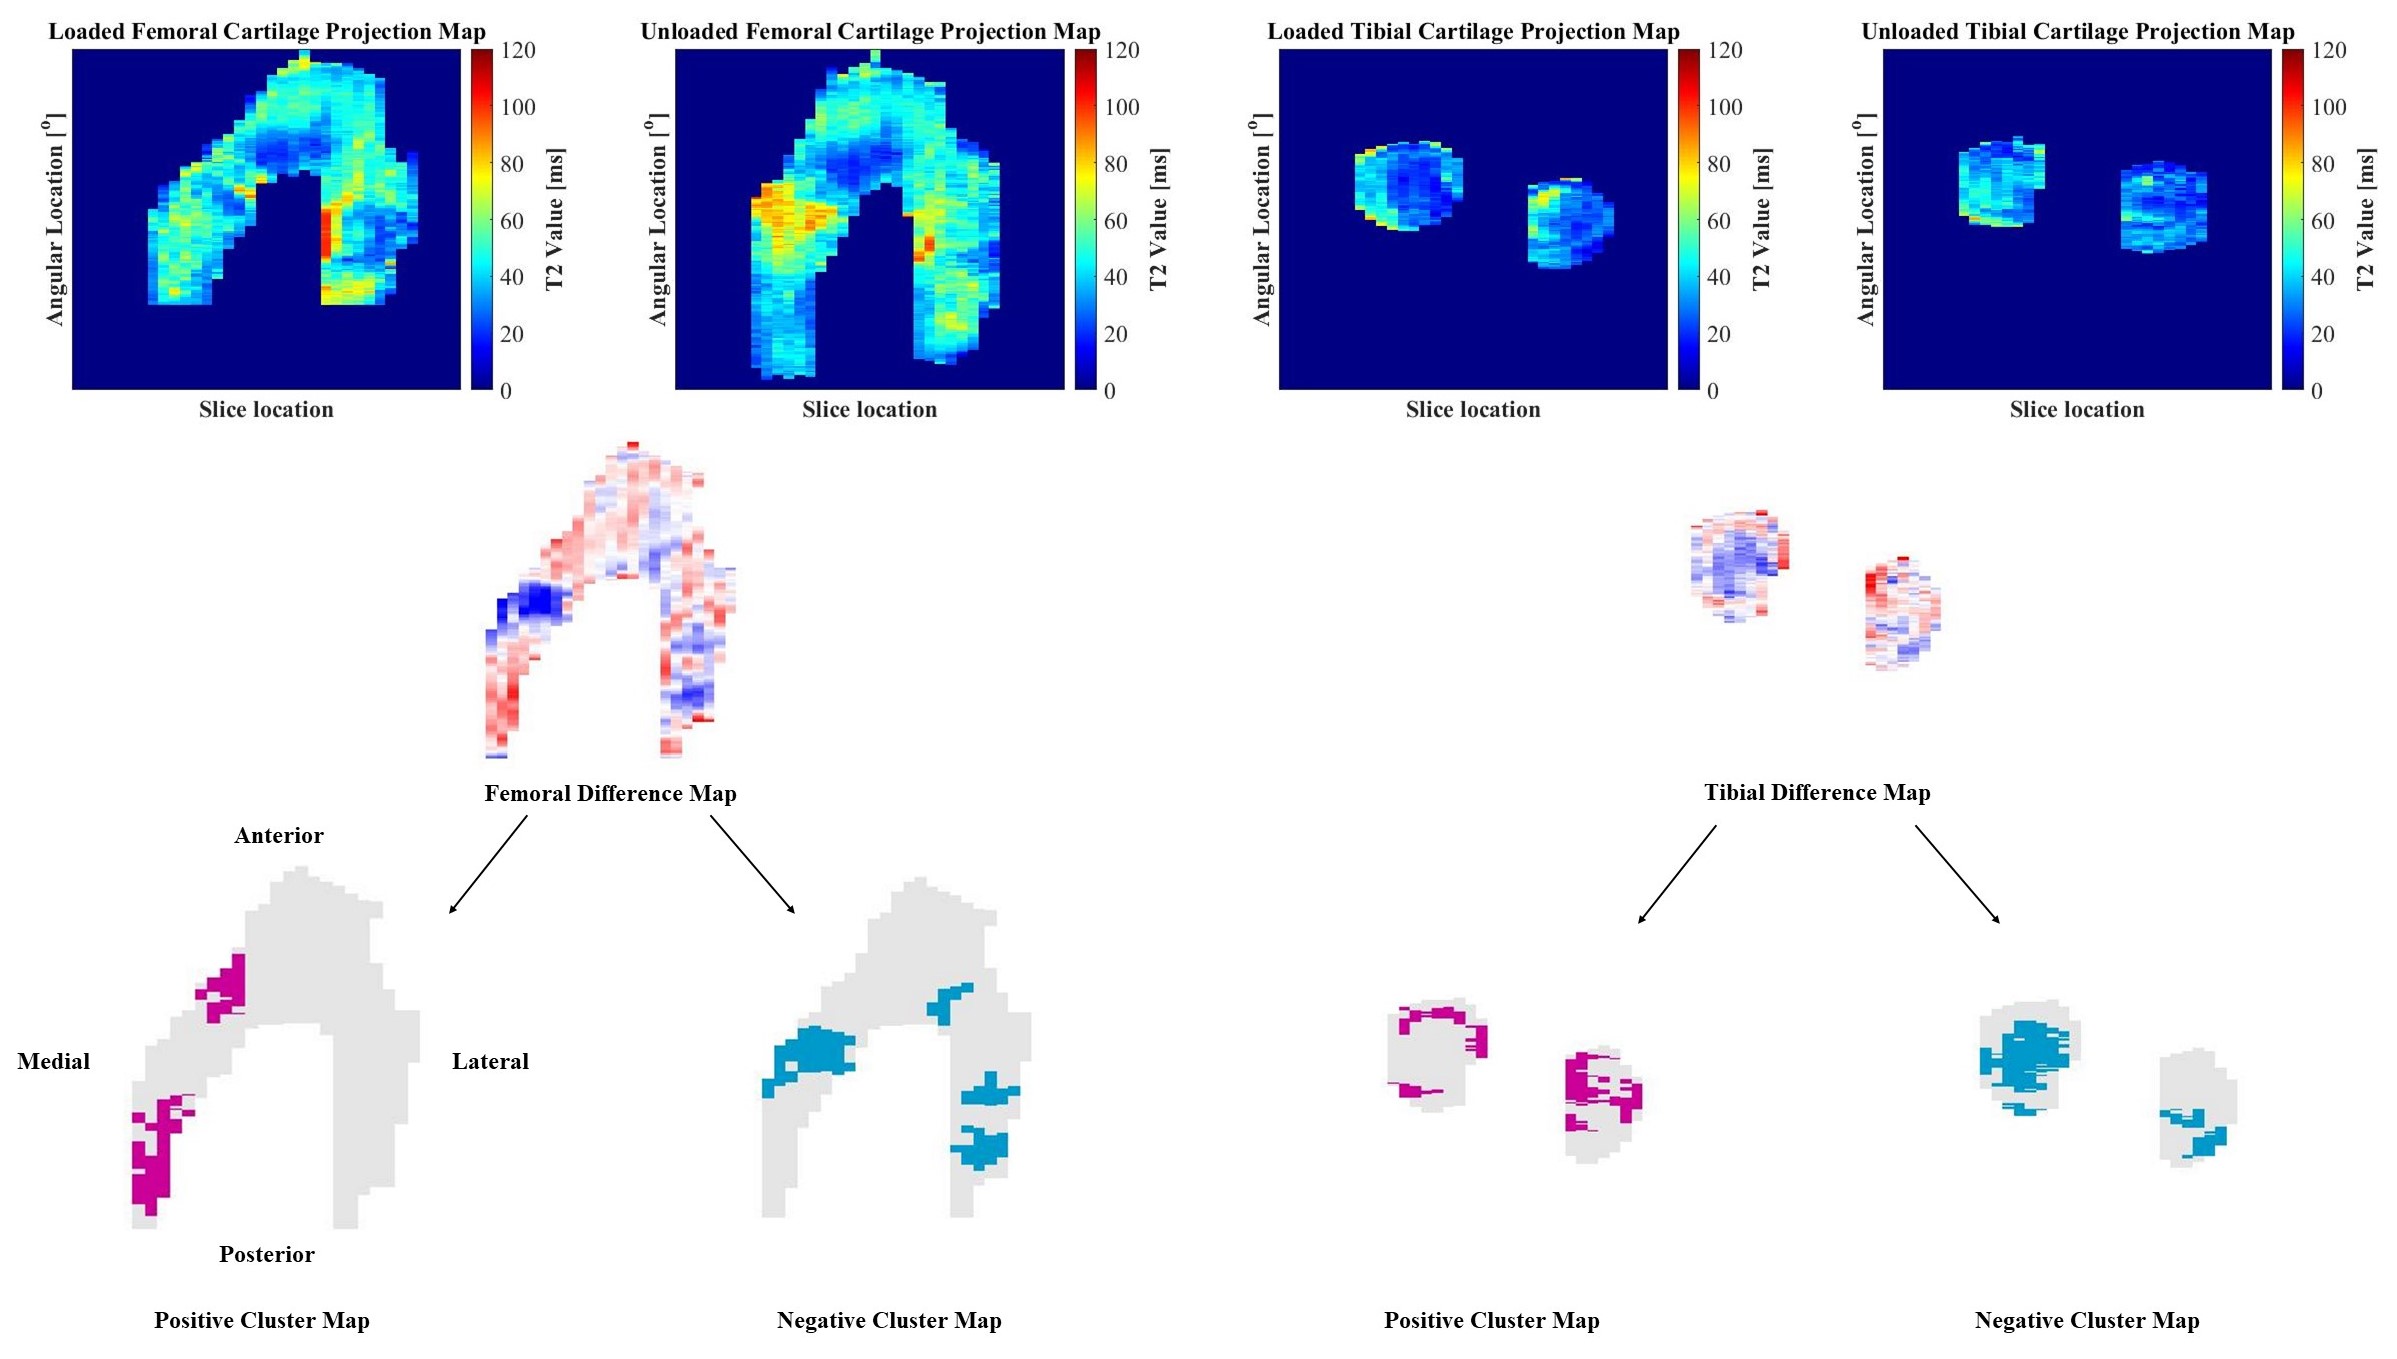
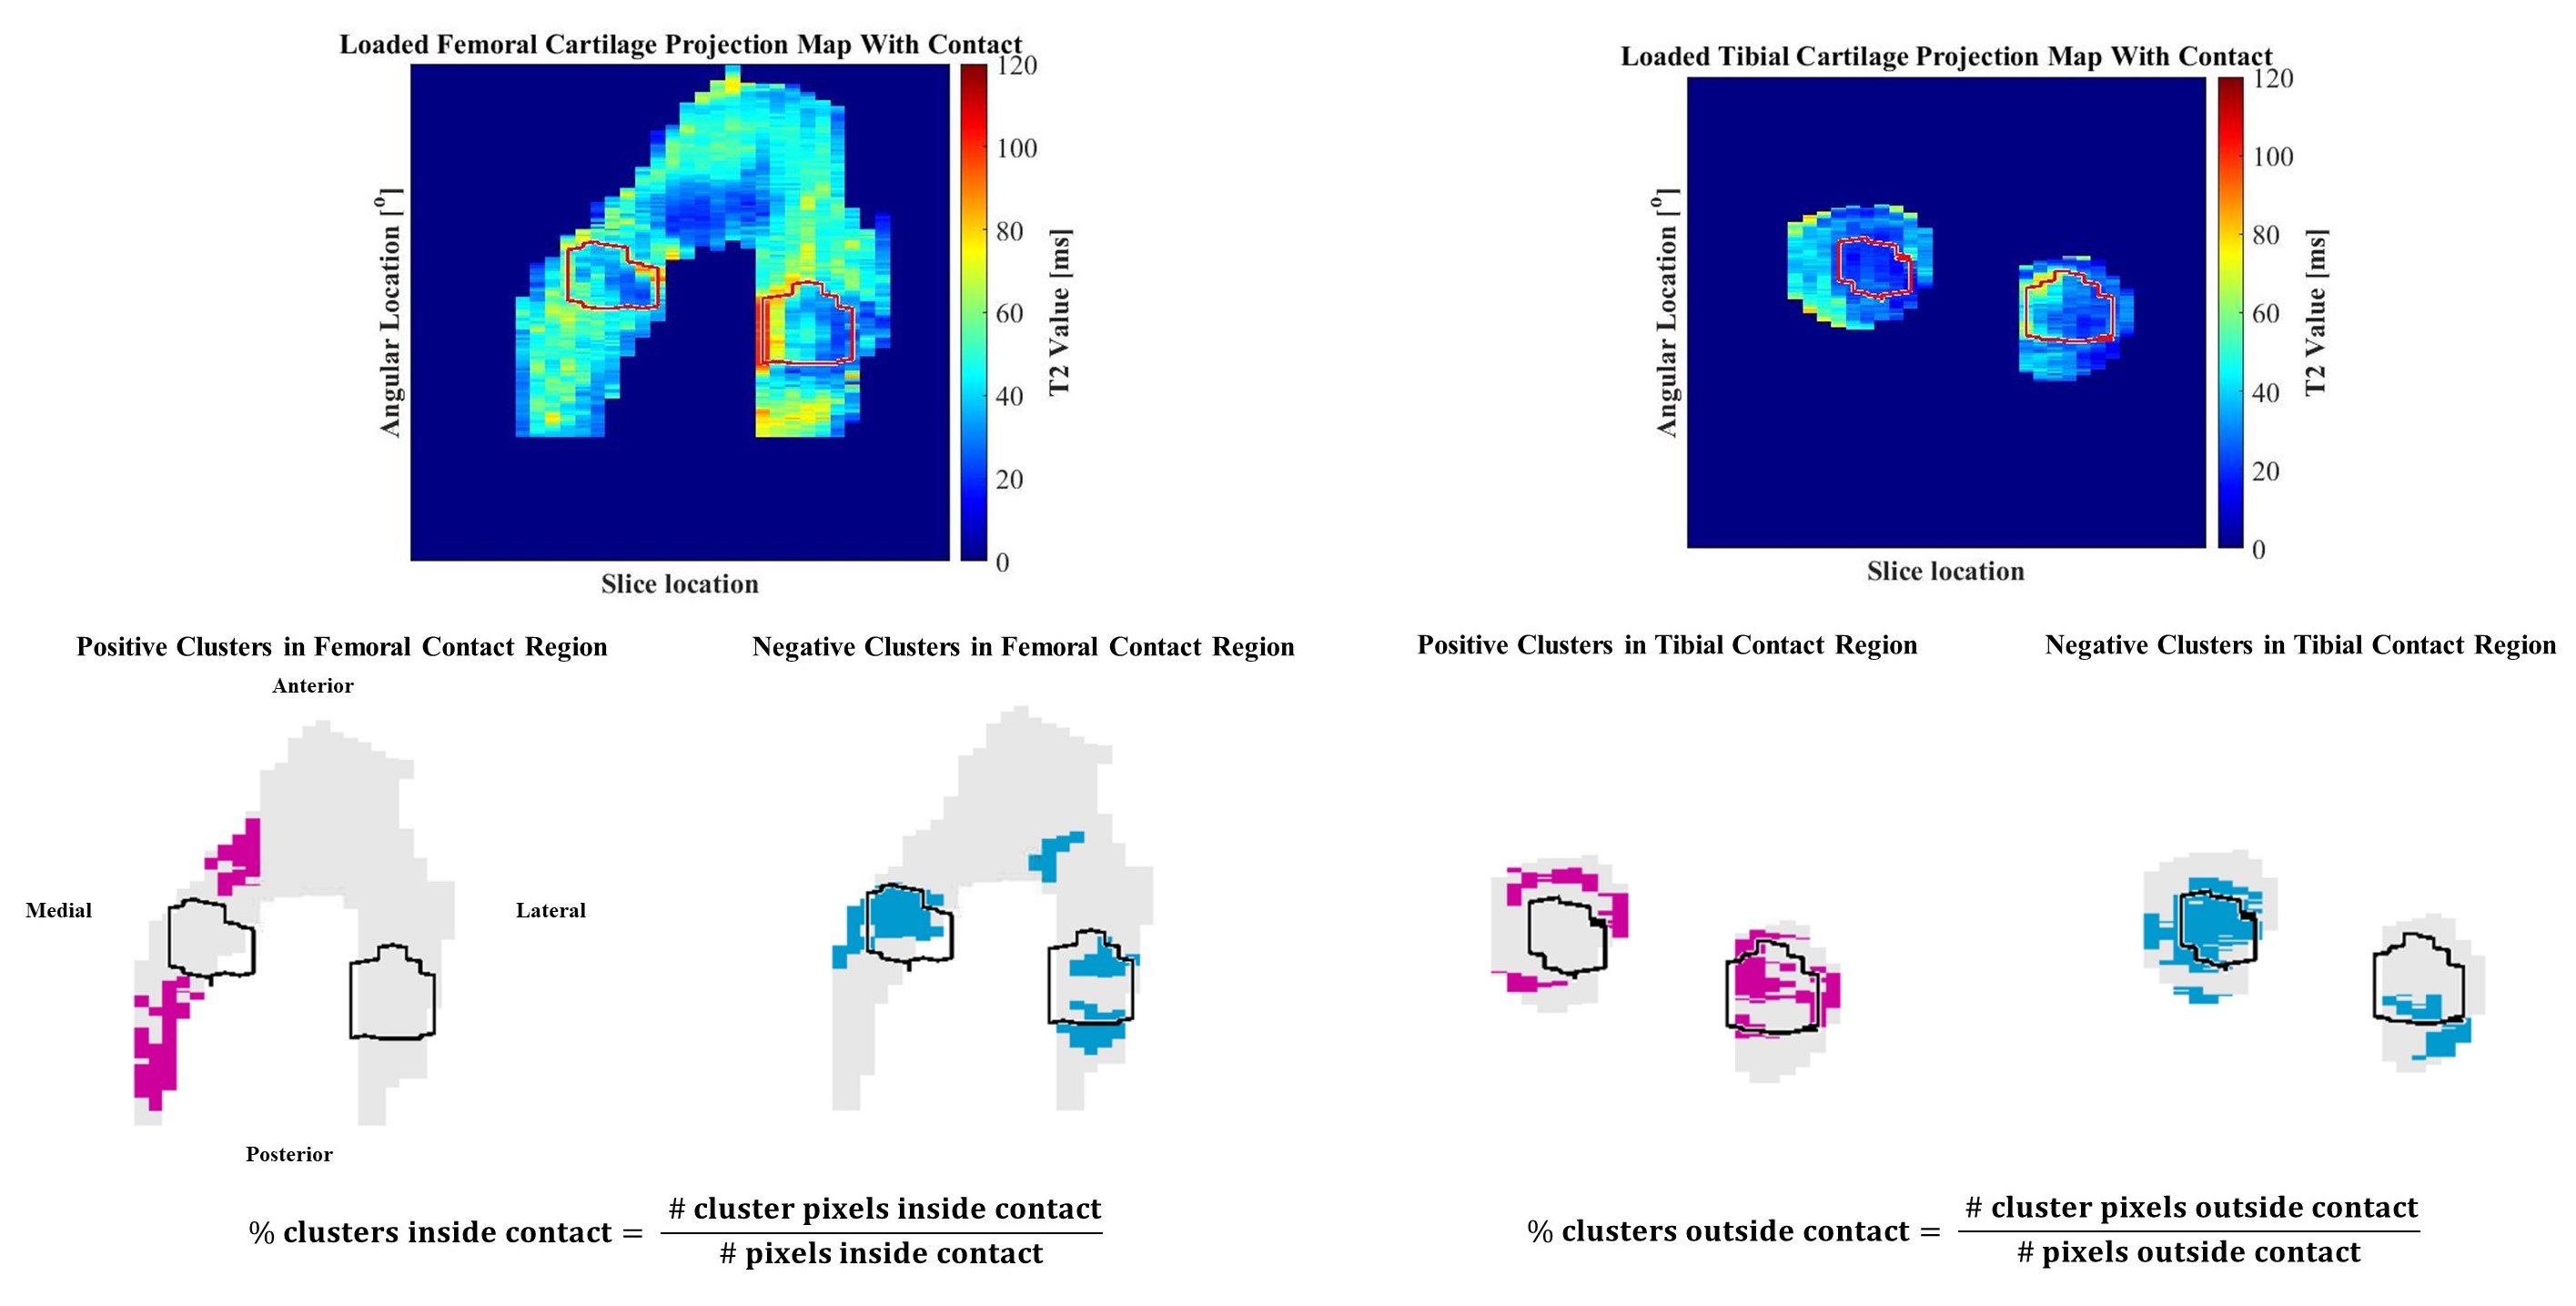
Six cadaver knee specimens (70.3 +/- 9.3 years; no history of injury or surgery; no full thickness cartilage defects) were scanned using an in-house quantitative double-echo in steady-state (qDESS) sequence at 3T (MAGNETOM Skyra, Siemens Healthineers, Erlangen, Germany) 5. Imaging parameters include: TR=20.07 ms, TE=4.19 and 35.95 ms, flip angle 25°, matrix size 256 x 256, field of view 160 mm, slice thickness 3mm. Images were first acquired unloaded and then the knees were loaded in displacement control to approximately 800N using a custom, MRI-safe loading apparatus (Figure 1). There was a 110-minute delay between load application and image acquisition to account for cartilage stress relaxation. Femoral and tibial cartilage, and the region of tibiofemoral contact was manually segmented (Analyze 14.0, AnalyzeDirect, USA) and T2 relaxation time maps were generated using an analytic approach which estimates T2 from qDESS images6. T2 relaxation time of the femoral and tibial cartilage plates were projected onto the bone-cartilage surfaces using an established cylinder-fitting approach7 and projection lines normal to the tibial surface, respectively. Unloaded projection maps were registered to the loaded ones using an affine image registration (Elastix8,9 toolbox for MATLAB). The unloaded projection maps were subtracted from the loaded maps to create difference maps, and clusters of increased (positive) and decreased (negative) T2 relaxation time were identified7,10. A cluster was defined as groups of contiguous pixels for which 1) T2 relaxation time was greater than two times the standard deviation of the difference between the unloaded and loaded maps, and 2) area was greater than 1% of the total projection map area. The percentage of the cartilage plate covered by positive (+CL%) or negative clusters (-CL%) was calculated (Figure 2). The loaded tibiofemoral contact area was then projected onto the femoral and tibial difference maps to identify the clusters inside and outside of the contact area. The percentage of the area inside and outside of the contact boundary occupied by positive or negative clusters was calculated. A one-sample Wilcoxon Signed Rank test was used to identify the presence of significant clusters (+CL% and -CL%) in the femoral and tibial cartilage plates (SPSS, IBM, USA). A Wilcoxon Matched Pair test was used to identify differences in +CL% and -CL% inside and outside of the contact region (SPSS, IBM, USA).Results
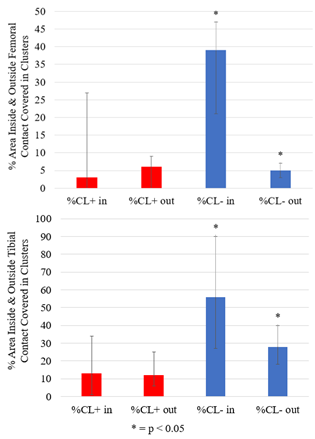
Clusters of increased and decreased T2 relaxation time were observed in the femoral and tibial cartilage when load was applied (Figure 3). Negative tibial cartilage clusters, indicating a decrease in T2 relaxation time, were most common, covering 52% of the area (range: 30-55%, p = 0.027), followed by positive tibial clusters (15%, range: 10-28%, p = 0.028), negative femoral clusters (12%, range: 8-15%, p = 0.028), and positive femoral clusters (6%, range: 0-15%, p = 0.043). Clusters of decreased T2 relaxation time appeared predominantly inside of the femoral and tibial cartilage contact regions (Figure 4). The median percentage of loaded femoral and tibial cartilage contact area covered in negative clusters was 39% (Range: 21-46%, p = 0.028) and 56% (Range: 41-90%, p = 0.046), respectively (Figure 5).Discussion
The negative clusters, which indicate a decrease in T2 relaxation time with load, covered more area than the positive clusters. This finding aligns with previous results that found a net decrease in T2 relaxation time with load in the superficial cartilage layer5. The negative clusters appear predominantly inside the region of tibiofemoral contact of both the tibial and femoral cadaver cartilage. This may reflect greater changes in water content and collagen distribution in the direct area of load application, as opposed to the adjacent tissue. Positive clusters were less common but may reflect an increase in water resulting from the redistribution of water within the tissue when the load is applied. The presence of both positive and negative clusters may represent changes in cartilage collagen architecture and water distribution when load is applied.Conclusion
Both positive and negative focal changes in T2 relaxation time are present in loaded cartilage, and majority of negative focal changes were observed within the tibial and femoral cartilage contact area.Acknowledgements
Funding provided by Siemens Healthcare (McWalter EJ, Cui L), GE (Black MS), NSERC Discovery Grant, Mitacs, and The Arthritis SocietyReferences
1. Dunn TC, Lu Y, Jin H, Ries MD, Majumdar S. T2 relaxation time of cartilage at MR imaging: comparison with severity of knee osteoarthritis. Radiology. 2004; 232(2):592-598.
2. Raya JG, Ferizi U, Ruiz A, Abramson SB, Bencardino J, Krasnokutsky Samuels S. Changes in collagen and proteoglycan in cartilage with OA severity. ISMRM. 2017; 5087.
3. Nieminen MT, Rieppo J, Töyräs J, Hakumäki JM, Silvennoinen J, Hyttinen MM, Helminen HJ, Jurvelin JS. T2 relaxation reveals spatial collagen architecture in articular cartilage: a comparative quantitative MRI and polarized light microscopic study. Magn Reson Med. 2001; 46(3):487-493.
4. Subburaj K, Souza RB, Stehling C, Wyman BT, Le Graverand-Gastineau MP, Link TM, Li X, Majumdar S. Association of MR relaxation and cartilage deformation in knee osteoarthritis. J Orthop Res. 2012; 30(6):919-926.
5. Staroswiecki E, Granlund KL, Alley MT, Gold GE, Hargreaves BA. Simultaneous estimation of T(2) and apparent diffusion coefficient in human articular cartilage in vivo with a modified three-dimensional double echo steady state (DESS) sequence at 3 T. Magn Reson Med. 2012; 67(4):1086-1096.
6. Sveinsson B, Chaudhari AS, Gold GE, Hargreaves BA. A simple analytic method for estimating T2 in the knee from DESS. Magn Reson Imaging. 2017;38:63-70.
7. Monu UD, Jordan CD, Samuelson BL, Hargreaves BA, Gold GE, McWalter EJ. Cluster analysis of quantitative MRI T2 and T1ρ relaxation times of cartilage identifies differences between healthy and ACL-injured individuals at 3T. Osteoarthr Cartil. 2017;25(4):513-520.
8. Klein S, Staring M, Murphy K, Viergever MA, Pluim JPW. Elastix: a toolbox for intensity based medical image registration. IEEE Transactions on Medical Imaging. 2010; 29(1): 196-205.
9. Shamonin DP, Bron EE, Lelieveldt BPF, Smits M, Klein S, Staring M. Fast Parallel Image Registration on CPU and GPU for Diagnostic Classification of Alzheimer’s Disease. Frontiers in Neuroinformatics. 2014;7:50.
10. Black MS. Quantitative imaging of cartilage and meniscus for detection of early osteoarthritic degeneration. 2019; 74-92.Figures