2295
Combining Convolutional Neural Networks, Multiparametric MRI, and Error Detection to Improve Automated Liver Segmentation1Department of Radiology and Biomedical Imaging, University of California San Francisco, San Francisco, CA, United States, 2Department of Medicine, University of California San Francisco, San Francisco, CA, United States, 3College of Osteopathic Medicine, Touro University - California, Vallejo, CA, United States, 4Department of Pediatrics, University of California San Francisco, San Francisco, CA, United States
Synopsis
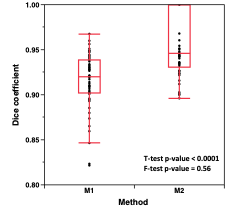
The objective of this study was to generate an automatic liver segmentation method. Two methods were compared. The first, M1, was a Convolutional Neural Network (CNN) trained on proton density fat fraction (PDFF) maps. The second, M2, was the CNN trained on multiparametric MRI (mpMRI) images combined with an error detection protocol. The distributions for Dice similarity coefficient (DSC), volume, and PDFF were improved for M2 versus M1. The DSC mean increased from 0.91 to 0.96. The M2 method was effective in detecting and correcting poor segmentations while significantly reducing processing time as compared to manual segmentation.
Introduction
Nonalcoholic fatty liver disease (NAFLD) is a common malady affecting ~25% of the population1. NAFLD is characterized by steatosis resulting in increased liver fat fraction and volume. MRI proton density fat fraction (MRI-PDFF) maps provide a relative measure of fat versus water in the liver thus quantifying liver steatosis2.Traditionally, PDFF measures are generated manually by segmentation of the liver or by placement of regions of interest (ROI) in the liver. To decrease segmentation time and avoid the pitfalls of ROIs bias, many methods have been developed for automated liver segmentation. Among these approaches, Convolutional Neural Network algorithms have exhibited promising results. However, the existence of some cases with poor results with these methods leads to the requirement for user intervention – to confirm and/or adjust the segmentation for all cases – during implementation. Segmentation accuracy may be dependent on both algorithm capability and image types. In our studies of liver fat, images for chemical shift encoded MRI (CSE-MRI) were available as a co-registered data set. With these constraints, the objective of this study was to generate an automatic liver segmentation method with high accuracy based on only CSE-MRI images, to produce metrics such as mean liver fat fraction and liver volume, with minimal user intervention.
Methods
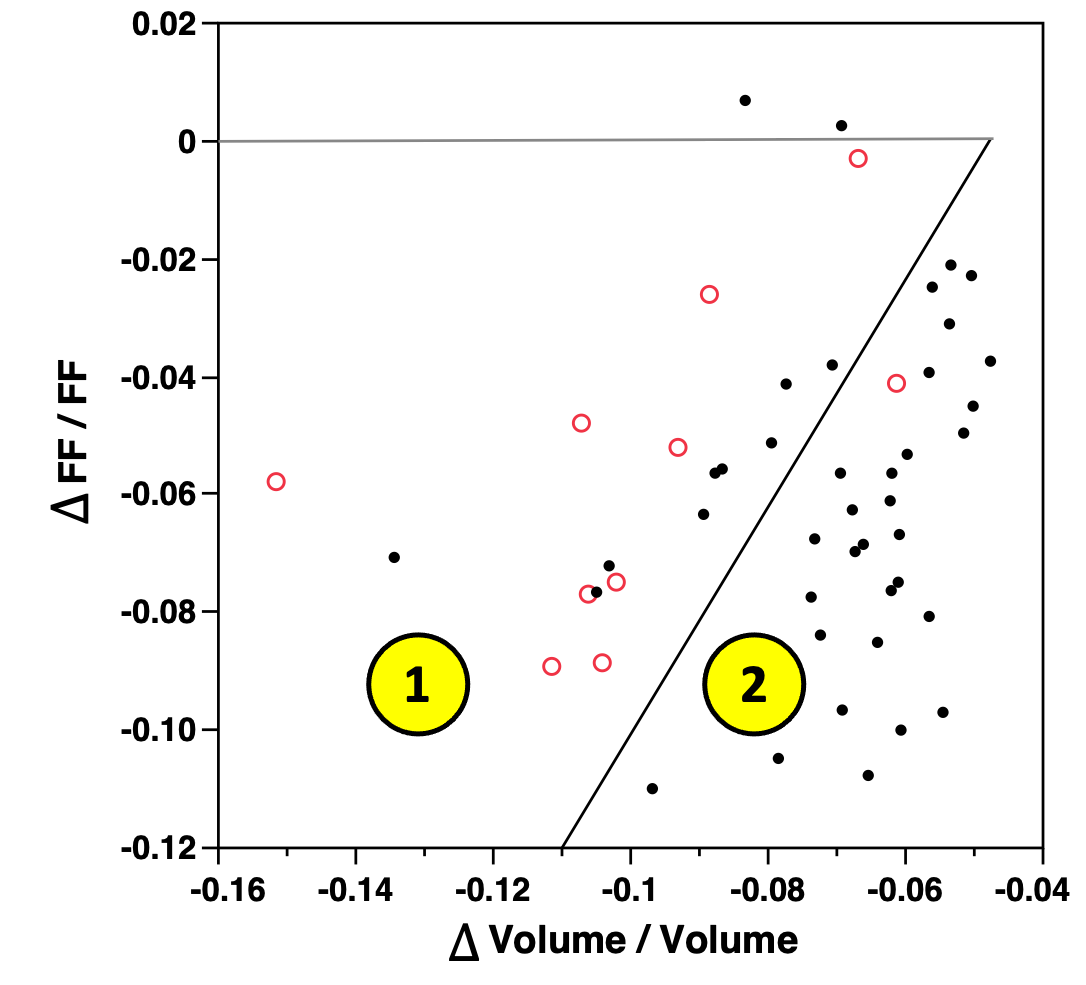
This retrospective study had data from studies of liver fat approved by the IRB. MRI results from 70 participants were included, with 20 in a training set and 50 in a test set. Participant imaging was performed with a six-echo, IDEAL-IQ (Iterative Decomposition of water and fat with Echo Asymmetry and Least squares estimation) sequence on a 3.0T scanner (GE Healthcare)3.Two segmentation methods were compared. The first, M1, was a 2D Unet CNN trained on PDFF maps4. The second, M2, was the 2D Unet CNN trained on multi-parametric MRI (mpMRI) images combined with an error detection and correction protocol. The mpMRI images were the PDFF map, the R2* map, and the out-of-phase image normalized by the in-phase image. These images were input as three channels to the CNN. The volume and mean PDFF of segmented livers were dependent on the CNN output probability threshold chosen to binarize the liver mask. We investigated correlations between the population Dice Similarity Coefficients (DSC) as functions of change in PDFF with threshold, versus change in volume with threshold. The differences are defined in Figure 1 dependent on thresholds of 0.4, 0.5, and 0.6.
In a plot of ΔFF versus Δvolume, we defined a cluster where the DSC’s tended to be low, <0.90, indicating poor automated segmentation. Cases within the cluster were identified as having potential erroneous segmentation so were relegated to manual correction of their segmentation. The M2 method implemented error correction after mpMRI CNN segmentation.
Results
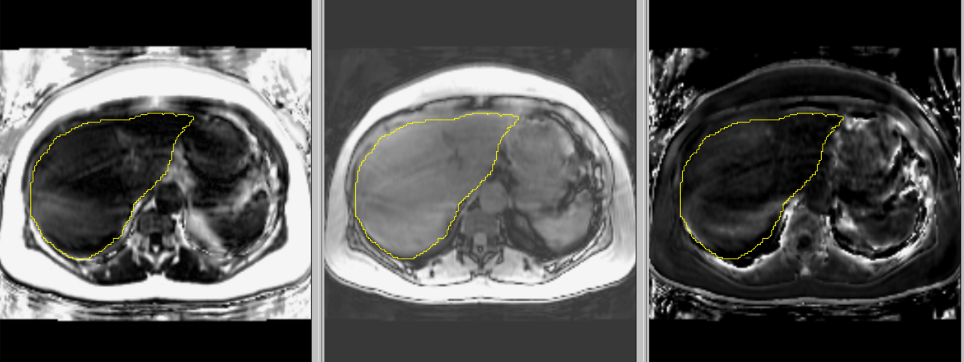
Figure 2 shows example scans demonstrating a liver segmentation. Figure 3 is a plot of ΔPDFF vs Δvolume with DSC groups highlighted. Most of the poor DSC cases are in cluster 1 (9/10, 90% capture rate) where PDFF change was lower for a given volume change. The one escape case had a DSC of 0.896. The mid- and high-DSC groups had 9 / 40 in cluster 1 for an overkill rate of 23%. Overall, there were 18 cases (36%) in cluster 1, designated as potential poor segmentation cases which must undergo manual inspection and potential adjustment of segmentation. The boundary line separating clusters 1 and 2 was defined in the plot.The DSC distributions for M1 and M2 are compared in Figure 4. The DSC mean increased from 0.91 to 0.96 (p <0.0001), and the number of cases below 0.90 was reduced from 11 (22%, DSC minimum = 0.82) to 1 (2%, DSC = 0.896). The mean PDFF exhibited an increase from 0.93 (M1) to 0.99 (M2) (p < 0.0001). The standard deviation decreased from 0.070 (M1) to 0.046 (M2). The Bland-Altman limits of agreement (LoA) narrowed from (-2.01, 0.89) for M1 to (-0.83, 0.51) for M2. The volume mean increased from 0.97 (M1) to 1.01 (M2) (p = 0.011). The standard deviation decreased from 0.087 (M1) to 0.036 (M2). The Bland-Altman LoA narrowed from (-330 cc, 224 cc) for M1 to (-169 cc, 190 cc) for M2.
Discussion and Conclusion
By comparing the PDFF and volumes obtained using different thresholds from the CNN output, cases with potentially low DSC were able to be identified. Cluster 1 exhibits a smaller change in PDFF for a given change in volume than cluster 2. This implies that cluster 1 cases had liver edges far from regions where PDFF had large gradients, such as the interface between the liver and visceral adipose tissue.A CNN liver segmentation method was developed with an error detection scheme using mpMRI images. As compared to a single image CNN model, the DSC was improved from 0.92 to 0.96. The method was effective in detecting and correcting poor segmentations while significantly reducing (~25x) user input time as compared to fully manual segmentation. The error detection scheme may be applicable to other automated segmentation methods where there is a desire to minimize occurrence of outlier results.
Acknowledgements
National Institutes of Health: R01DK112304, R01HL113887, P30DK063720, P30DK098722
Mark & Lynn Benioff
References
1. Arshard T, Golabi P, Henry L, Younissi ZM. Epidemiology of Non-alcoholic Fatty Liver Disease in North America. Curr Pharm Des, 2020;26:993-997. doi: 10.2174/1381612826666200303114934.
2. Caussy C, Reeder SB, Sirlin CB, Loomba R. Non-invasive, quantitative assessment of liver fat by MRI-PDFF as an endpoint in NASH trials. Hepatology. 2018;68(2):763–772. doi: 10.1002/hep.29797.
3. Yu H, McKenzie CA, Shimakawa A, Vu AT, Brau AC, Beatty PJ, et al. Multiecho reconstruction for simultaneous water-fat decomposition and T2* estimation. J Magn Reson Imaging. 2007;26(4):1153–1161. doi: 10.1002/jmri.21090.
4. Ronneberger O, Fischer P, Brox T. U-Net: Convolutional Networks for Biomedical Image Segmentation. In: Medical Image Computing and Computer-Assisted Intervention – MICCAI 2015. Lecture Notes in Computer Science. Springer, Cham. 2015;9351;234-241. https://doi.org/10.1007/978-3-319-24574-4_28.
Figures