2294
Investigating the effects of free breathing on in vivo13C MRS in the liver at 3T
Abi Spicer1, Susan Francis1, Penny Anne Gowland1, and Stephen Bawden1,2
1Physics, University of Nottingham, Nottingham, United Kingdom, 2NIHR Nottingham Biomedical Research Centre, Nottingham University hospitals NHS trust, Nottingham, United Kingdom
1Physics, University of Nottingham, Nottingham, United Kingdom, 2NIHR Nottingham Biomedical Research Centre, Nottingham University hospitals NHS trust, Nottingham, United Kingdom
Synopsis
13C Magnetic Resonance Spectroscopy (MRS) in the liver provides the only non-invasive method of studying metabolites in vivo, with standard protocols using multiple averages during a free breathing period. Using a respiratory belt to monitor the breathing cycle and in-house scripts, spectra were binned into inhale and exhale groups categorised as spectra within 2 standard deviations of the average minima/maxima. A systematic reduction in B0 during exhale compared with inhale but minimal impact on average B1 values during an inhale versus exhale. However, no significant changes in Phase angle, area under the curve or FWHM between the data sets.
Introduction
13C Magnetic ResonanceSpectroscopy (MRS) in the liver and muscle provides the only non-invasive
method of studying metabolites such as glycogen in vivo [1, 2]. However, there are significant challenges to obtaining
accurate data due to the small isotopic ratio of natural abundance carbon-13
(~1%), the reduced gyromagnetic ratio (~1/4 H) and the need for surface coils
which produce large B1 inhomogeneities. As such, standard methodologies require
averaging of multiple spectra over longer scan times acquired throughout free
breathing [3, 4] which may introduce error through the effects of motion,
sample position and changes in B0 field. In this study, we explored the impact
of respiration on 13C MRS.
Methods
All data was acquired on aPhilips Achieva 3T system using a Pulseteq 12cm single loop 13C
surface coil with a butterfly 1H quadrature decoupling coil. A 13-C
Urea sample (13C) was positioned in the centre of the coil as an external
reference point.
Five healthy participants were recruited (4 male/1 female), the
surface coil was placed over the liver (confirmed by scout images) with
participant’s arm remaining above their head throughout scanning. A respiratory
belt was attached to monitor the breathing cycle. 13C MRS was acquired (block
pulse-acquire, TR=1500ms[SF1] )
during free breathing (75 spectra) to assess the effects on the external
reference peak (long TR for full recovery). These scans were repeated with a
shorter repetition time (TR= 280ms) and more spectra acquired (free breathing =
256 spectra) to improve SNR for analysis of internal metabolites with a shorter
T1.
B0 maps were also acquired from four participants during
inhale and exhale separately.
Modelled Data. B0 maps were used to create liver
masks and the coil position determined from images. A Biot-Savart static field
approximation was then used to model the
B1 field across the liver based on distance from coil elements as reported previously
[5]
using in-house software (Matlab2020b). The coil sensitivity map (based on B1 [6])
was used to determine the weighted mean of B0 in the liver.
13C MRS analysis. Spectral analysis was undertaken
using in-house scripts (Matlab 2020b). Spectra where phase corrected, and line
broadened before a baseline correction was applied. The full free-breathing
spectra were each averaged. Spectra acquired during free breathing were then
binned according to breathing phase using the respiration trace. Inhale was
defined to include spectra within 2 standard deviation of the maxima
of the respiratory trace across all cycles, exhale including spectra within 2
standard deviation of the minima across all cycles). The means within the bins
were calculated to give an average inhale spectrum and an average exhale binned
spectrum (figure 1). The reference peak and the olenific lipid peaks where then
fitted to a gaussian function using lsqfit and the peak area, peak position and
full width half maximum (FWHM) determined, along with the chemical shift
between the external reference peak and the olenific lipid peak. The phase
angle across the spectra was also calculated.
Results
Modelled data. Figure 2 shows an example sensitivityand B0 map in one slice the liver. The B0 was lower during exhale compared with
inhale for all participants, with a mean change of 106 ± 20 Hz. The mean standard
deviation in B0 was 56 ± 19 Hz and 54 ± 30 Hz for inhale and exhale
respectively (figure 3).
13C MRS. Figures 4 and 5 show the change in phase angle, FWHM, peak area and peak position for the
external reference and olenific lipid peaks respectively. The mean chemical shift
between external reference and olenific peaks were 981 ± 34Hz, 983 ±
36Hz and 989 ± 28Hz for the full cycle,
inhale binned and exhale binned respectively.
Discussion
Our standard MR protocol for natural abundance 13C MRSacquires data with multiple averages over a longer period during free
breathing, with no localization. In this study, we explored the impact this has
on the final spectral acquisition. The modelled data showed minimal impact on
average B1 values during an inhale versus exhale breath hold, which may be
expected as the surface coil moves with the abdomen during breathing resulting
in similar coil-to-sample distances throughout. However, there did appear to be
a systematic reduction in B0 during exhale compared with inhale of around 100
Hz, which corresponds to 3 ppm for 13C MRS at 3T. This shift was not observed
in the inhale and exhale binned spectra, which may be due to a more shallow
respiration phase compared to full breath hold. There were no significant
changes in Phase angle, area under the curve or FWHM between the inhale or
exhale and free breathing data.
This study suggests that acquiring data over the
breathing cycle has a minimal impact on the final spectra. Further work will study
in more detail the possible B0 effects at the extremes of the breathing cycle
and consider using respiratory monitoring to exclude particularly large
excursions.
Acknowledgements
No acknowledgement found.References
1. Stephenson, M.C., et al., Variability in fasting lipid and glycogencontents in hepatic and skeletal muscle tissue in subjects with and without
type 2 diabetes: a 1H and 13C MRS study. NMR in
Biomedicine, 2013. 26: p. 1518 -
1526.
2. Taylor, R., et al., Validation of C-13 Nmr Measurement of Human
Skeletal-Muscle Glycogen by Direct Biochemical Assay of Needle-Biopsy Samples.
Magnetic Resonance in Medicine, 1992. 27(1):
p. 13-20.
3. Bawden, S., et al., Increased liver fat and glycogen stores
following high compared with low glycaemic index food: a randomized cross over
study. Diabetes Obes Metab, 2016.
4. Casey, A., et al., Effect of carbohydrate ingestion on glycogen
resynthesis in human liver and skeletal muscle, measured by C-13 MRS.
American Journal of Physiology-Endocrinology and Metabolism, 2000. 278(1): p. E65-E75.
5. Bawden S, H.K., Marciani L, Glover P,
Morris P, Gowland P, Surface coil
sensitivity of 13C Magentic Resonance Spectroscopy at 3T: A comparison of
static field approximations, phantom repositioning and MRSI data.
Proceedings 20th Scientific Meeting of the British Chapter of ISMRM, 2014.
6. Hoult, D.I., The principle of reciprocity in signal
strength calculations - A mathematical guide. Concepts in Magnetic
Resonance, 2000. 12(4): p. 173-187.
Figures

Figure 1. Example of a
respiratory trace with sample points categorised and the respective mean
spectra produced. Red – inspiration. Blue – expiration.
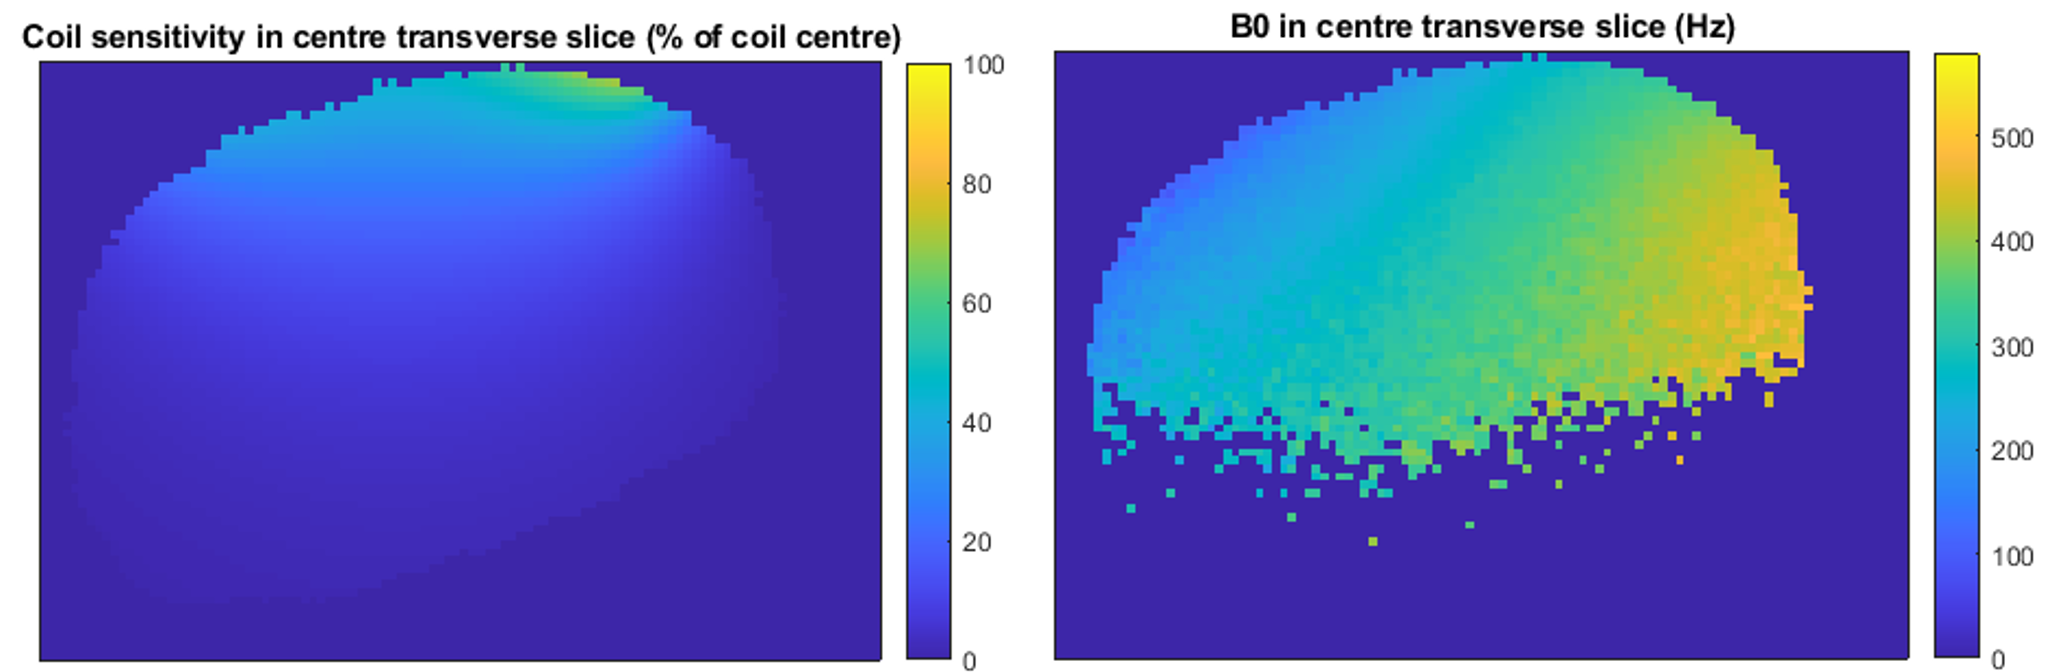
Figure
2: Coil sensitivity plot and example B0 map
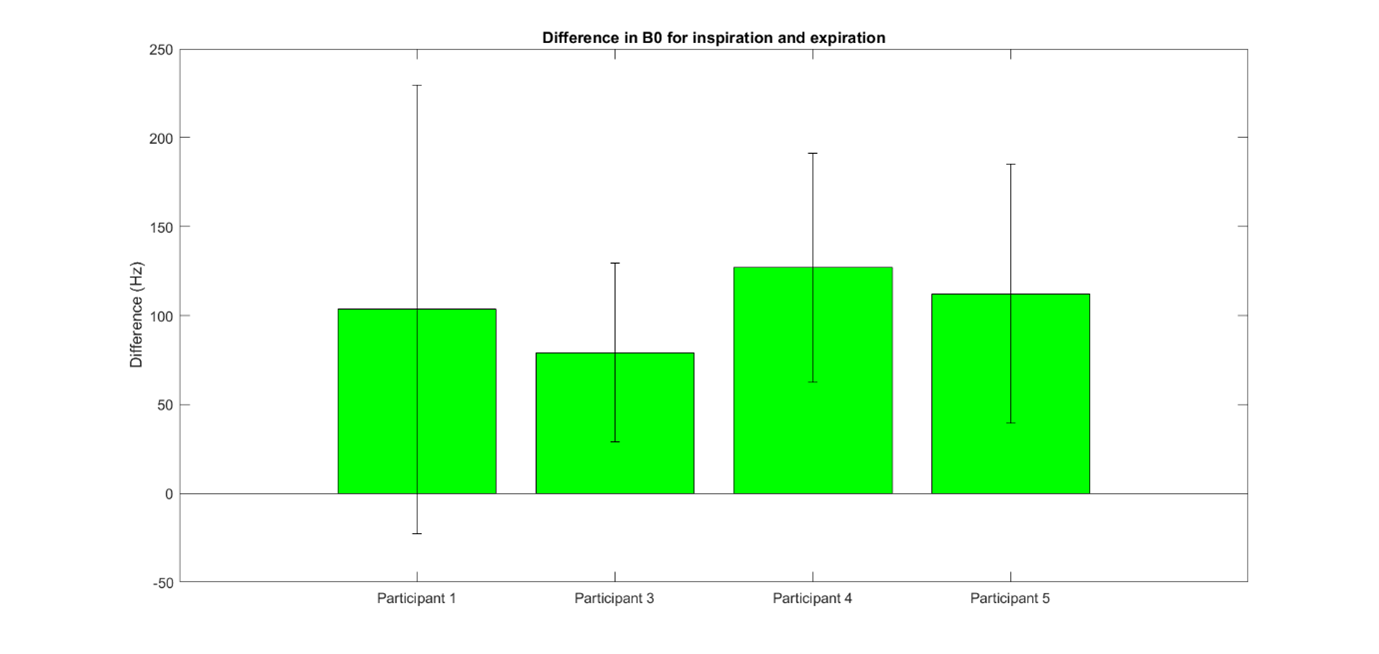
Figure 3 – Change in B0 (Hz) between inspiration and
Expiration.
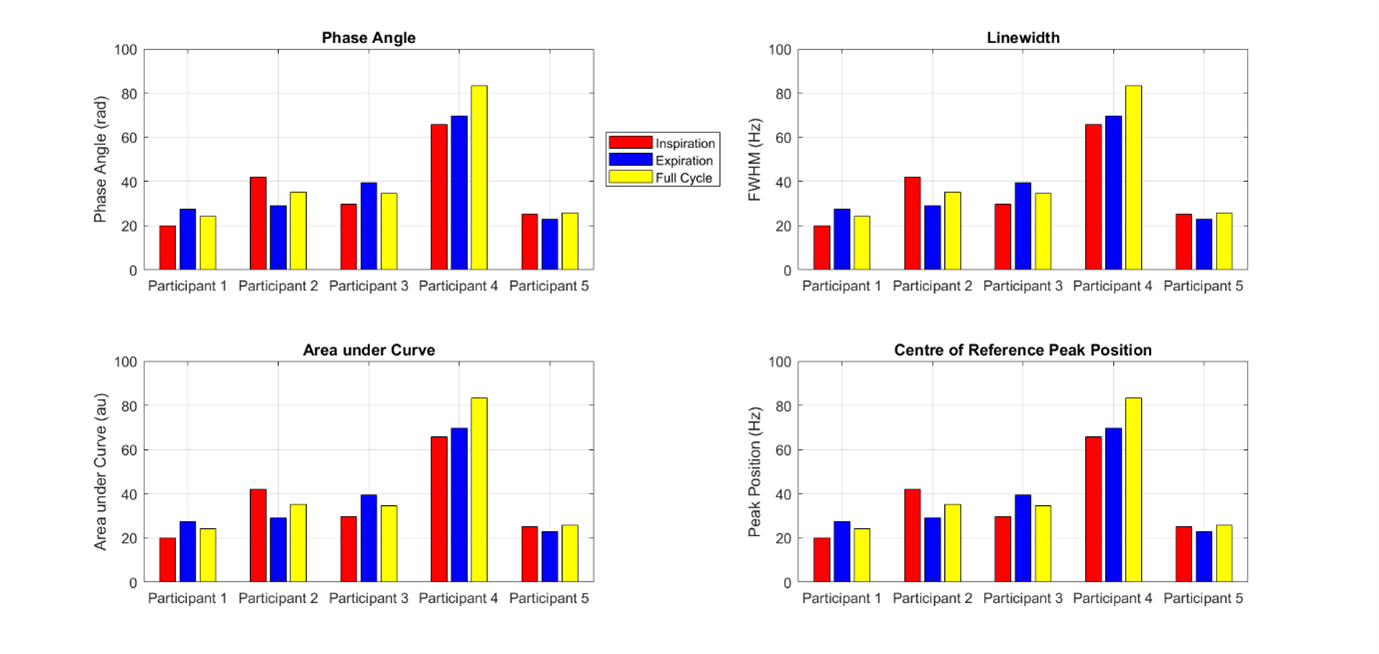
Figure 4. External
Reference measurements from different points on the respiratory cycle
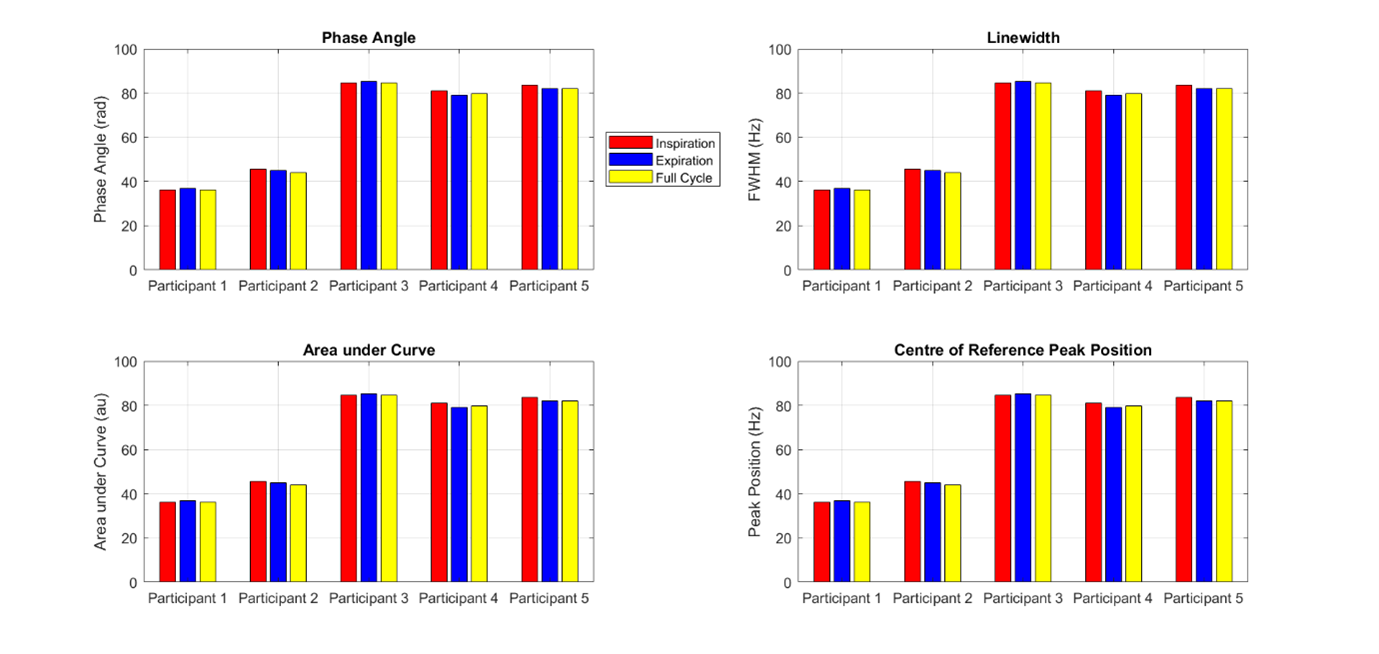
Figure 5. Measurements of the
olefinic carbon peaks from different points on the respiratory cycle
DOI: https://doi.org/10.58530/2022/2294