2293
Simultaneous Assessment of Complementary Metabolic Pathways in Liver Using Co-polarized Hyperpolarized 13C pyruvate and 13C dihydroxyacetone1Department of Radiology and Biomedical Imaging, University of California, San Francisco, CA, United States, 2Mallinckrodt Institute of Radiology, Washington University, St. Louis, MO, United States
Synopsis
Hyperpolarized 13C MRS is a powerful emerging technique for assessing metabolic liver diseases, including diabetes and fatty liver. Chemical shift separation allows monitoring of many metabolites at once. Here, we explore the possibility of co-polarizing [1-13C]pyruvate and [2-13C]dihydroxyacetone to simultaneously assess two important metabolic pathways that are altered in liver disease. Co-polarization was successful, with preserved T1 relaxation times. Although co-polarization led to modest decreases in polarization levels, all expected metabolites were observed when injected into a healthy rat. By examining two pathways at the same time, co-polarization can be an important tool for assessing liver disease.
Introduction
Liver metabolism is central to many important human diseases, including diabetes mellitus (DM) and non-alcoholic fatty liver disease (NAFLD). There is an unmet need for non-invasive markers that can be used for diagnosis and treatment monitoring. Hyperpolarized (HP) 13C MR spectroscopy has emerged as a valuable tool for measuring real-time metabolism in both oncologic and non-oncologic applications, with many ongoing human clinical trials. Two HP agents have shown particular promise for metabolic liver diseases: 1) HP [1-13C]pyruvate, which is metabolized to lactate, alanine, and bicarbonate, has been shown to be sensitive to both acute liver injury1 and derangements of energy metabolism that occur with diabetes2 and the accumulation of fat3. 2) HP [2-13C]dihydroxyacetone (DHAc), which has observable metabolites glycerol-3-phosphate (G3P) and phosphoenolpyruvate (PEP), is sensitive to the state of gluconeogenesis (4-6). Because these two agents and their metabolites produce spectra with non-overlapping chemical shifts, they can potentially be imaged at the same time. In this study, we investigated “co-polarization” of HP 13C DHAc and HP 13C pyruvate, in order to simultaneously probe two important metabolic pathways in the liver.Methods
Dissolution DNP was performed using a SPINLab polarizer (GE Healthcare) operating at 0.8 K and 5 T. Samples were prepared as follows. 1) HP [1-13C]pyruvate: 60 μL of neat [1-13C]pyruvic acid doped with 17.5 mM ΟΧ063 was polarized for 3.5 hrs using an optimal microwave frequency, dissolved with 14 mL of pre-heated H2O and neutralized with a NaOH/Tris buffer (final pH = 7.8). 2) HP[2-13C]DHAc: 110 μL of 7.8 M DHAc (Sigma Aldrich) solution doped with 17.5 mM ΟΧ063 and prepared in H2O/DMSO (2/1 v/v%) mixture was polarized for 3.5 hrs. 3) HP Pyruvate/DHAc Co-polarization: 110 uL of DHAc stock solution and 60 uL of pyruvate stock solution were loaded into a cryovial, resulting in 5 M DHAc and pyruvate with 17.5 mM OX063 solution.Animal experiments were performed using a 3T clinical MRI scanner (GE Healthcare, Waukesha, Wisconsin, USA) with a custom built, dual-tuned rat 1H/13C birdcage coil. After dissolution, 2.7 mL of HP solution was injected into the tail vein of a normal Wistar rat over 12 s with image acquisition starting 15 s after the beginning of the injection. 2D CSI was performed with the following parameters: flip angle = 10°; TR = 227 ms; matrix size = 8 x 10; field of view = 80 x 100 mm. The bandwidth of excitation RF pulse was 10kHz. The center frequency was set to mid-way between DHAc (213 ppm) and G3P (doublet, 69 ppm). Singly polarized pyruvate, DHAc, and co-polarized samples were injected with a gap of 15 minutes between each experiment. Polarization and sample concentrations were determined using an aliquot of the sample solution at a 1.41T benchtop NMR (Oxford Instruments, UK) and 9.4T system (Bruker Avance III).
Results
Co-polarized [1-13C]pyruvate and [2-13C]DHAc showed the expected dynamics and chemical shifts (Fig 1a). T1 of co-polarized [1-13C]pyruvate and [2-13C]DHAc at 3T were 77 s and 42 s, respectively, which matched published values from the agents when polarized alone. Polarization of co-polarized [1-13C]pyruvate and [2-13C]DHAc (measured 60 s after dissolution) were 14% and 7%, respectively (Fig 1b), compared to 21% and 17% when polarized alone (Fig 1c-d).When examined in-vivo, the expected metabolites of both [1-13C]pyruvate and [2-13C]DHAc were observed (Fig 2a-b) in both co-polarized samples as well as individually polarized samples. Voxels from the liver and kidney were summed together as shown in Fig 2a. As expected, metabolism of [2-13C]DHAc into G3P was observed in the liver but not the kidneys (Fig 2d-e). The overall SNR of the co-polarized spectrum was lower than that observed for individually polarized samples, which is consistent with the decreased polarization levels observed in Fig 1.
Discussion and Conclusion
In this work, we show, for the first time, simultaneous polarization of HP [2-13C]DHAc and HP [1-13C]pyruvate, with observable metabolites from both agents visible in rat liver. Polarization levels were lower in the co-polarized samples compared to the individually polarized samples, but the expected metabolites were all still observable. One of the principal benefits of HP 13C MRI for molecular imaging is the ability to separate compounds based on chemical shift, thereby observing multiple metabolic pathways at once. Examining these two important pathways simultaneously should be very powerful in the non-invasive assessment of metabolic diseases such as DM and NAFLD. The equipment and workflow for this study are identical to those used for human HP 13C studies, suggesting straightforward eventual clinical translation. Future studies will optimize the formulation of the combined agents in order to minimize polarization loss from co-polarization. In addition, the acquisition will benefit from specialized spectral-spatial acquisition7 and proton decoupling of G3P8,9 that has previously been described for [2-13C]DHAc imaging.Acknowledgements
This research was supported by NIH (R01 DK115987, P41 EB013598).
References
1. Josan, S. et al. (2015) ‘Assessing inflammatory liver injury in an acute CCl4 model using dynamic 3D metabolic imaging of hyperpolarized [1-13C]pyruvate: Assessing Inflammatory Injury With Metabolic Imaging of 13C Pyruvate’, NMR in Biomedicine, 28(12), pp. 1671–1677.
2. Morze, C. von et al. (2018) ‘Non-invasive detection of divergent metabolic signals in insulin deficiency vs. insulin resistance in vivo’, Scientific Reports, 8(1), p. 2088.
3. Moon, C.-M. et al. (2017) ‘Metabolic biomarkers for non-alcoholic fatty liver disease induced by high-fat diet: In vivo magnetic resonance spectroscopy of hyperpolarized [1-13C] pyruvate’, Biochemical and Biophysical Research Communications, 482(1), pp. 112–119.
4. Moreno, K.X. et al. (2014) ‘Real-time Detection of Hepatic Gluconeogenic and Glycogenolytic States Using Hyperpolarized [2-13C]Dihydroxyacetone’, Journal of Biological Chemistry, 289(52), pp. 35859–35867.
5. Marco‐Rius, I. et al. (2017) ‘Monitoring acute metabolic changes in the liver and kidneys induced by fructose and glucose using hyperpolarized [2‐13C]dihydroxyacetone’, Magnetic Resonance in Medicine, 77(1), pp. 65–73.
6. Ragavan, M. et al. (2021) ‘Hyperpolarized Dihydroxyacetone Is a Sensitive Probe of Hepatic Gluconeogenic State’, Metabolites, 11(7), p. 441.
7. Marco-Rius, I. et al. (2017) ‘Multiband spectral-spatial RF excitation for hyperpolarized [2- 13C]dihydroxyacetone 13C-MR metabolism studies: Spectral-Spatial Excitation of HP 13C-Dihydroxyacetone’, Magnetic Resonance in Medicine, 77(4), pp. 1419–1428.
8. von Morze, C. et al. (2018) ‘Sensitivity enhancement for detection of hyperpolarized 13C MRI probes with 1H spin coupling introduced by enzymatic transformation in vivo: HP 13C MRI With 1H Spin Coupling’, Magnetic Resonance in Medicine, 80(1), pp. 36–41.
9. Marco-Rius, I. et al. (2021) ‘Probing hepatic metabolism of [2-13C]dihydroxyacetone in vivo with 1H-decoupled hyperpolarized 13C-MR’, Magnetic Resonance Materials in Physics, Biology and Medicine, 34(1), pp. 49–56.
Figures
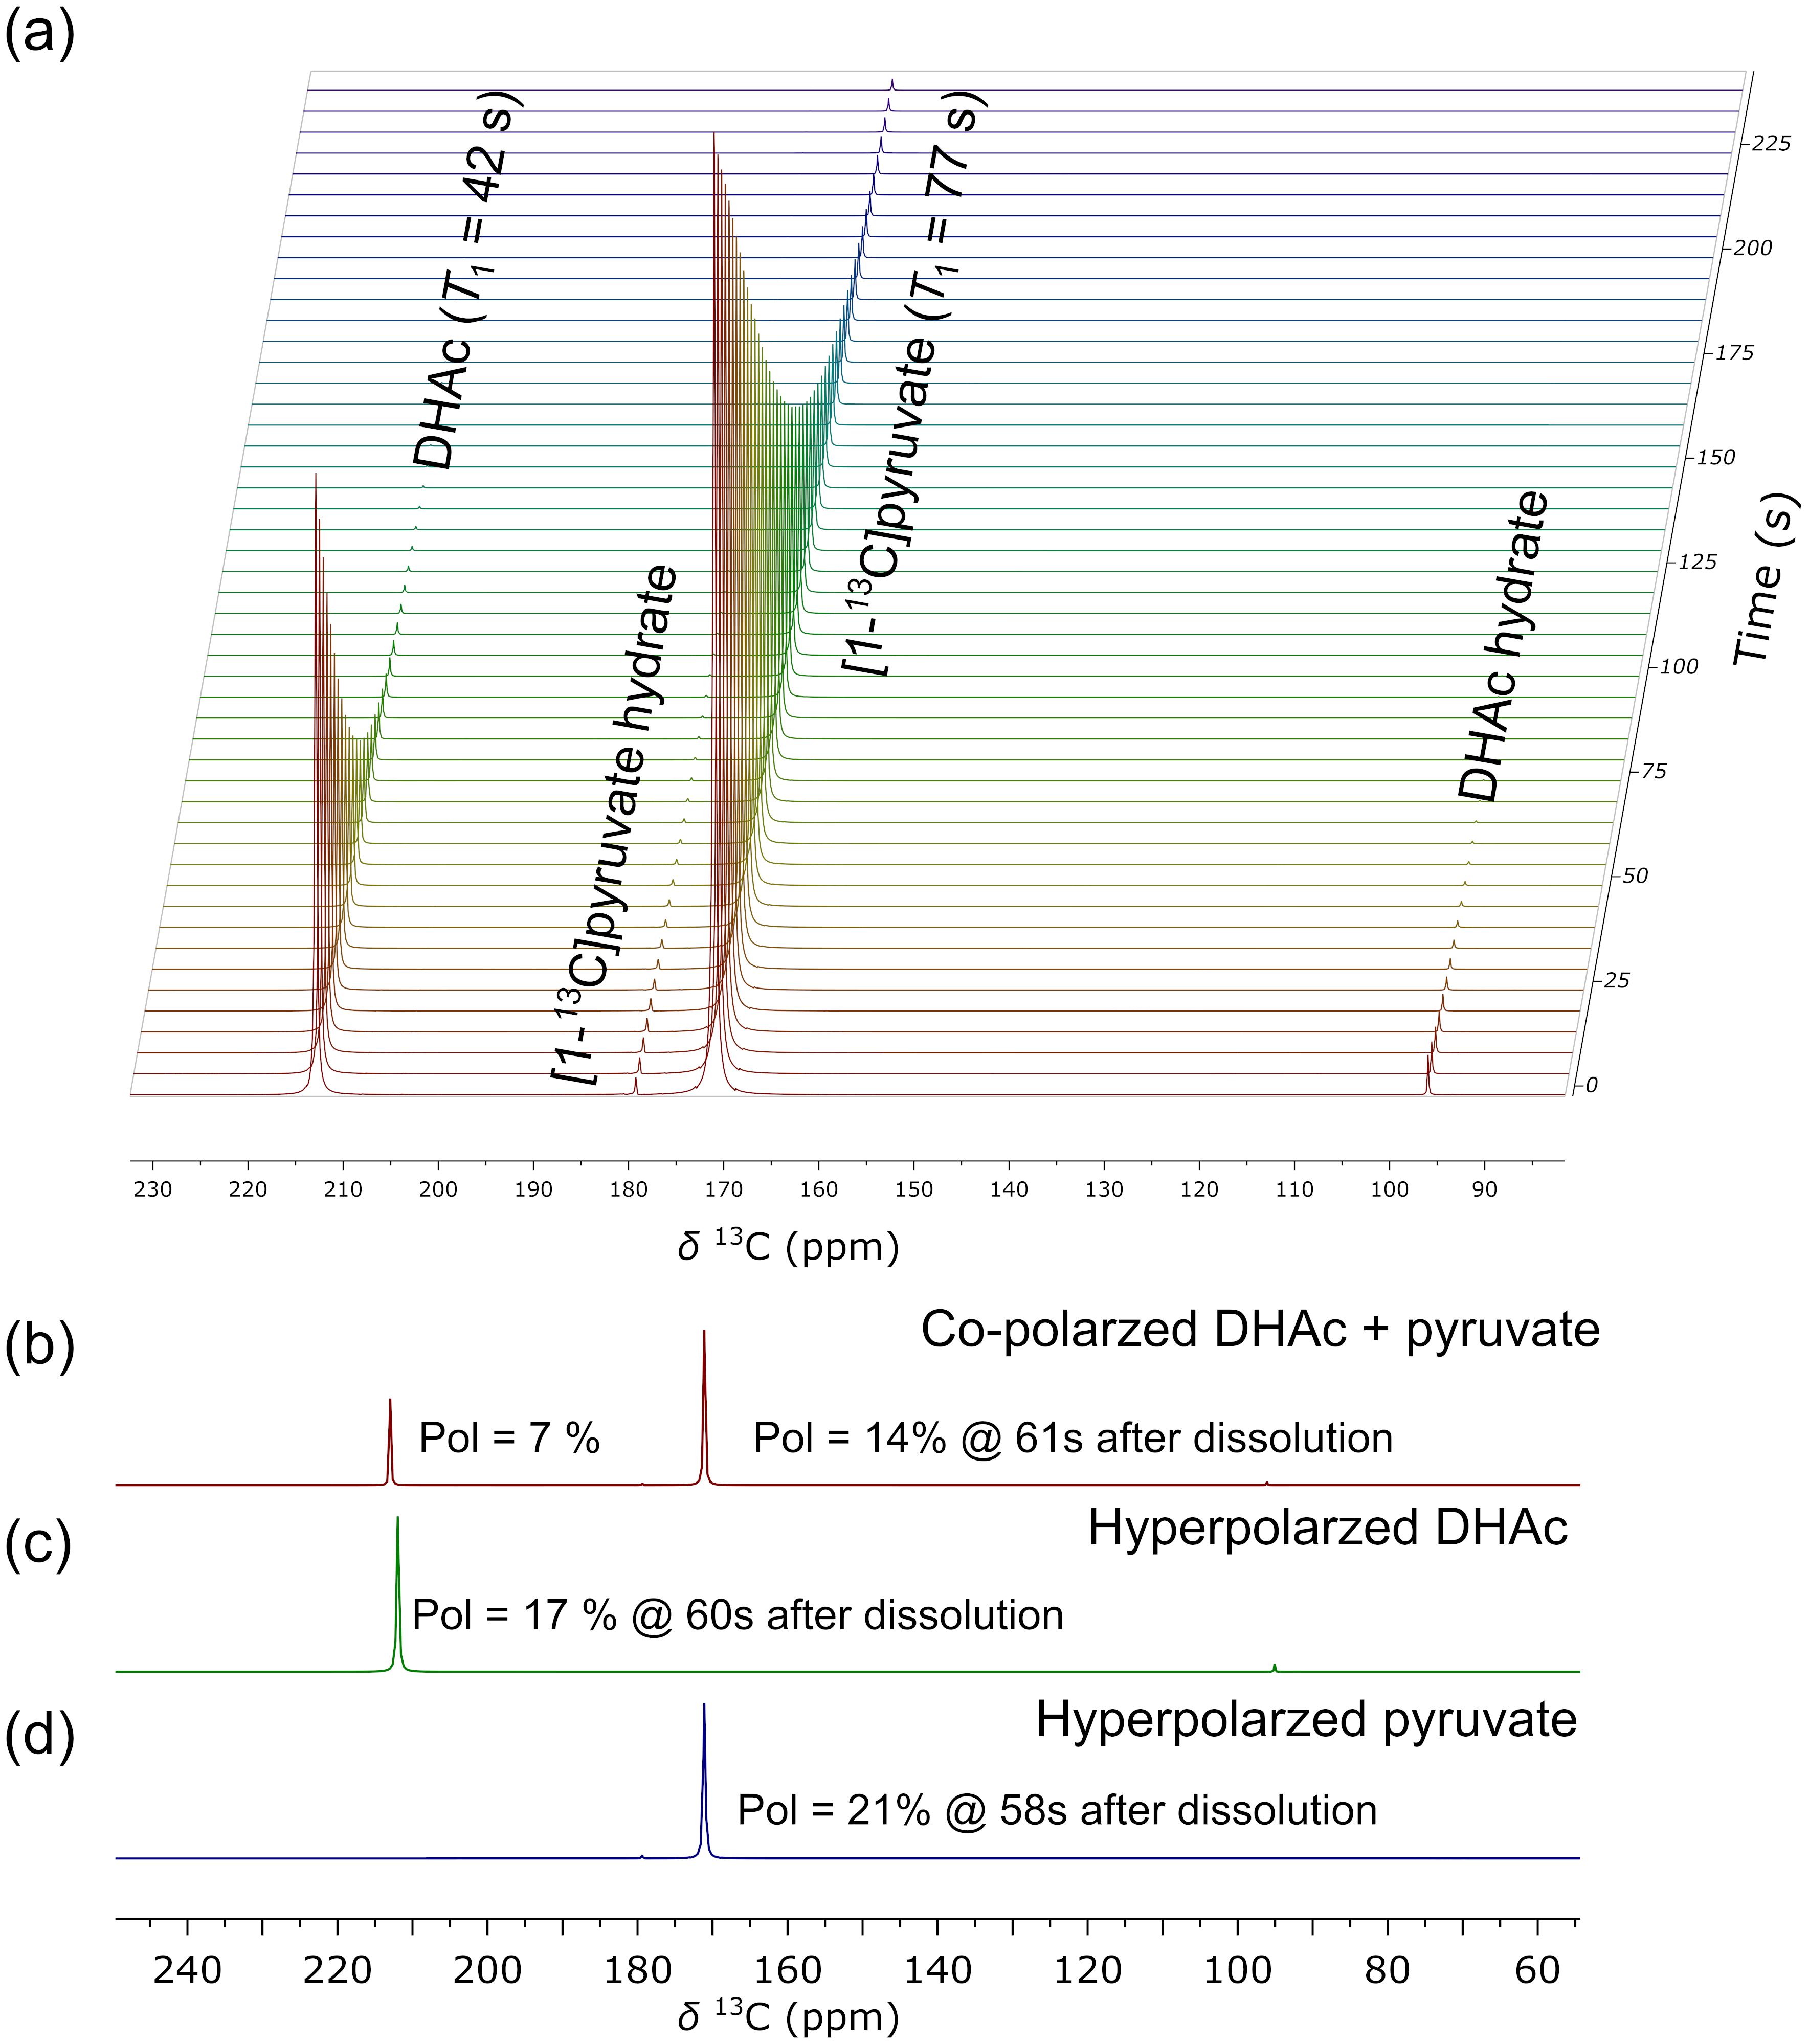
Figure 1. (a) Time resolved spectra of co-hyperpolarized [2-13C]dihydroxyacetone (DHAc) and [1-13C]pyruvate acquired at 1.41T. T1 relaxation times are indicated next to the labels. The firstly acquired spectra of (b) co-perpolarized [2-13C]DHAc and [1-13C]pyruvate, (c) hyperpolarized [2-13C]DHAc , and (d) hyperpolarized [1-13C]pyruvate. The obtained polarization levels from DHAc and pyruvate at the time of acquisition are denoted in the spectra.
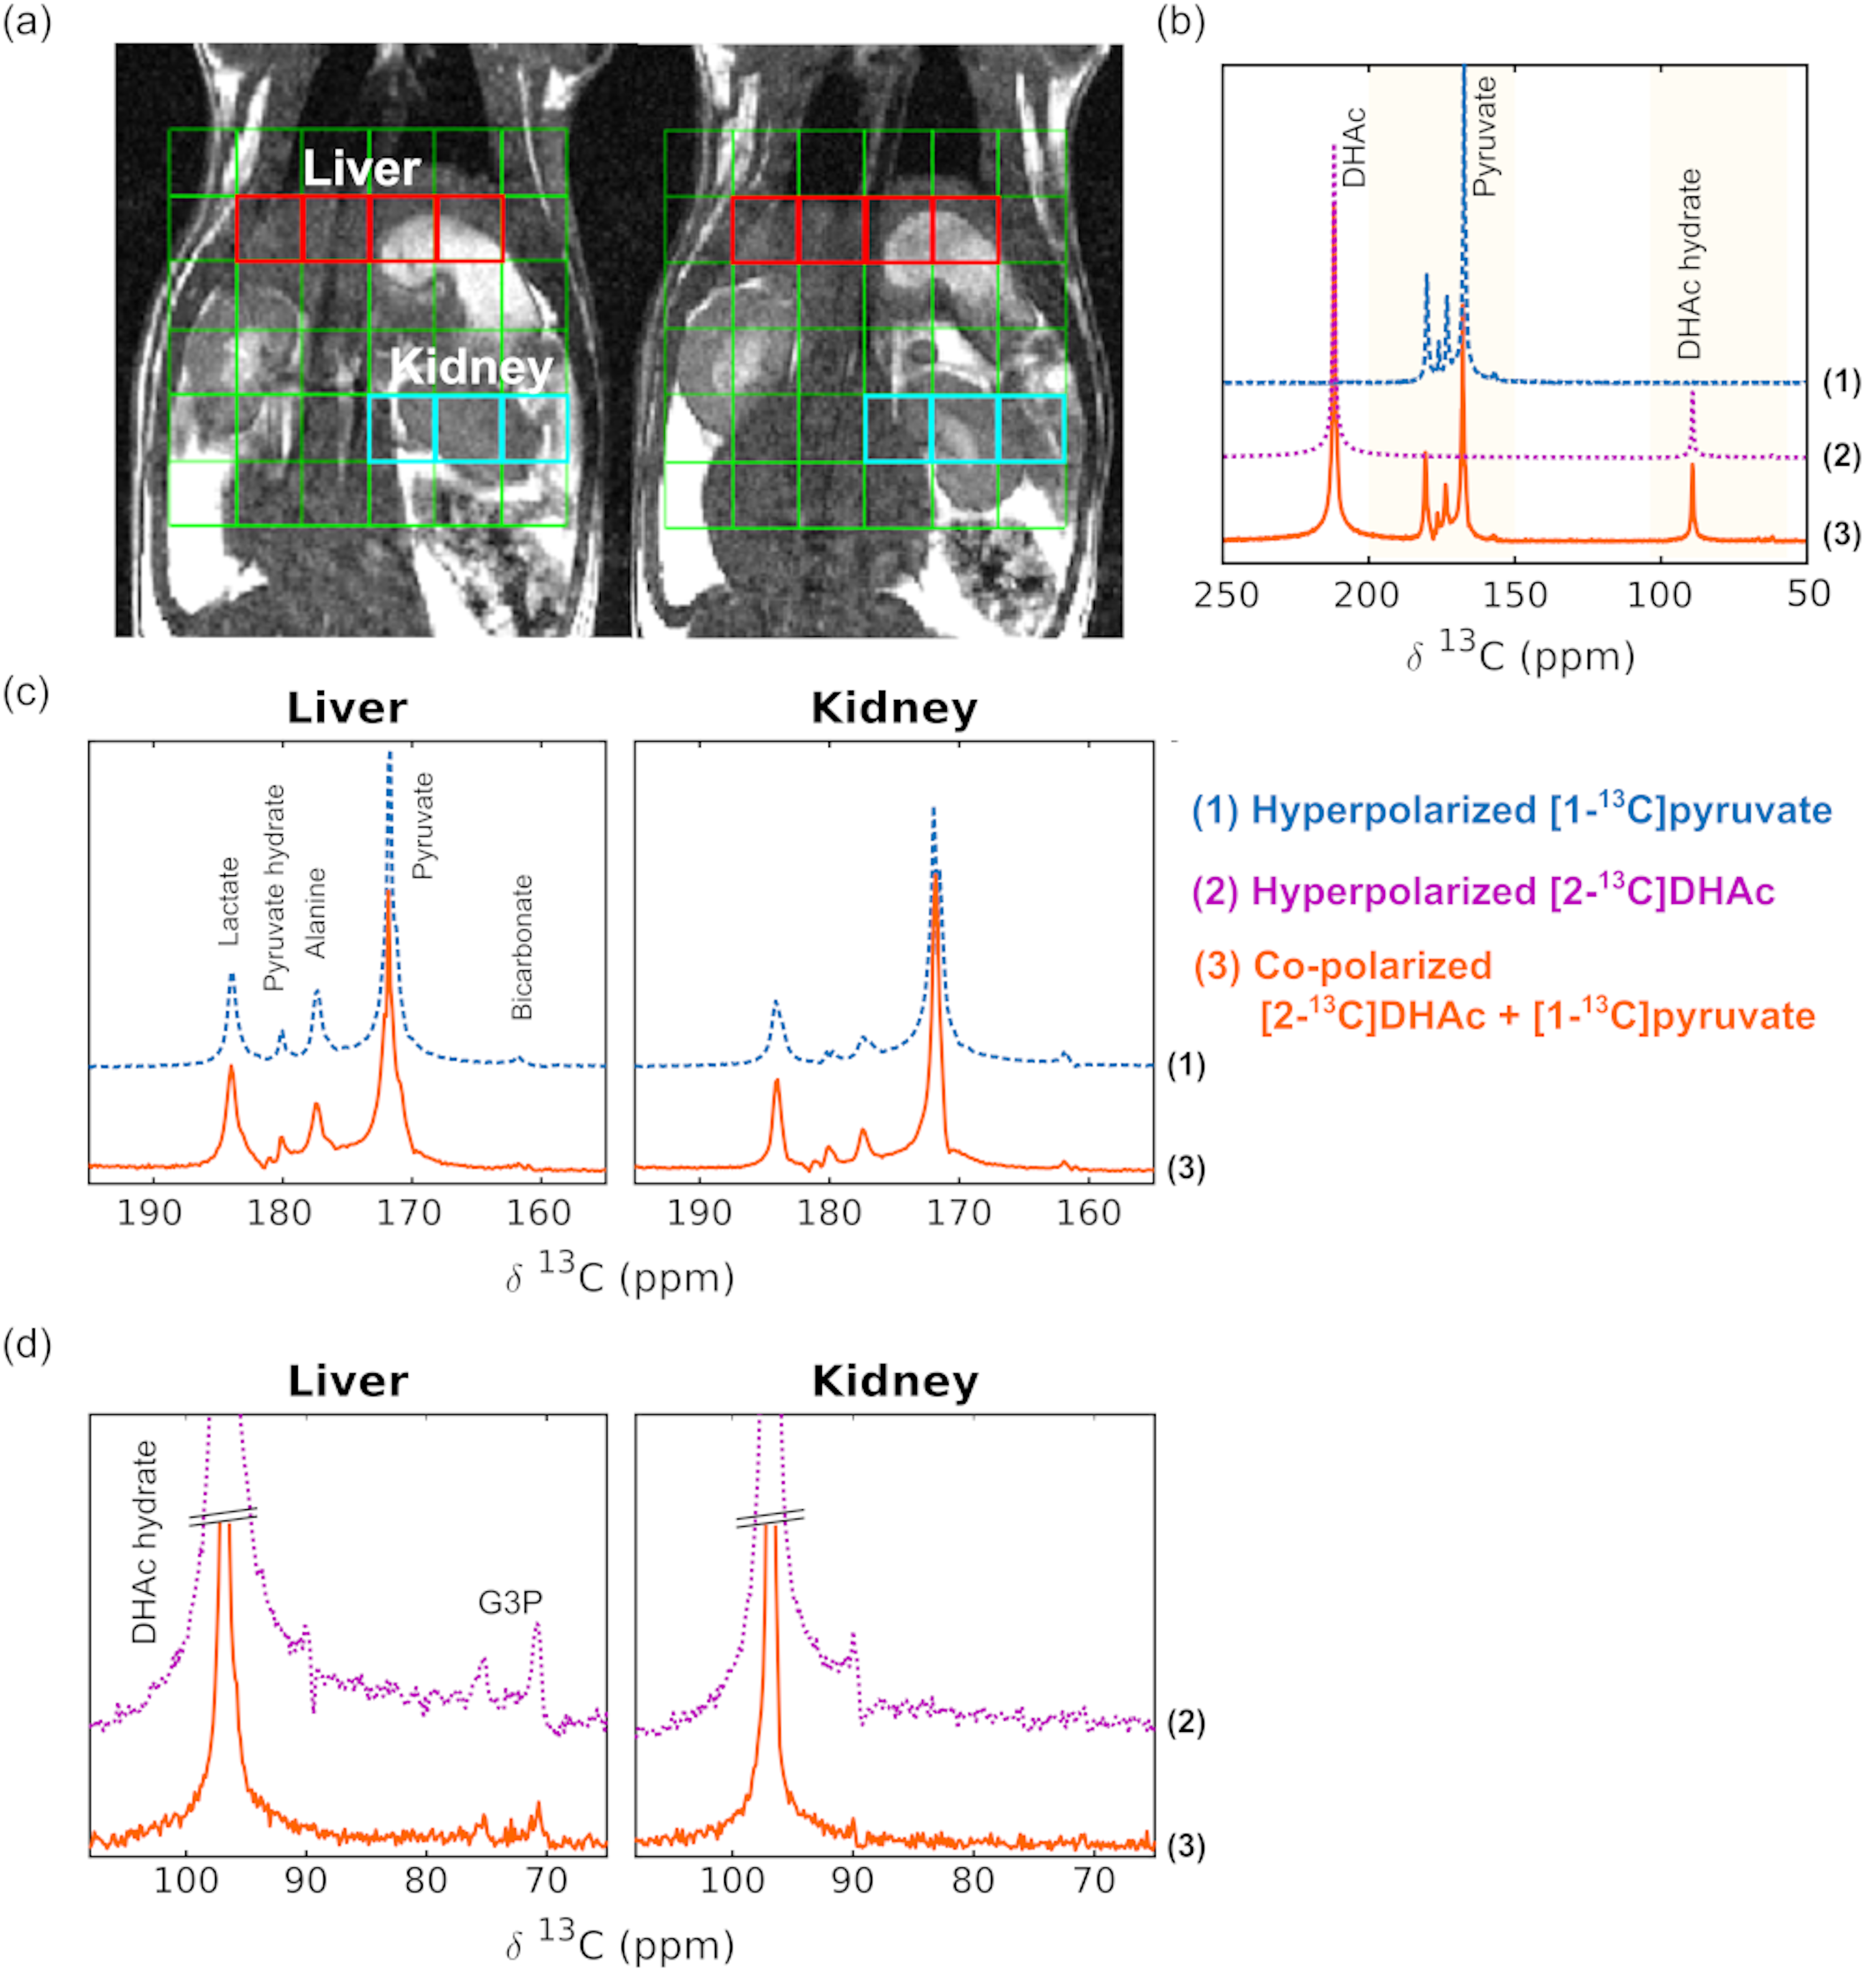
Figure 2. (a) 1H anatomical images of a rat overlaid with a grid for 13C 2D-CSI resolution. (b) Summed spectra of liver voxels from the (1) hyperpolarized [1-13C]pyruvate, (2) hyperpolarized [2-13C]DHAc, and (3) co-polarized [2-13C]DHAc and [1-13C]pyruvate. Enlarged summed spectra from the liver and kidney ROIs, acquired from (c) the hyperpolarized [1-13C]pyruvate (blue) and co-polarized [2-13C]DHAc and [1-13C]pyruvate (orange) injections and (d) from the hyperpolarized [2-13C]DHAc (purple) and co-polarized [2-13C]DHAc and [1-13C]pyruvate (orange) injections.