2292
Development of 13C MRS measurements of hepatic glutathione production: monitoring oxidative stress in vivo1Sir Peter Mansfield Imaging Centre, School of Physics and Astronomy, University of Nottingham, Nottingham, United Kingdom, 2NIHR Nottingham Biomedical Research Centre, Nottingham University hospitals NHS trust and the University of Nottingham, University of Nottingham, Nottingham, United Kingdom, 3Sir Peter Mansfield Imaging Centre, School of Medicine, University of Nottingham, Nottingham, United Kingdom, 4Translational and Clinical Research Institute, Newcastle University, Newcastle, United Kingdom
Synopsis
Oxidative stress plays a central role in the development of both acute and chronic liver injury, with glutathione being the primary anti-oxidant. This study develops a method of measuring glycine to glutathione flux in vivo using 13C MRS and a novel labelling strategy. Quantification of [2-13C] glycine and [2-13C] glutathione concentrations following glycine ingestion show that the protocol used in this study does successfully enrich the glutathione pool and confirm the assumptions of the metabolic model proposed. This provides a powerful methodology to investigate oxidative stress in patient populations and in response to drug intervention.
Introduction
Oxidative stress plays a central role in the development of both acute and chronic liver injury [1]. Glutathione is an endogenous anti-oxidant in the liver and the rate it is replenished determines the degree of injury, its potential to progress and final outcomes [2]. Magnetic Resonance provides the only non-invasive techniques available for measuring hepatic mitochondrial function in vivo [3]. In previous work, a novel 13C labelling strategy using glycine was proposed as a method of measuring glutathione production in the liver [4]. In this study, we extended previous work [5] by developing a method to quantify in vivo concentrations and a robust model of glycine to glutathione flux rates. Results are compared in a test-retest protocol.Methods
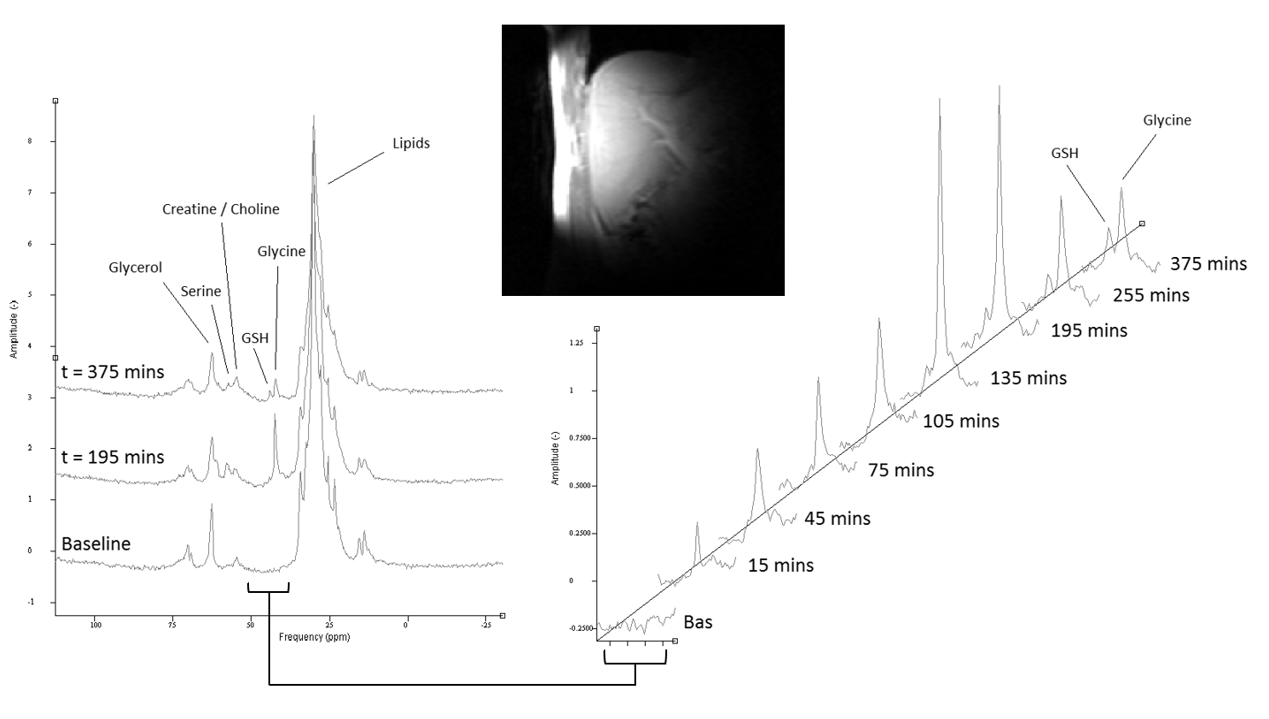
Test day protocol: Eight healthy male participants were scanned on two visits (>7 day wash out period between). During test days, participants were given a [2-13C] glycine solution (99% labelled, 4g in 50ml water) at t=0 mins and every 30 minutes following for 6 doses. At baseline, and following each dose, 13C MRS was acquired and blood samples were taken to measure 13C glycine enrichment.MR Protocol: All spectra were acquired on a Philips Achieva 3T using a Pulseteq 12cm single loop 13C surface coil with quadrature decoupling [6]. A 13C Urea reference sample was attached at the coil centre. Initial scout images were acquired to confirm correct coil placement and measure relative liver-to-coil positioning, followed by 13C MRS acquisition (adiabatic pulse-acquire,104 averages,512 datapoints,TR=5500ms,total scan time ~10 minutes,narrow band decoupling [5]).
Quantification Development: To quantify 13C concentrations, an average human sized liver phantom was produced (1.1 litres, plastic mould) and filled with a [2-13C] glycine solution (13 mmol/l). Spectra were acquired using in vivo protocol whilst the phantom was systematically repositioned.
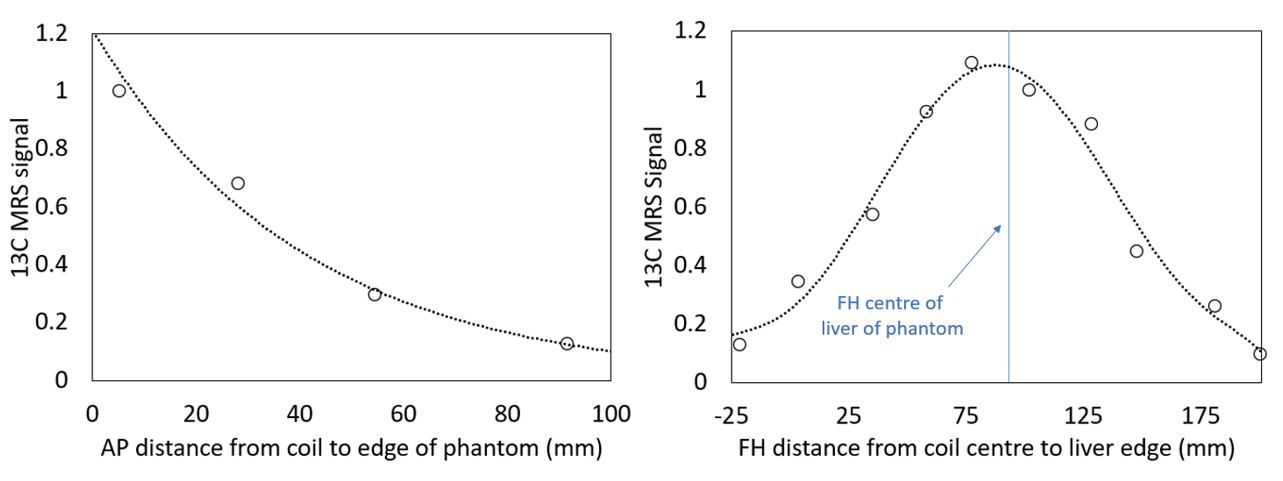
MRS Analysis and Quantification: All spectra were phase corrected and fitted to Gaussians to estimate peak areas (Matlab). Scout images were used to measure the distance from the reference sample (coil centre) to (1) the liver edge in AP direction; and (2) the top of the phantom/liver (at the liver-lung boundary) in the FH direction. Peak areas were scaled to the reference peak, plotted against distance in the AP and FH directions and fitted to produce curves of signal change with distance (normalized to maximum signal). The final concentration calculation was modified to include distance correction factors:
Lglycine=kAP kFH(Rliver/Rphantom)Phglycine
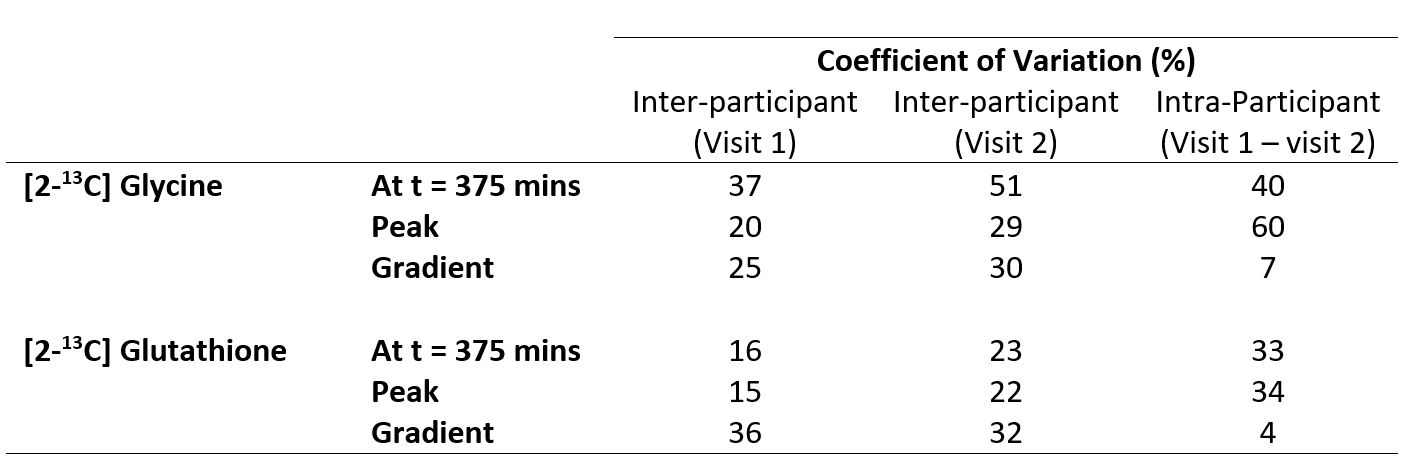
were Lglycine and Phglycine are the concentrations in liver and phantom; Rliver and Rphantom are the MRS glycine-to-reference peak ratios in the liver and phantom; and kAP and kFH are the coil-to-liver correction factors in the AP and FL directions. The final concentration values were plotted against time and the linear gradient of glutathione concentration was calculated from t=0 to t=135 mins. The participant CV% were also calculated and compared.
Results
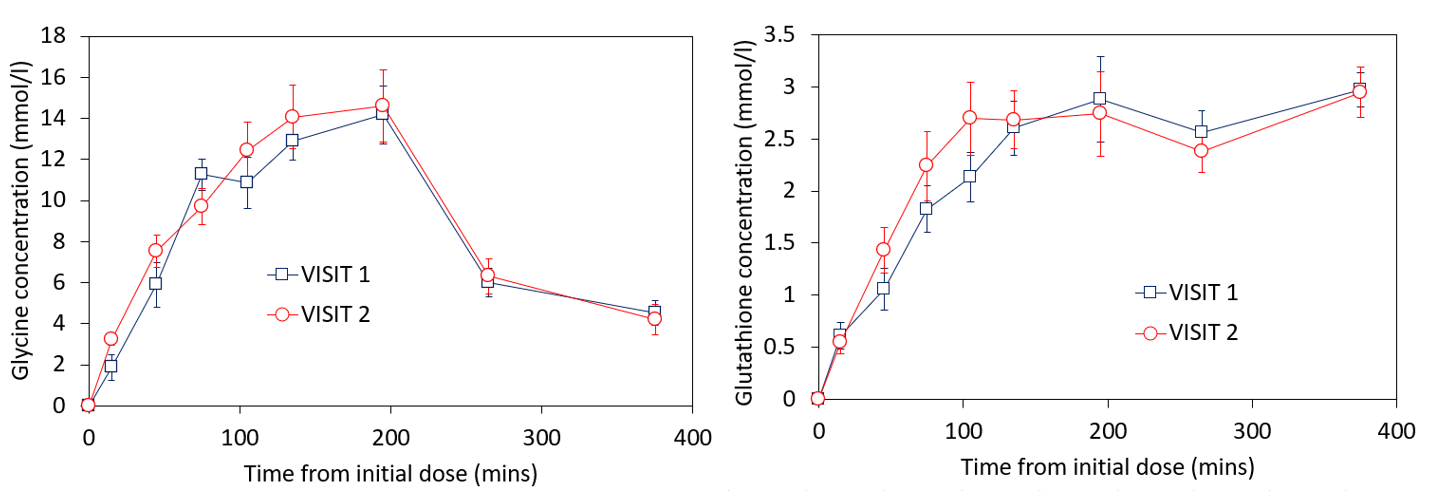
Figure 1 shows the change in phantom signal as the coil-to-phantom distance was changed.The participants change in [2-13C] glycine and [2-13C] glutathione concentration is shown in figures 2-3. Blood glycine levels rose from 0.33±0.07mmol/l at baseline to 1.37±0.27mmol/l at t=180 mins and reduced back to 0.76±0.33mmol/l by t=360 mins. Blood 13C glycine enrichment levels reached a maximum of 79±5%.
The peak hepatic [2-13C] glycine concentration across participants was 15±3mmol/l and 16±5mmol/l for visit 1 and 2 respectively, and the peak [2-13C] glutathione concentration was 3.5±0.5mmol/l and 3.6±0.8mmol/l for visits 1 and 2 respectively. Participant variabilities are shown in figure 4. Without correcting for coil-to-liver distance, the between participant coefficient of variation increased (peak GlutathioneUNCORRECTED CV%=21 and 30%; peak GlycineUNCORRECTED CV%=24 and 31% for visit 1 and 2 respectively)
Discussion
This study describes in vivo quantification of hepatic glycine-to-glutathione synthesis. The coil-to-liver distance had a significant effect on final values. Future studies should account for this, especially with expected variability in patient geometries (e.g. subcutaneous fat).Baseline blood glycine concentrations were similar to expected values (Human Metabolite Data Base, https://hmdb.ca/metabolites/HMDB0000123) and rose by a factor >4, leading to an enrichment of ~80%. This is consistent with the high hepatic [2-13C] glycine concentrations observed (up to 15 ± 3 mmol/l), which were ~10 times larger than physiological concentrations reported elsewhere [7] implying that this test-day protocol does indeed flood the hepatic glycine pool as intended. This also suggests a very high fractional enrichment of 13C glutathione in the liver was achieved due to the higher dosing compared to a previous pilot study (3g x 4) [4].
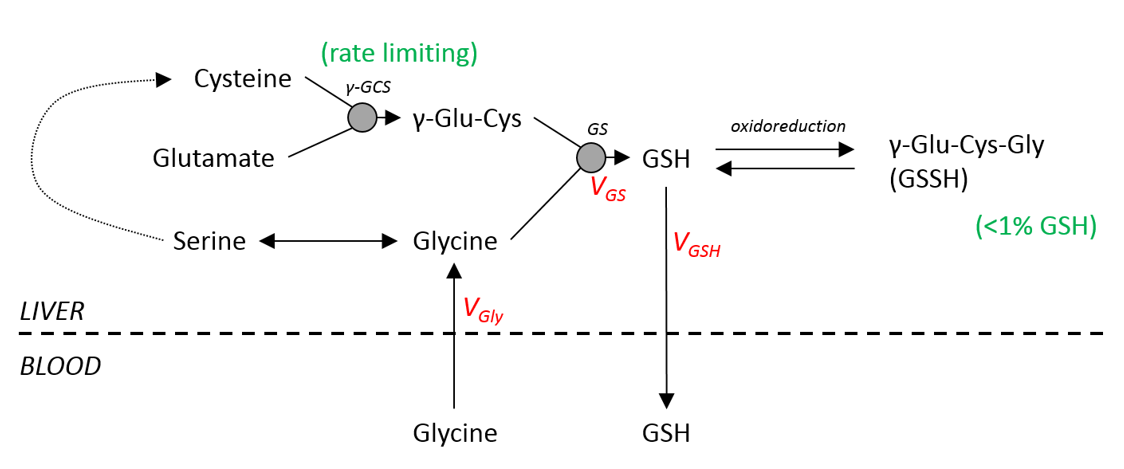
In contrast, the maximum enriched [2-13C] glutathione concentrations were similar to average physiological hepatic glutathione levels [8]. Glutathione synthesis is catalysed by two enzymes, with Glutamate Cysteine Ligase (GCL) thought to be rate limiting so that the flux rate is not dependent on glycine concentration (figure 5). The observation in this study of high glycine concentrations but physiological glutathione levels confirm the assumptions of this metabolic model.
The gradient of glutathione synthesis with time had a much lower variability within participants compared to between participants, indicating that glutathione flux rates measured using this technique are repeatable and provide a reliable means to measure oxidative stress. This can be used in future studies to model metabolic flux in different patient groups and to investigate the effects of drug intervention.
Acknowledgements
No acknowledgement found.References
1. Cichoz-Lach, H. and A. Michalak, Oxidative stress as a crucial factor in liver diseases. World Journal of Gastroenterology, 2014. 20(25): p. 8082-8091.
2. Vairetti, M., et al., Changes in Glutathione Content in Liver Diseases: An Update. Antioxidants, 2021. 10(3).
3. Befroy, D.E., et al., Direct assessment of hepatic mitochondrial oxidative and anaplerotic fluxes in humans using dynamic 13C magnetic resonance spectroscopy. Nat Med, 2014. 20(1): p. 98-102.
4. Skamarauskas, J.T., et al., Noninvasive In Vivo Magnetic Resonance Measures of Glutathione Synthesis in Human and Rat Liver as an Oxidative Stress Biomarker. Hepatology, 2014. 59(6): p. 2321-2330.
5. Bawden, S.J., et al., MRS measurements of [2-13C] glycine conversion to glutathione in the liver: A new method of measuring hepatic oxidative stress defences in vivo. Proceedings 25th Scientific Meeting of the ISMRM, Honolulu, 2017.
6. Bawden, S., et al., Increased liver fat and glycogen stores following high compared with low glycaemic index food: a randomized cross over study. Diabetes Obes Metab, 2016.
7. Barle, H., et al., The concentrations of free amino acids in human liver tissue obtained during laparoscopic surgery. Clinical Physiology, 1996. 16(3): p. 217-227.
8. Jewell, S.A., et al., Decreased Hepatic Glutathione in Chronic-Alcoholic Patients. Journal of Hepatology, 1986. 3(1): p. 1-6.
Figures