2291
Test-retest reliability of in-vivo 31P MRSI of the whole human liver at 7 Tesla using a 31P whole-body transmit coil and 16-channel receive array1Imaging and Oncology, UMC Utrecht, Utrecht, Netherlands
Synopsis
Alterations in 31P metabolite concentrations in the liver can be a consequence of liver disease and therefore 3D 31P MRSI can help in diagnosis and following progression and treatment response. However, commonly used 31P surface coils have a limited penetration depth and do not provide full coverage of the liver. We used an integrated 31P whole-body transmit coil with a local 31P receive array for 31P MRSI of the liver at a 7T MRI scanner. Here we demonstrate that 31P signals can be measured throughout the liver and 31P metabolite levels can be quantified with good to excellent test-retest reliability.
Introduction
Phosphorus magnetic resonance spectroscopy (31P MRS) provides a unique view into energy metabolism and membrane turnover in human tissues, such as the liver1. Global or local changes in 31P metabolite concentrations in the liver can be a consequence of liver disease. For example, an increased ratio of phosphomonoesters (PME) with respect to phosphodiesters (PDE) is indicative of cell proliferation and a characteristic feature of tumor tissue2–4. Therefore, quantitative 3D imaging of 31P metabolites can help in diagnosis and follow-up of diverse liver diseases2–6. However, commonly used 31P surface coils, which have a limited penetration depth, do not provide full coverage of the liver and therefore local liver disease may be missed. Moreover, 31P MRS has a low intrinsic sensitivity, affecting the reliability. With the development of an integrated 31P whole-body transmit coil for a 7T MRI scanner7 in combination with a large receive array, 31P signals can be measured throughout the torso and abdomen with increased sensitivity. The aim of this study was to determine the test-retest reliability of whole-liver 31P MR spectroscopic imaging (MRSI) in healthy subjects at 7T, using a 31P whole-body transmit coil in combination with a 16-channel 31P receive array. In addition, effects of the method for channel combination on the repeatability parameters were investigated.Methods
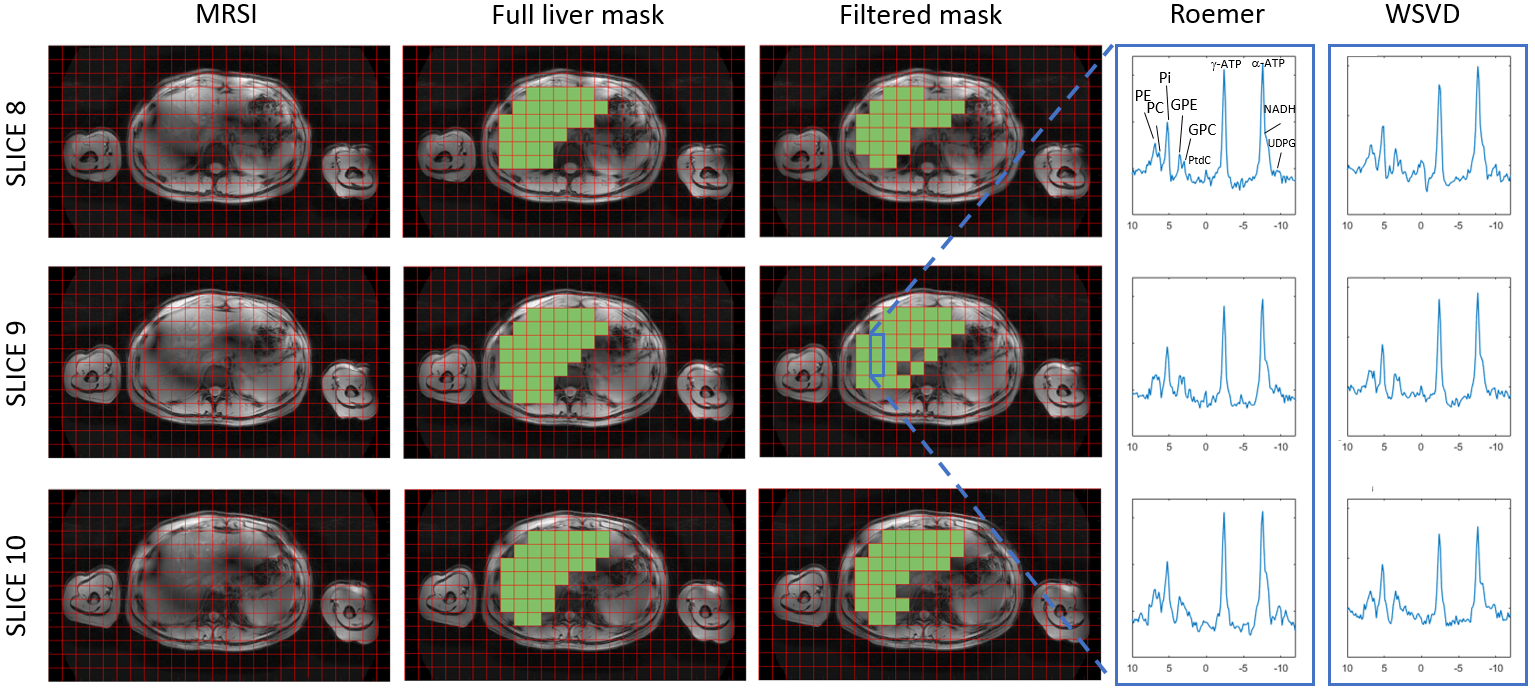
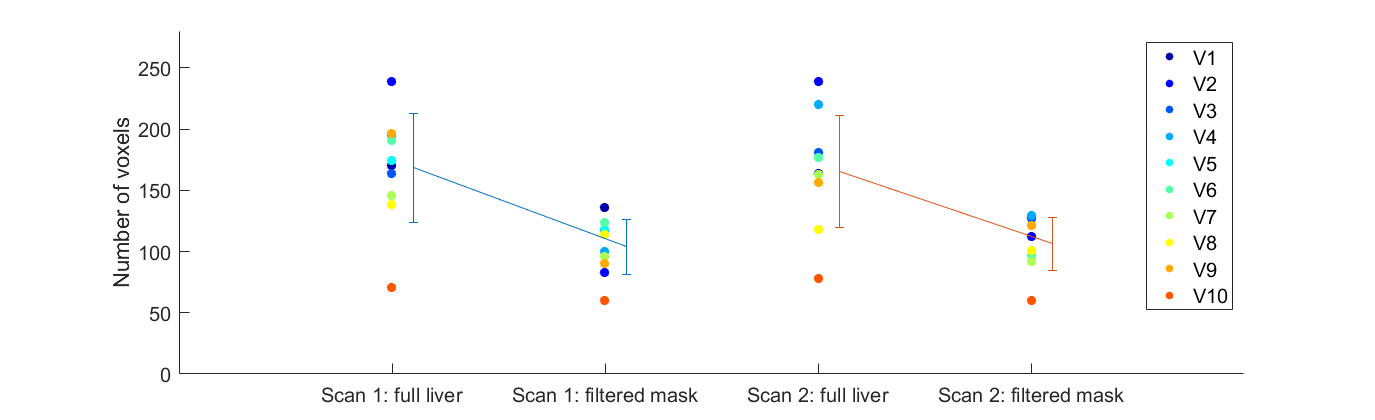
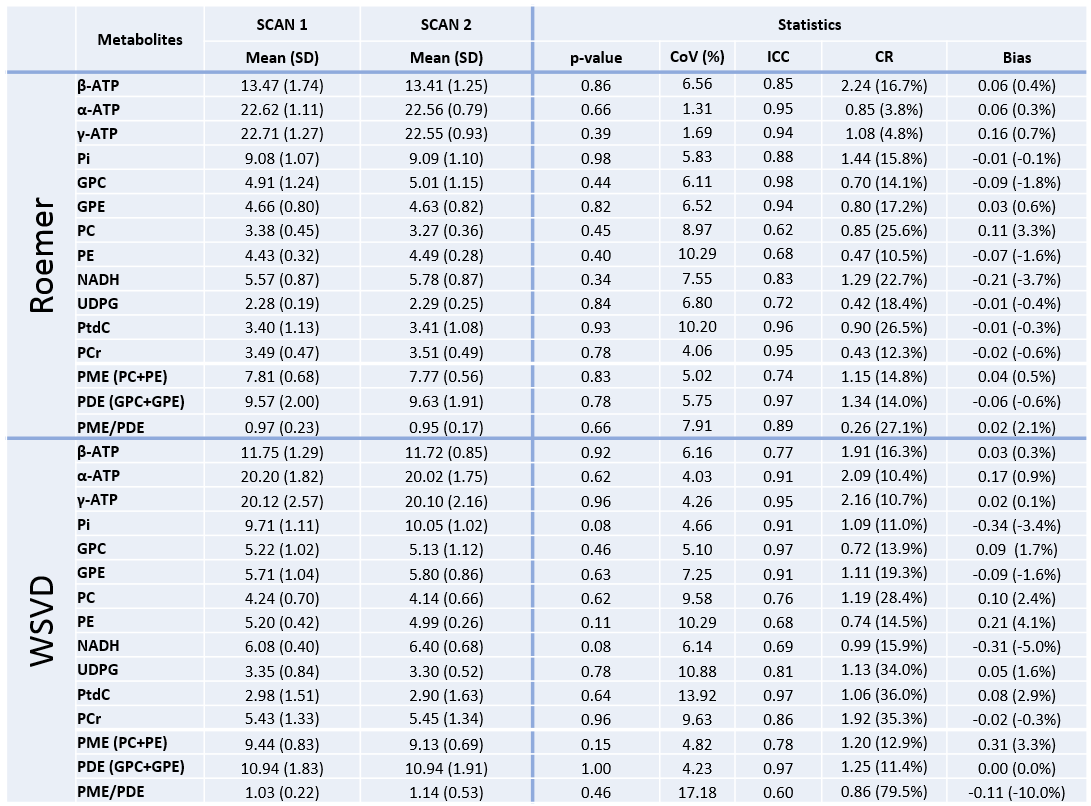
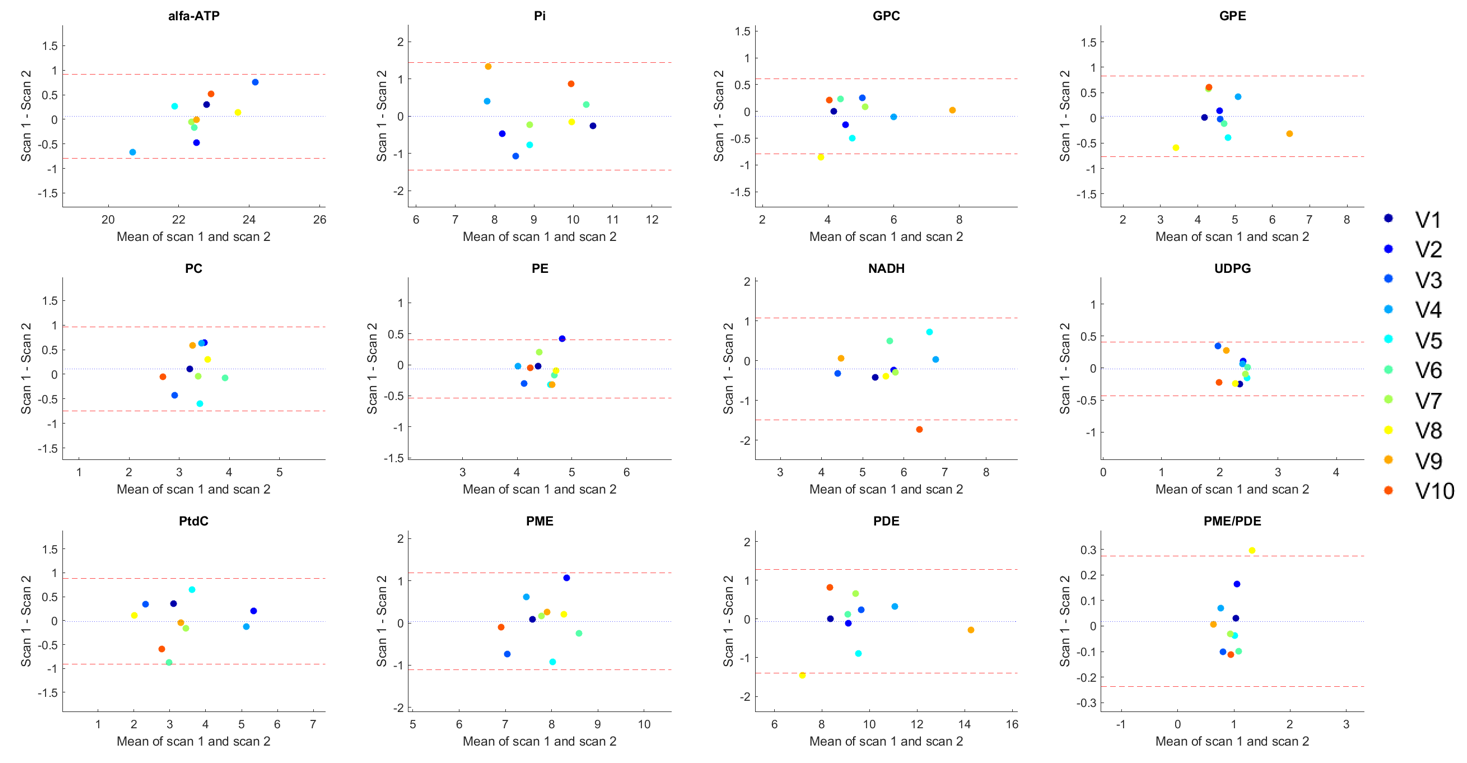
A whole-body 7T MR system (Philips Healthcare, Best, NL) with an in-house designed 31P whole-body birdcage transmit coil (diameter 60cm) was used to perform 31P MRSI at 120.6 MHz7. 31P signals were received with a 16-channel 31P coil array integrated with 8 transmit-receive fractioned 1H dipole antennas8,9. Ten healthy volunteers (four females and six males, age 34±12 (range: 25-62) years, BMI 24±4.0kg/m2) were scanned in a supine position. Each volunteer was scanned twice on the same day. In each scan session, before the 31P MRSI experiments, B0 maps were acquired for B0 shimming and transversal and coronal T1-weighted images were measured with the same field of view and the same number of slices as for 31P MRSI. 31P spectra were acquired with a pulse-acquire sequence with a block pulse (carrier frequency set to phosphocreatine, B1=6μT), followed by phase encoding gradients for 3D spatial encoding. Hamming weighted k-space sampling was used without respiratory gating. For all volunteers we used the same acquisition parameters: FOV=500(LR)×280(AP)×360(FH)mm3, nominal resolution=20mm isotropic, TR=60ms, TE=0.56ms, FA=12°, BW=5000Hz, NSA=20, acquisition time=22:37min. 31P MRSI data were reconstructed and fitted in Matlab R2019a (The Mathworks Inc., Natick, MA). Channel combination was performed with different methods: WSVD10,11 or Roemer12. A full liver mask was manually drawn on T1w images around the liver. The data in the mask was quantified in the time domain using AMARES13 in the spectroscopy fitting tool (OXSA)14,15. Signals from α-, β-, and γ-ATP, inorganic phosphate (Pi), glycerophosphocholine (GPC), glycerophosphoethanolamine (GPE), phosphocholine (PC), phosphoethanolamine (PE), nicotinamide adenine dinucleotide (NADH), uridine diphosphate glucose (UDPG), phosphatidylcholine (PtdC), and phosphocreatine (PCr) were fitted with Lorentzian line shapes with equal line widths, with soft constraints for the chemical shifts and fixed J-couplings for the ATP doublets and triplets. Only voxels within the liver mask which did meet the following criteria were included for further analysis: 1) SNRα-ATP > 5 in either Roemer or WSVD and 2) amplitude PCr < amplitude α-ATP in both Roemer and WSVD. Signal amplitudes were expressed as percentage of the sum of all fitted signals and the results were averaged over all voxels in the filtered liver mask. Repeatability was assessed from Bland-Altman analyses (coefficients of repeatability (CR) and bias), within-subject coefficients of variation (CoV)16, intraclass correlation coefficients (ICC) and t-tests.Results
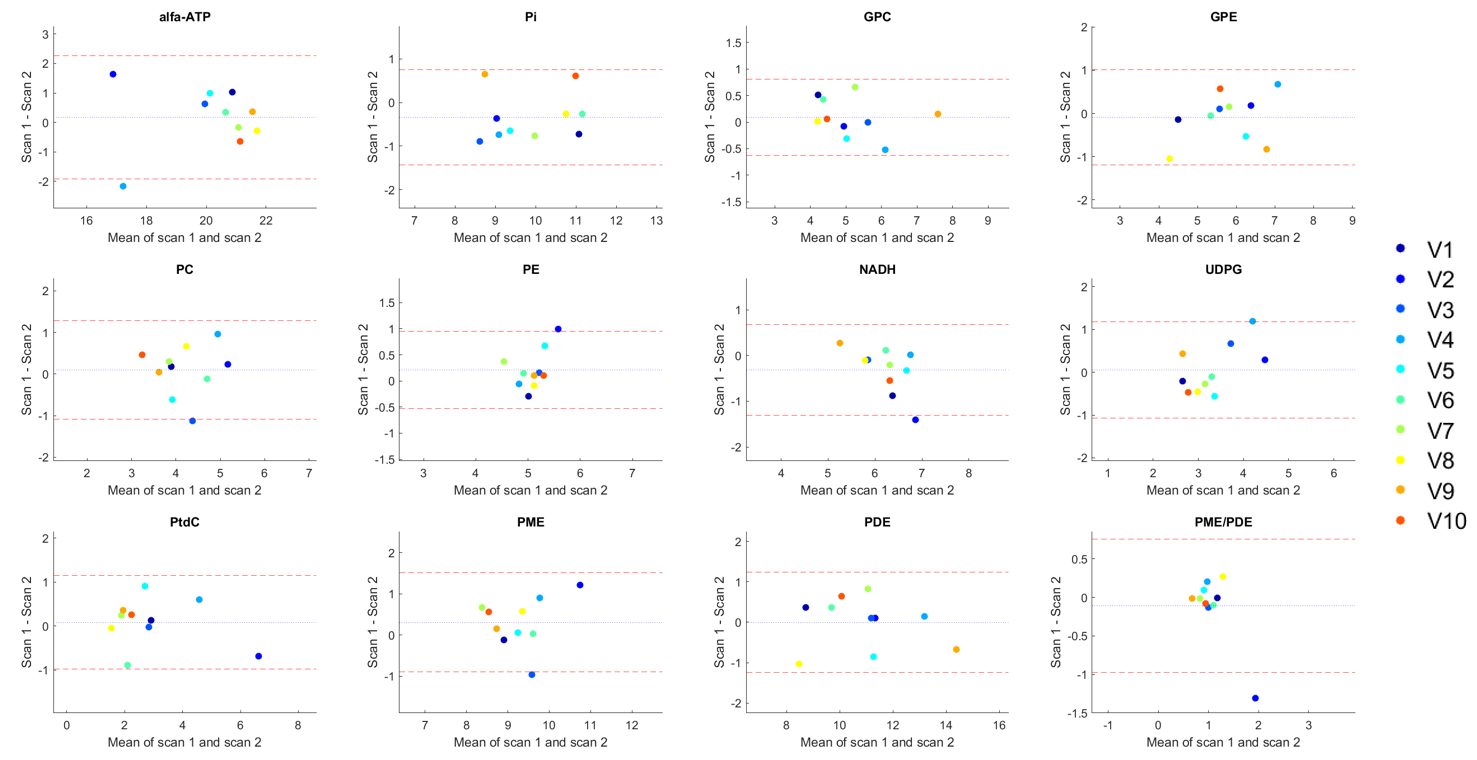
An example of a 31P MRSI grid and the masking of the liver voxels in three slices of subject 1 is shown in Figure 1. On average 105±22 voxels were used for quantification of liver 31P metabolites (Figure 2). Mean values of quantified metabolite levels and the results of the statistical analyses are reported in Figure 3. There were no significant differences in 31P metabolite levels between scan 1 and scan 2 (all p>0.05) and within-subject CoVs were below 10% for most metabolites, for both channel combination methods. The ICC of the metabolites ranged from 0.62 to 0.98 for Roemer and 0.60 to 0.97 for WSVD. Bland-Altman analyses showed no systematic biases and CR values ranging from 3.8% to 26.5% for Roemer and 10.4% to 36.0% for WSVD, when excluding the PME/PDE ratio (Figures 3- 5). For WSVD, the CoV (17.18%), CR (79.5%) and bias (-10.0%) for PME/PDE were relatively high due to one outlier. Although quantification results differed significantly between Roemer and WSVD reconstructions, test-retest reliability was not significantly different.Discussion and Conclusion
On average, 66% of the voxels in the 31P MRSI liver mask passed the quality criteria. Thus, using a 31P whole-body transmit coil in combination with a 16-channel 31P receive array at 7T provides 31P MR data with large liver coverage. We showed good to excellent repeatability of quantified 31P metabolite levels, even for most of the low-concentration metabolites such as PC, PE, GPC and GPE, irrespective of the channel combination method. This study demonstrates that 31P MRSI could be a robust tool to monitor treatment response in liver diseases.Acknowledgements
H2020-FETopen:NICIReferences
1. Valkovic L, Chmelik M, Krššák M. In-vivo 31P-MRS of skeletal muscle and liver: A way for non-invasive assessment of their metabolism. Anal Biochem. 2017;529:193-215.
2. Panda A, Jones S, Stark H, et al. Phosphorus liver MRSI at 3 T using a novel dual-tuned eight-channel 31P/1H coil. Magn Reson Med. 2012;68(5):1346-1356. doi:10.1002/mrm.24164
3. Brinkmann G, Melchert UH. A study of T1-weighted 31Phosphorus MR-spectroscopy from patients with focal and diffuse liver disease. Magn Reson Imaging. 1992;10:949-956.
4. Cox IJ, Menon DK, Sargetoni J, et al. Phosphorus-31 magnetic resonance spectroscopy of the human liver using chemical shift imaging techniques. J Hepatol. 1992;14:265-275.
5. Noren B, Dahlqvist O, Lundberg P, et al. Separation of advanced from mild fibrosis in diffuse liver disease using 31P magnetic resonance spectroscopy. Eur J Radiol. 2008;66(2):313-320. doi:10.1016/j.ejrad.2007.06.004
6. Dagnelie PC, Leij-Halfwerk S. Magnetic resonance spectroscopy to study hepatic metabolism in diffuse liver diseases, diabetes and cancer. World J Gastroenterol. 2010;16(13):1577-1586. doi:10.3748/wjg.v16.i13.1577
7. Löring J, van der Kemp WJM, Almujayyaz S, van Oorschot JWM, Luijten PR, Klomp DWJ. Whole-body radiofrequency coil for 31P MRSI at 7T. NMR Biomed. 2016;29(6):709-720. doi:10.1002/nbm.3517
8. Raaijmakers AJE, Italiaander M, Voogt IJ, et al. The fractionated dipole antenna: A new antenna for body imaging at 7 Tesla. Magn Reson Med. 2016;75(3):1366-1374. doi:10.1002/mrm.25596
9. van Houtum Q, Mohamed Hoesein FAA, Verhoeff JJC, et al. Feasibility of 31P spectroscopic imaging at 7 T in lung carcinoma patients. NMR Biomed. 2019;(May 2019):1-8. doi:10.1002/nbm.4204
10. Rodgers CT, Robson MD. Coil Combination for Receive Array Spectroscopy: Are Data-Driven Methods Superior to Methods Using Computed Field Maps? Magn Reson Med. 2016;75(2):473-487.
11. Rodgers CT, Robson MD. Receive Array Magnetic Resonance Spectroscopy: Whitened Singular Value Decompostion (WSVD) Gives Optimal Bayesian Solution. Magn Reson Med. 2010;63:881-891.
12. Roemer PB, Edelstein WA, Hayes CE, Souza SP, Mueller OM. The NMR Phased Array. Magn Reson Med. 1990;16:192-225.
13. Vanhamme L, Van Den Boogaart A, Van Huffel S. Improved Method for Accurate and Efficient Quantification of MRS Data with Use of Prior Knowledge. J Magn Reson. 1997;129(1):35-43. doi:10.1006/jmre.1997.1244
14. Purvis LAB, Clarke WT, Biasiolli L, Robson MD, Rodgers CT. Line-width constraints in Matlab AMARES using pre-Metabolite T2 and per-Voxel Delta B0. In: In Proceedings of the 22nd Annual Meeting of ISMRM. ; :2885.
15. Purvis LAB, Clarke WT, Biasiolli L, Valkovic L, Robson MD, Rodgers CT. OXSA: An open-source magnetic resonance spectroscopy analysis toolbox in MATLAB. PLoS One. 2017;12(9).
16. Hyslop NP, White WH. Estimating Precision USing Duplicate Measurements. J Air Waste Manage Assoc. 2009;59:1032-1039. doi:10.3155/1047-3289.59.9.1032
Figures