2290
L-carnitine Supplementation used as a Tool for Detecting Hepatic Flexibility of Acetylcarnitine using 1H Magnetic Resonance Spectroscopy.1University of Oxford, Oxford, United Kingdom, 2Oxford University Hospitals, Oxford, United Kingdom
Synopsis
This study investigated the in vivo effects on acetylcarnitine levels in the liver after an injection of L-carnitine. L-carnitine facilitates transport of fatty acids into the mitochondria. We show that a single injection of L-carnitine modulated acetylcarnitine levels in the liver and that it modulated several blood markers in the healthy volunteer. Further studies are needed to understand the plasma metabolic changes observed with L-carnitine supplementation.
Introduction
The global prevalence of Non-Alcoholic Fatty Liver Disease(NAFLD) is 25%[1]. Patients with NAFLD have metabolic disturbance of fatty acids(FA). Free L-carnitine is critical for transportation of FA to the mitochondria, but also for modulation of intracellular acetyl-CoA/CoA ratio, controlling the balance between carbohydrate and FA Oxidation (FAO). Acylcarnitine species are intermediates of FAO. Plasma acylcarnitine species (except acetylcarnitine(AC) and free L-carnitine) are elevated in patients with NAFLD and are associated with disease progression[2]. Treatments with L-carnitine have shown improved outcomes in NAFLD[3], but more studies are needed to understand tissue and plasma levels of AC and free L-carnitine. Tissue AC can be quantified non-invasively using long echo time 1H-MRS[4]. The aim of this study was to establish the reproducibility of AC measurements in the liver using 1H-MRS and to assess changes in liver AC in healthy volunteers after an injection of L-carnitine. Multiparametric MRI was also used for liver tissue characterisation[fat (liver proton density fat fraction (PDFF) [1]), iron (T2*[5]), fibrosis / inflammation (T1 mapping[7])].Method
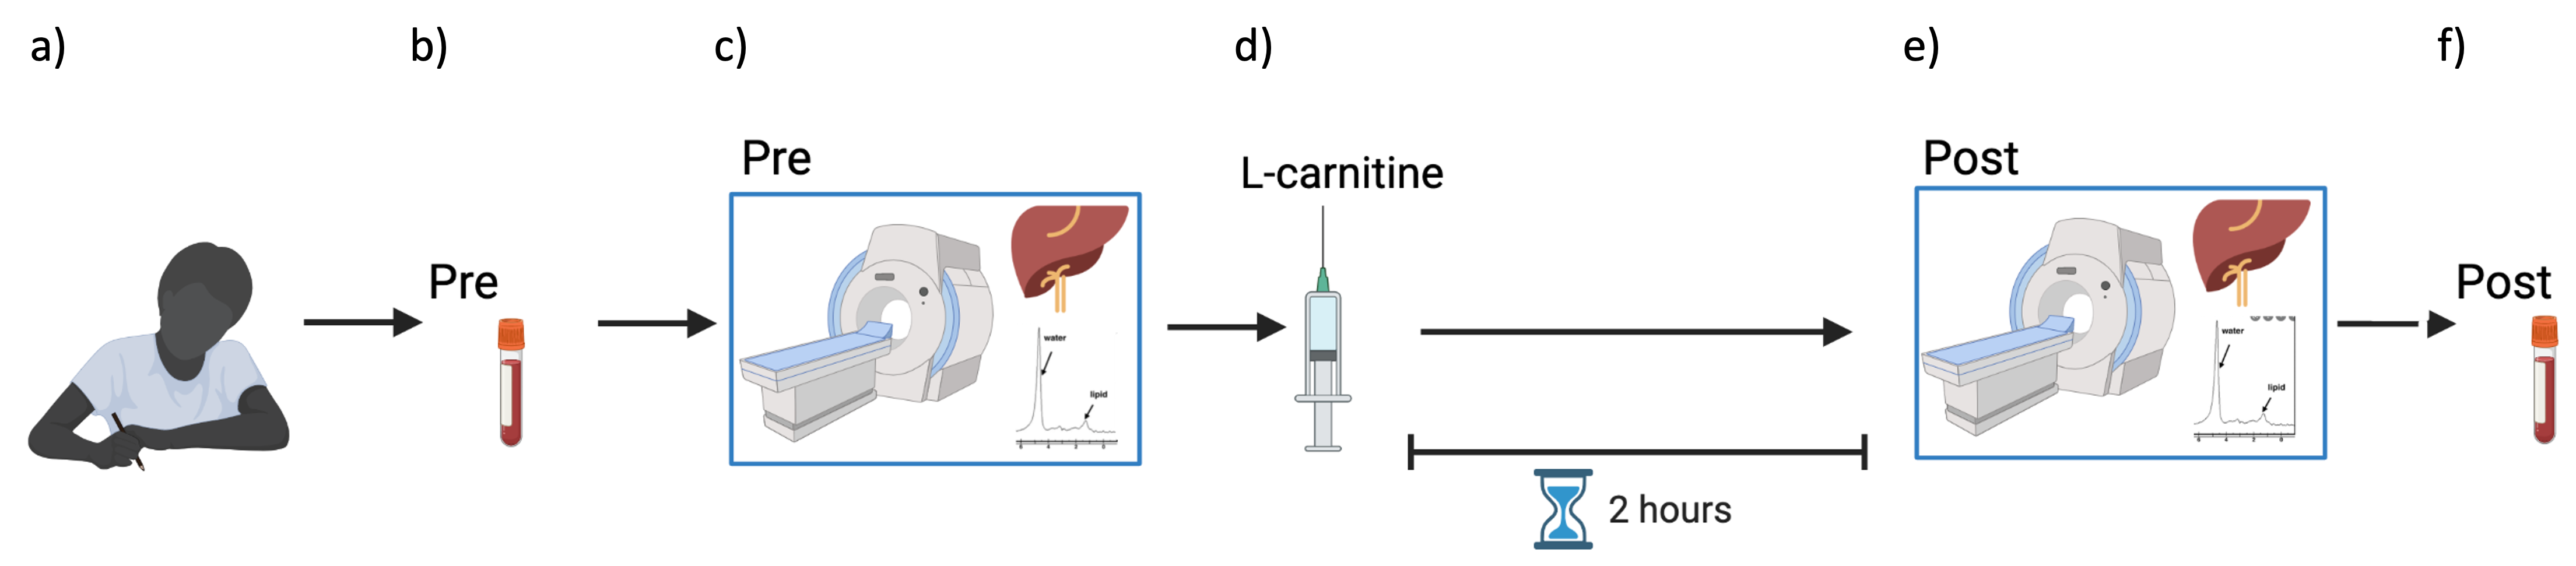
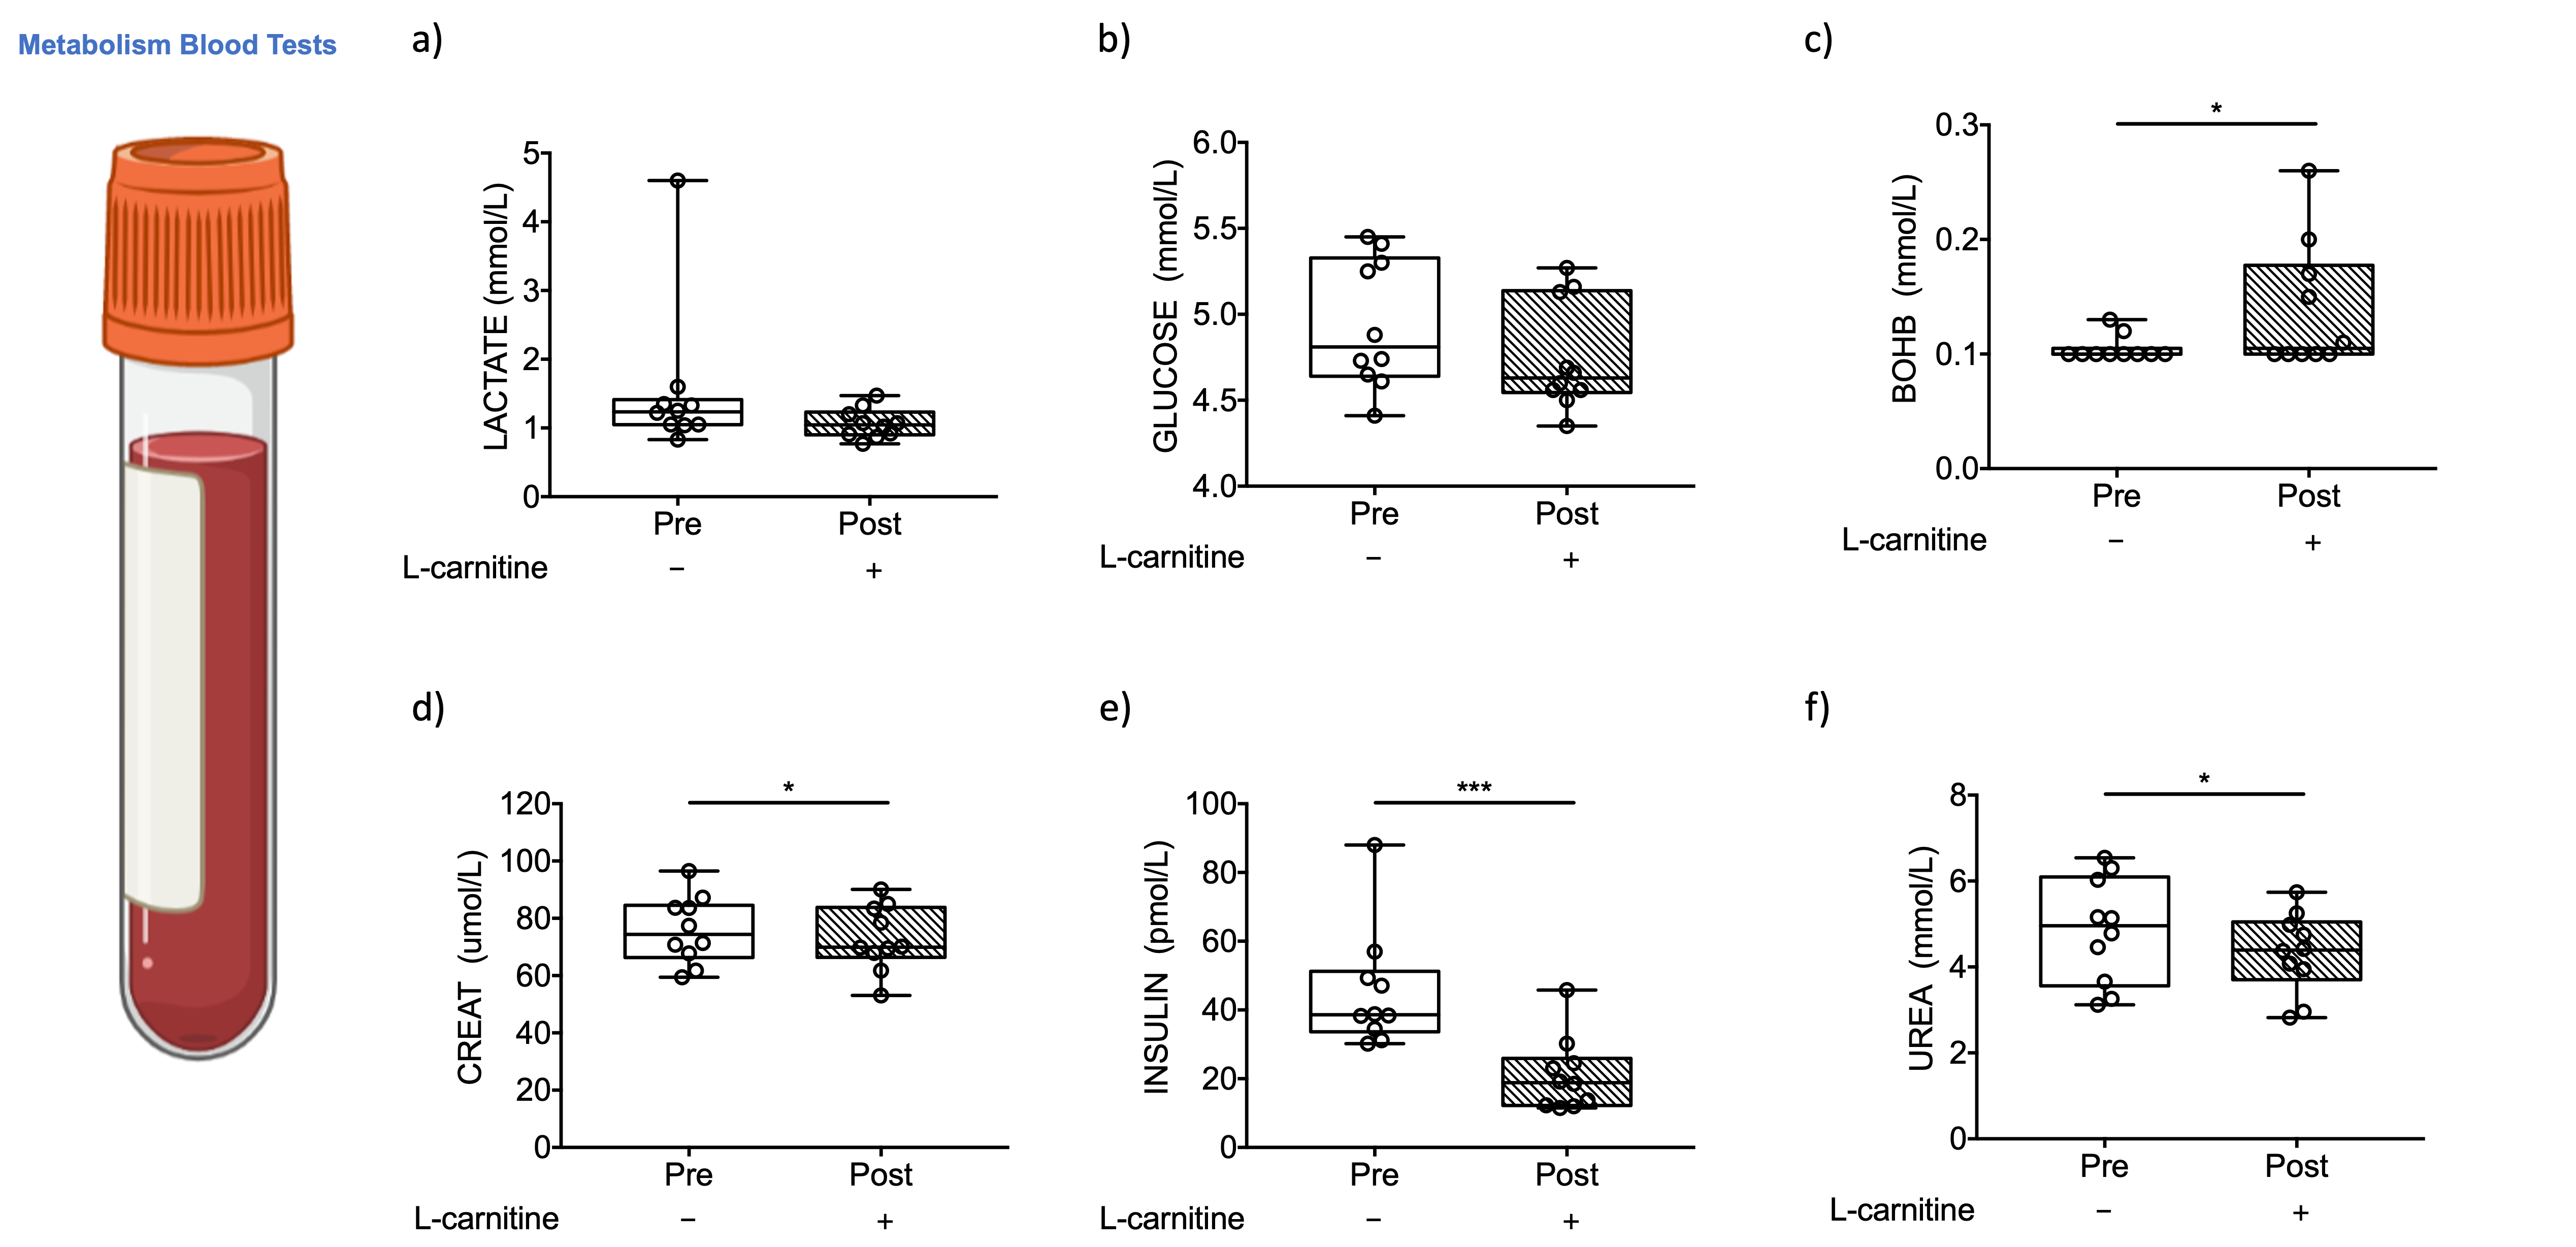
Fifteen healthy volunteers with no history of liver disease attended for a research visit after an overnight fast. Baseline liver 1H-MRS & MRI was acquired on a 3T system (Prisma, Siemens Healthineers) using a 30-channel phased array coil and a spine coil. Liver images were acquired in a single axial slice. T1 was measured using a shortened modified Look-Locker inversion (shMOLLI) recovery acquisition (matrix: = 192 x 144, TR = 2.41ms, TE =1.05ms), PDFF and T2* values were quantified using a multi-echo spoiled GRE sequence (TEmin=1.1ms, DTE=1.1ms). AC was quantified in the liver using a STEAM acquisition (64 averages, TE=90 ms, TR=4s, voxel size: 30×30×30mm3) allowing for free breathing, and methylene fat [8] were measured using a STEAM acquisition (TE=10ms,TR=2s for water-suppressed spectra and TR=4s for non-water suppressed spectra, voxel size:20x20x20mm3). Iron correction of T1 values was performed according to Tunnicliffe et al. [9]. Following baseline MRI, ten of the volunteers (Vol) were given an intravenous injection of 50mg/kg body weight of L-carnitine (Carnitor, Alfasigma S.p.A. Italy) and two hours post-supplementation the MRI protocol was repeated (Figure 1). The OXSA toolbox in Matlab[10] was used to fit all spectral peaks. Hepatic spectra were frequency-aligned (using the residual water signal), phased and averaged before fitting with the OXSA toolbox. Blood samples were acquired at baseline and 3 hours after L-carnitine supplementation. Bloods were analysed using standard laboratory methods using the Abbott Architect i2000 for insulin and the c16000 analyser for all other markers(Figure 2,4-5). Five healthy control volunteers (CTR) were scanned to investigate the reproducibility of multiparametric images and AC assessment using the same protocol. The CTR group had no L-carnitine supplementation, and no blood samples were taken.Results
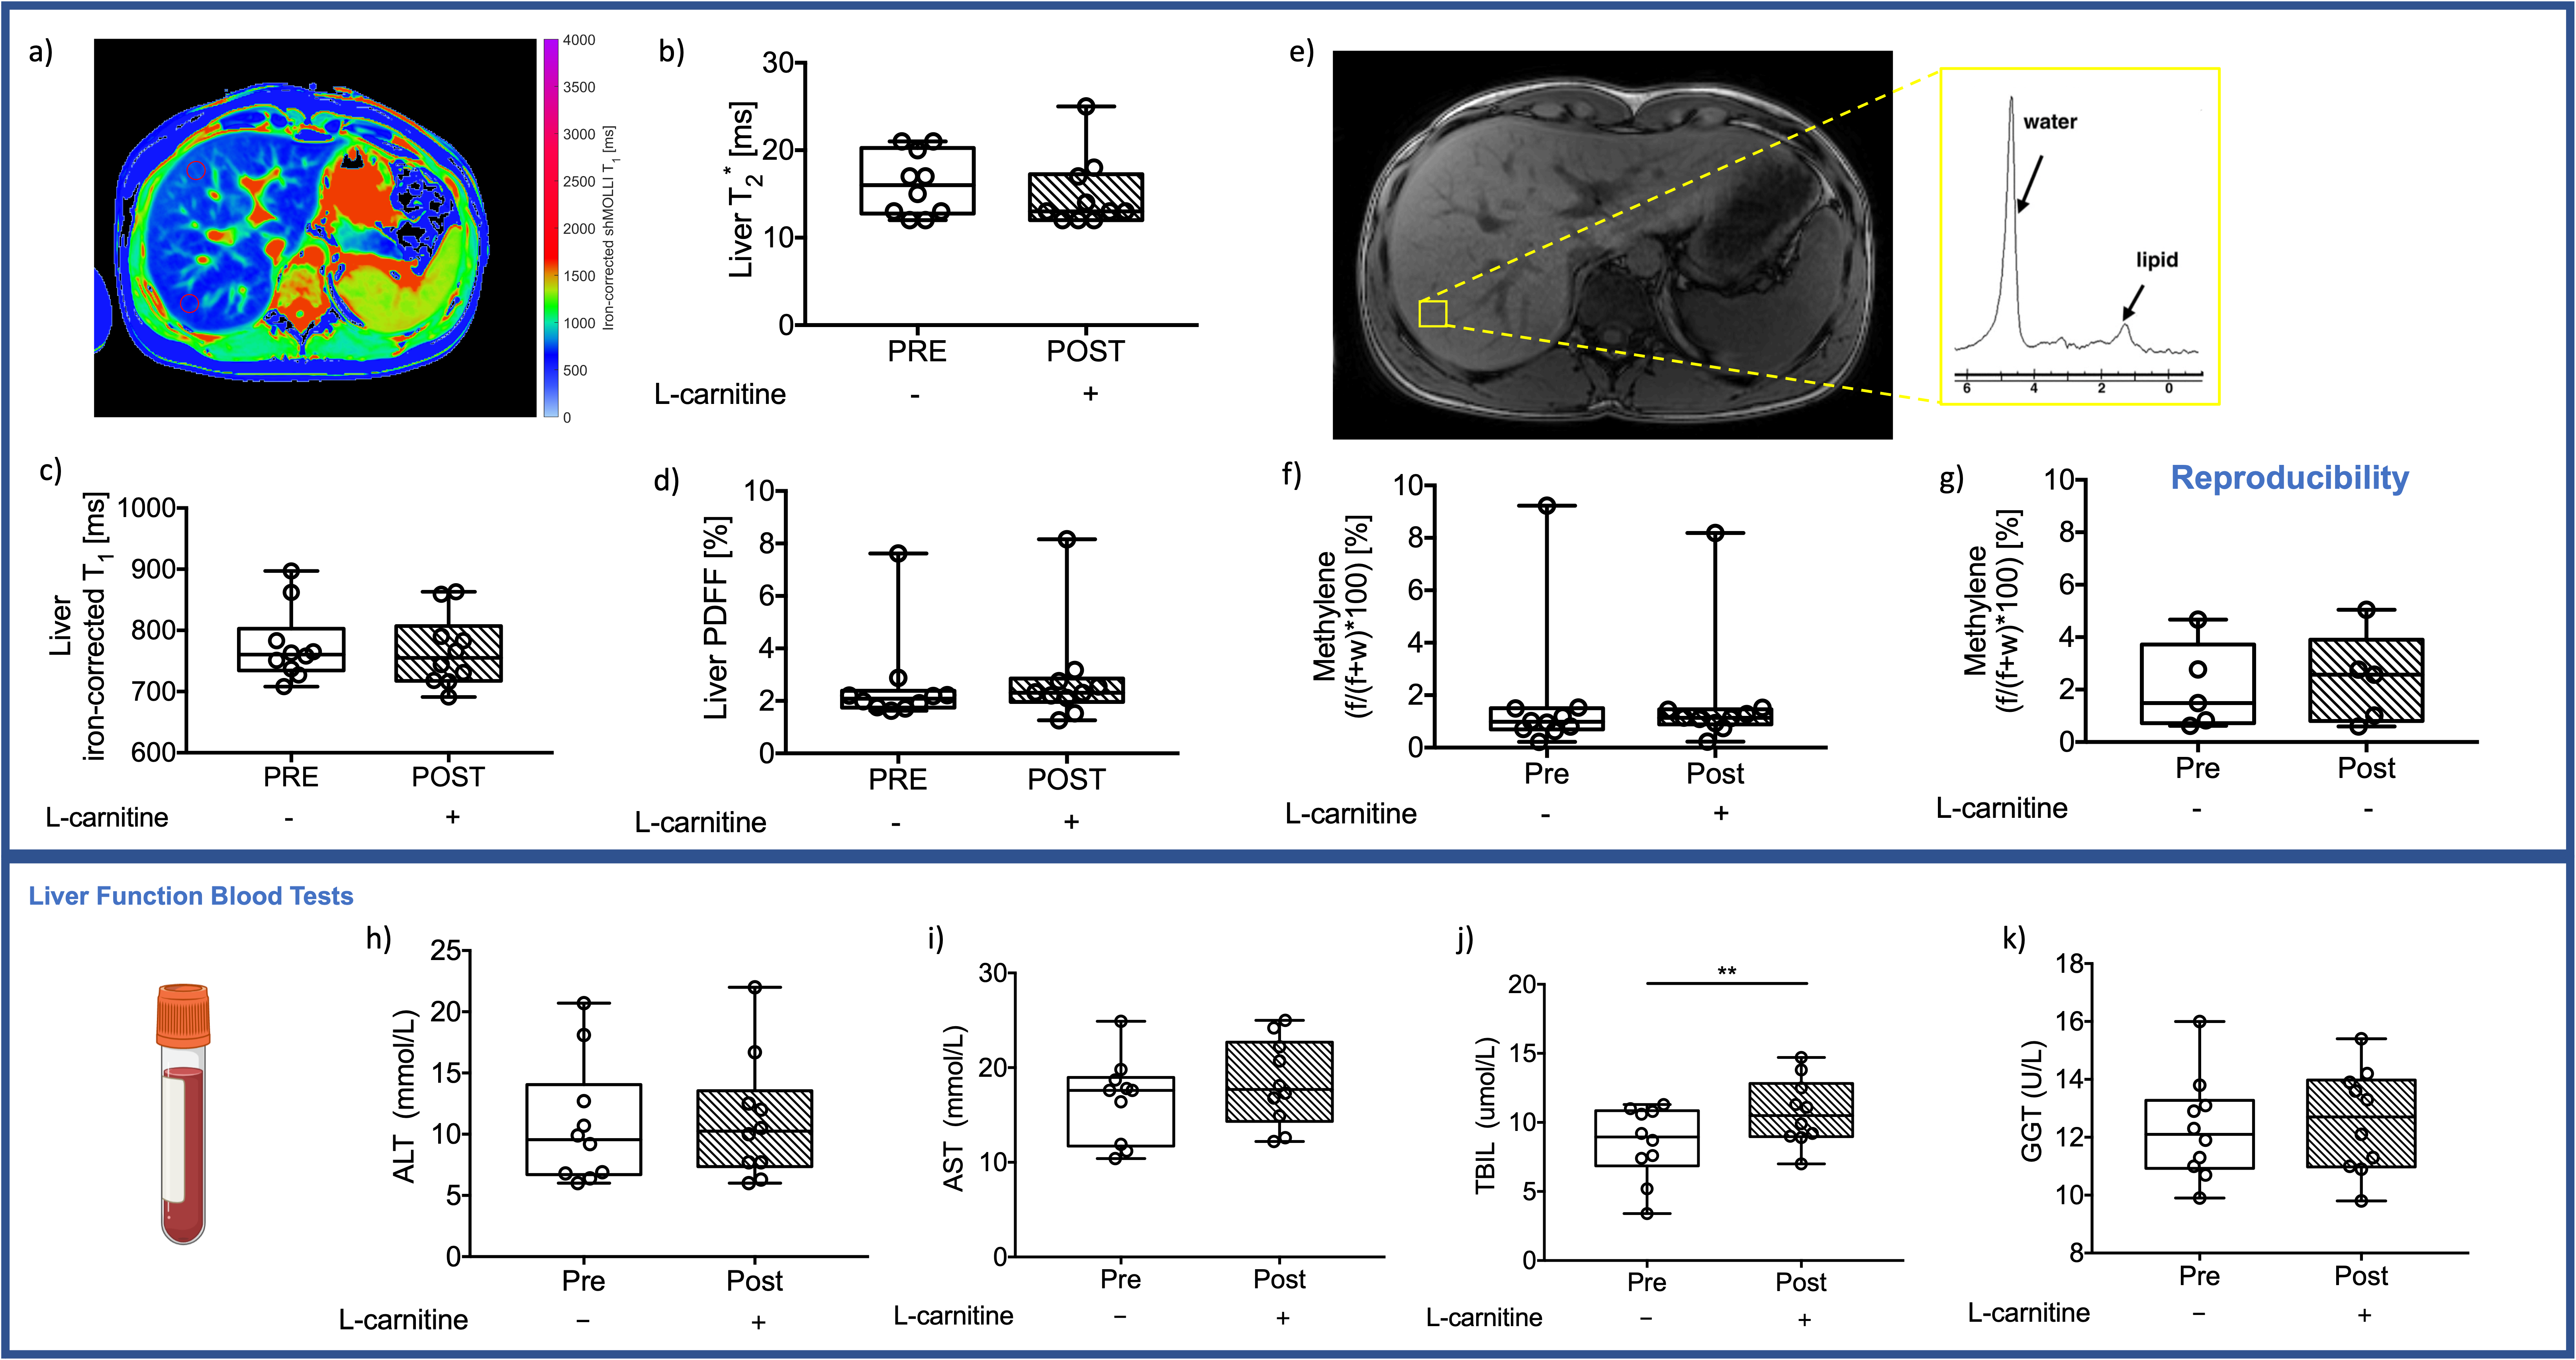
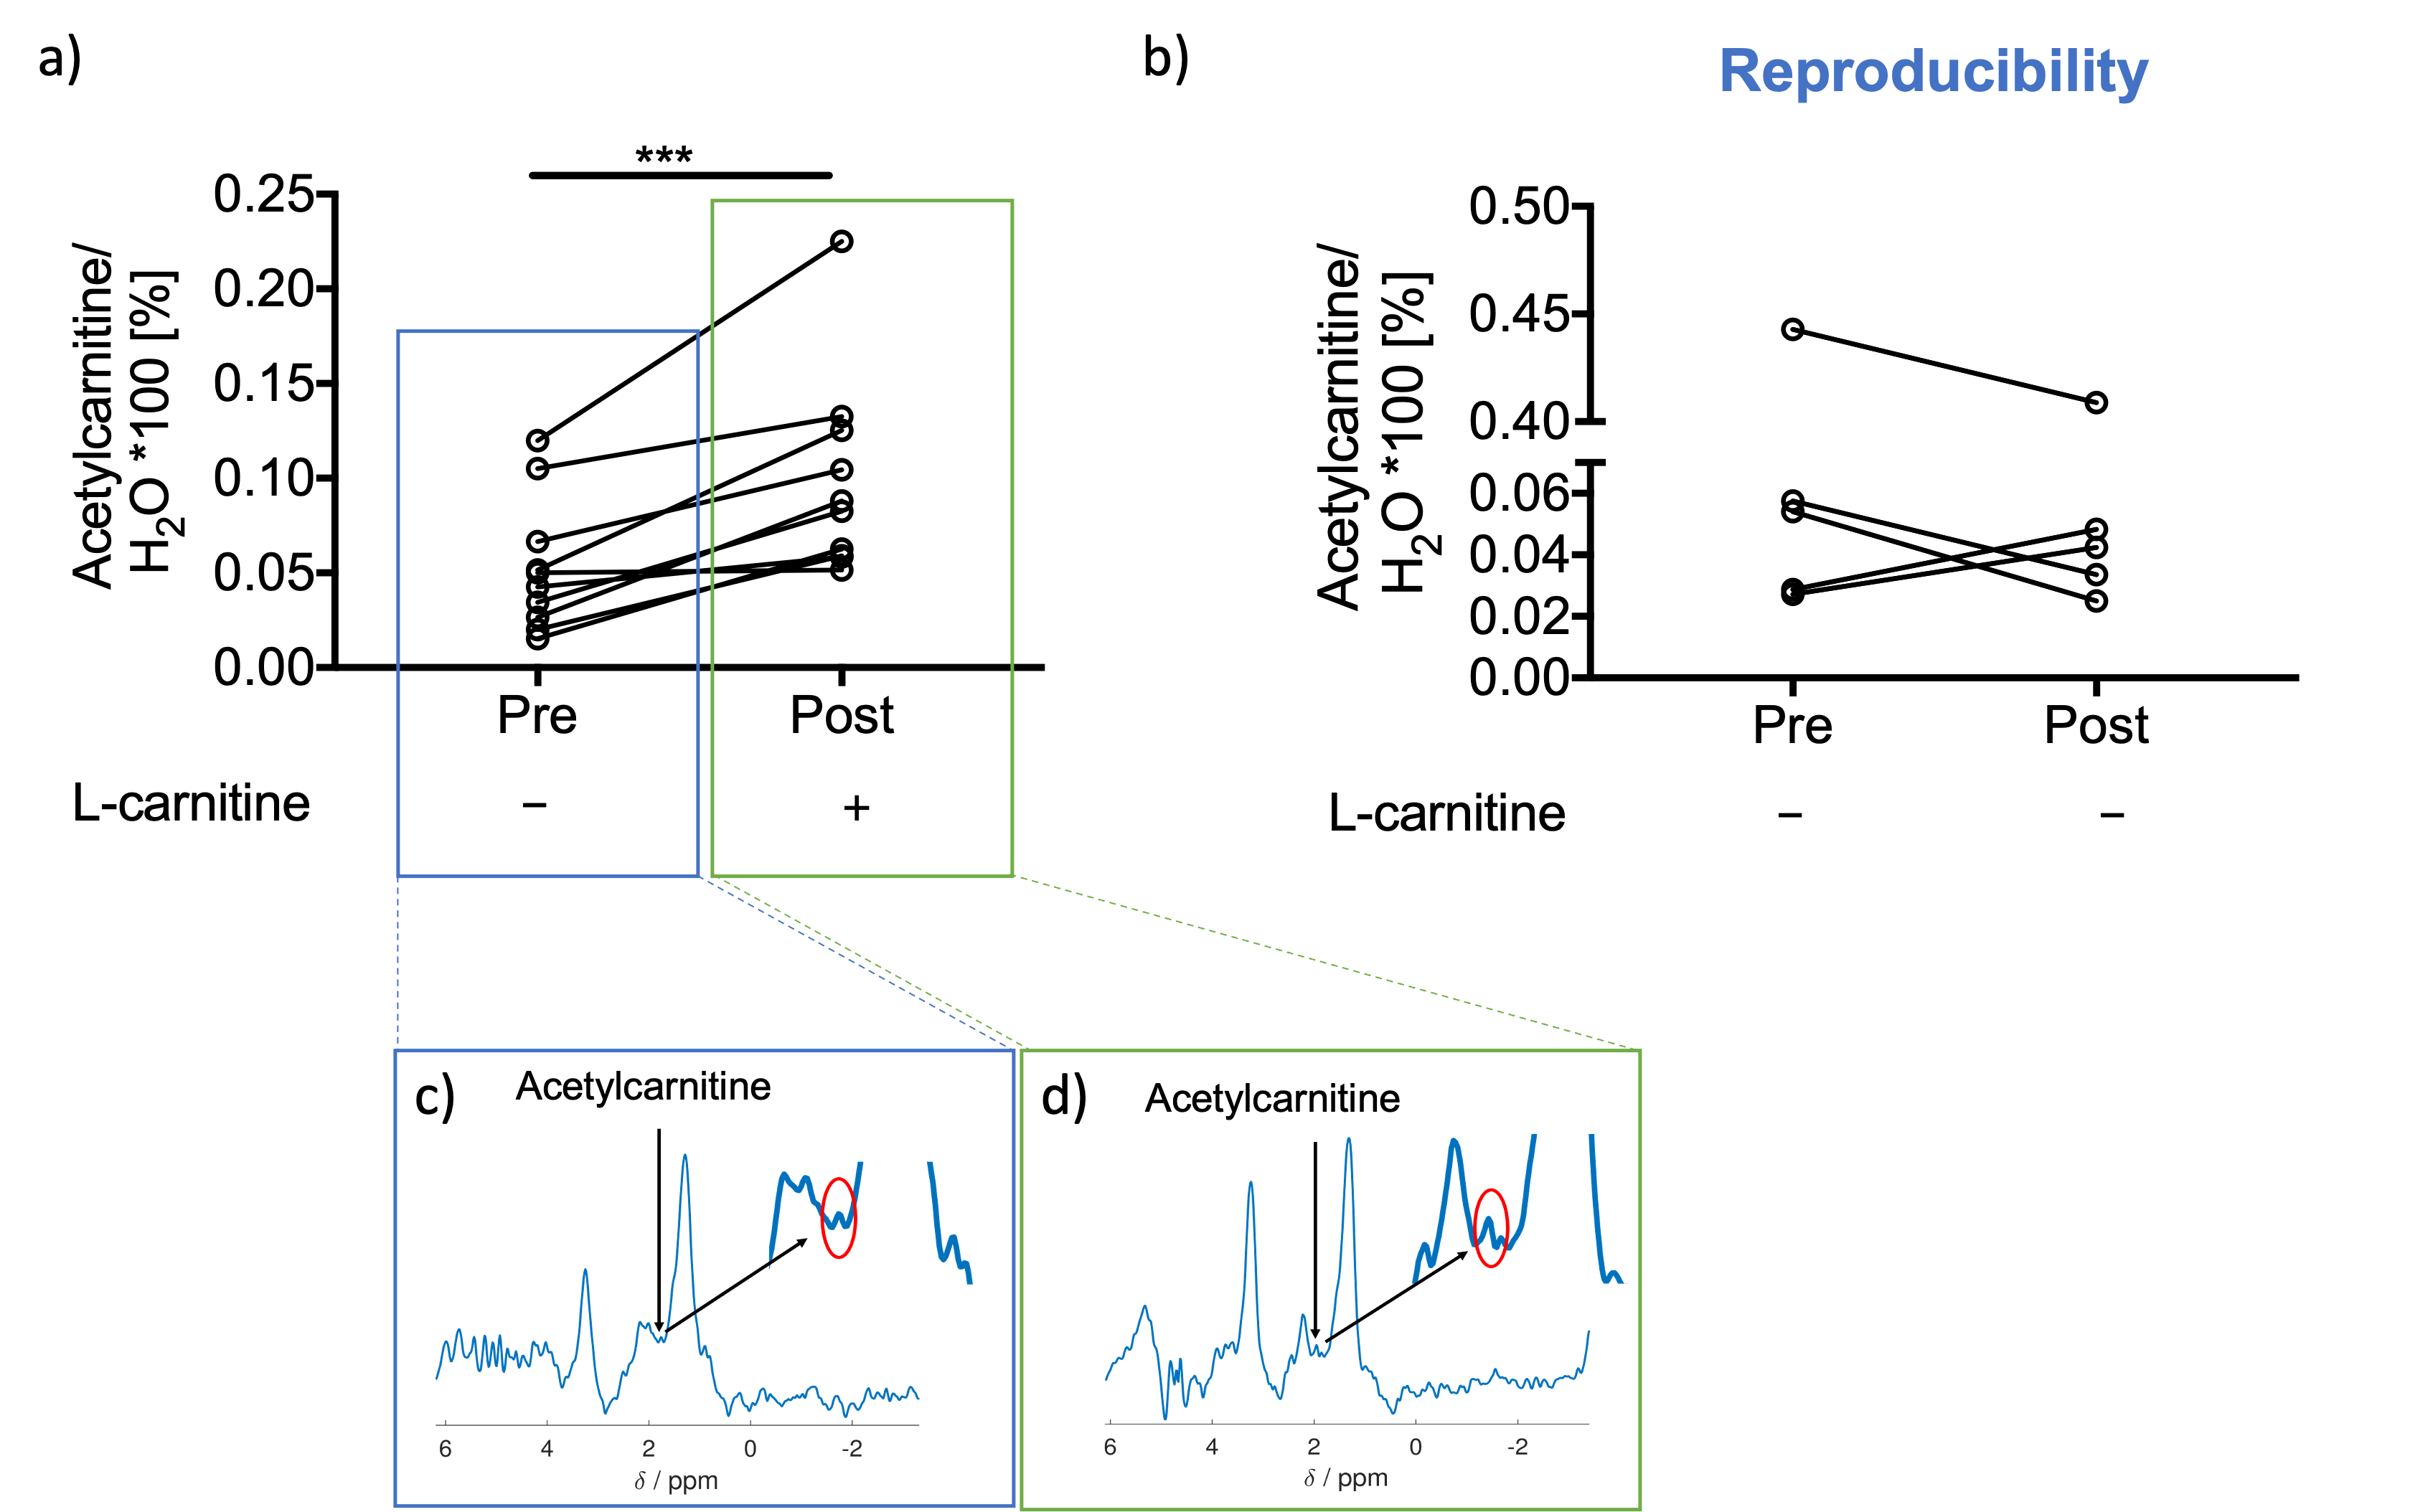
Results were obtained from ten volunteers (n=10, age=33±9yr, BMI=23±2kg/m2) and from five controls to test for reproducibility (n=5, age=34±3yr, BMI=24±2kg/ m2). There were no changes observed in liver composition evaluated with MR imaging to measure T2*, iron-corrected T1, PDFF or in methylene. However, there was one volunteer with elevated PDFF (7.6%), iron-corrected T1(862ms) and methylene (9.2%). Most liver blood tests were unchanged with L-carnitine supplementation (Figure 2).L-carnitine supplementation elevated liver AC levels by 86% (paired t-test,p=0.0009, Figure 3a), while there was no change in the control group. AC levels from the two scans in the control group were correlated significantly with a slope of 0.92 (Pearson correlation, R2=0.98,p=0.0009, Figure 3b).
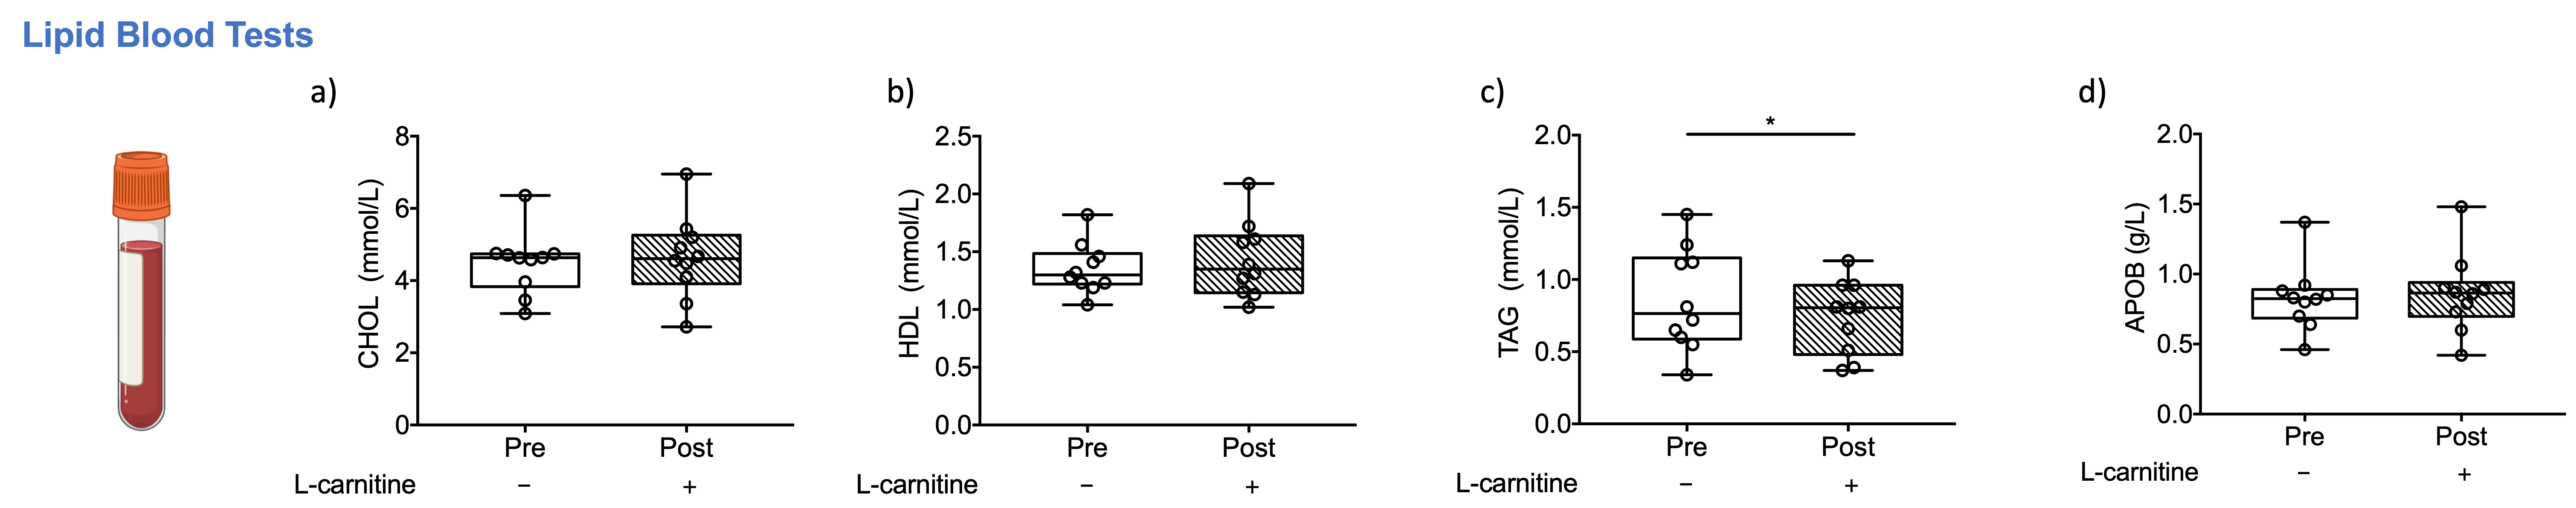
Despite no changes seen in methylene fat (Figure 2f), there was a 14% significant reduction of plasma triglycerides (TAG) after L-carnitine supplementation (paired t-test, p=0.05, Figure 4c). Cholesterol, HDL and ApoB did not change after L-carnitine supplementation (Figure 4).
Lactate and glucose did not change with supplementation (Figure 5a-b), but the ketone body beta-hydroxybutyrate was elevated by 32% (paired t-test, p=0.05, Figure 5c), creatine dropped by 3mmol/l (paired t-test, p=0.002, Figure 5d), insulin decreased by 53%(paired t-test, p=0.0009, Figure 5e), and urea decreased barely by 0.5mmol/L (paired t-test, p=0.05, Figure 5e).
Discussion and Conclusion
The liver MRI showed no sign of NAFLD in the volunteers, although one volunteer had elevated PDFF, methylene, and iron-corrected T1, however, the same volunteer had reduced TAG after L-carnitine supplementation. Previous data showed that 24h or longer fasting periods elevate plasma CHOL, HDL and TAG levels in healthy volunteers[11]. This study showed a significant reduction of TAG levels with L-carnitine supplementation, despite the fasting. We also found that L-carnitine can modulate liver characteristics by elevating liver AC in vivo. AC levels were highest in the volunteer that had elevated fat fraction on MRI, but even if this patient was excluded, L-carnitine supplementation significantly elevated liver AC levels. The liver AC changes were not observed in the CTR group undergoing only fasting, where the values were correlated as expected. It is unclear whether the changes in insulin and beta-hydroxybutyrate were due to fasting or L-carnitine supplementation. There were changes in other systemic metabolites too (e.g. Urea, TBIL, and CREAT), that needs further investigation. For the first time, we show that liver AC levels are altered in vivo after one dose of L-carnitine supplementation, and 1H-MRS might prove to be useful to characterise patients with compromised fatty acid metabolism, in diseases such as NAFLD.Acknowledgements
This study was funded by a grant awarded to DS (Oxfordshire Health Services Research reference: 2019/1333). LV is supported by a Sir Henry Dale Fellowship of the Wellcome Trust and the Royal Society [#221805/Z/20/Z] and would also like to acknowledge the support of the Slovak Grant Agencies VEGA [2/0003/20] and APVV [#19–0032]. Furthermore, we would like to acknowledge the Novo Nordisk fellowship (DS) and mentor Mette Skalshøj Kjær for her expertise on liver metabolism. MP is supported by the Oxford NIHR Biomedical Research Centre.References
[1] Z. M. Younossi, A. B. Koenig, D. Abdelatif, Y. Fazel, L. Henry, and M. Wymer, “Global epidemiology of nonalcoholic fatty liver disease—Meta-analytic assessment of prevalence, incidence, and outcomes,” Hepatology, vol. 64, no. 1, pp. 73–84, Jul. 2016, doi: 10.1002/HEP.28431.
[2] K. Enooku et al., “Altered serum acylcarnitine profile is associated with the status of nonalcoholic fatty liver disease (NAFLD) and NAFLD-related hepatocellular carcinoma,” Scientific Reports 2019 9:1, vol. 9, no. 1, pp. 1–9, Jul. 2019, doi: 10.1038/s41598-019-47216-2.
[3] M. Malaguarnera et al., “L-Carnitine Supplementation to Diet: A New Tool in Treatment of Nonalcoholic Steatohepatitis—A Randomized and Controlled Clinical Trial,” American Journal of Gastroenterology, vol. 105, no. 6, pp. 1338–1345, Jun. 2010, doi: 10.1038/ajg.2009.719.
[4] R. Klepochová et al., “Detection and Alterations of Acetylcarnitine in Human Skeletal Muscles by 1H MRS at 7 T,” Investigative Radiology, vol. 52, no. 7, p. 412, 2017, doi: 10.1097/RLI.0000000000000355.[5] H. R. Wilman et al., “Characterisation of liver fat in the UK Biobank cohort,” PLOS ONE, vol. 12, no. 2, p. e0172921, Feb. 2017, doi: 10.1371/JOURNAL.PONE.0172921.
[6] J. J. Schaapman, M. E. Tushuizen, M. J. Coenraad, and H. J. Lamb, “Multiparametric MRI in Patients With Nonalcoholic Fatty Liver Disease,” Journal of Magnetic Resonance Imaging, vol. 53, no. 6, pp. 1623–1631, Jun. 2021, doi: 10.1002/JMRI.27292.
[7] B. R et al., “Multiparametric magnetic resonance for the non-invasive diagnosis of liver disease,” Journal of hepatology, vol. 60, no. 1, pp. 69–77, Jan. 2014, doi: 10.1016/J.JHEP.2013.09.002.
[8] R. Banerjee et al., “Multiparametric magnetic resonance for the non-invasive diagnosis of liver disease,” Journal of Hepatology, vol. 60, no. 1, pp. 69–77, Jan. 2014, doi: 10.1016/J.JHEP.2013.09.002.
[9] E. M. Tunnicliffe, R. Banerjee, M. Pavlides, S. Neubauer, and M. D. Robson, “A model for hepatic fibrosis: the competing effects of cell loss and iron on shortened modified Look-Locker inversion recovery T1 (shMOLLI-T1) in the liver,” Journal of Magnetic Resonance Imaging, vol. 45, no. 2, pp. 450–462, Feb. 2017, doi: 10.1002/JMRI.25392.
[10] L. A. B. Purvis, W. T. Clarke, L. Biasiolli, L. Valkovič, M. D. Robson, and C. T. Rodgers, “OXSA: An open-source magnetic resonance spectroscopy analysis toolbox in MATLAB,” PLOS ONE, vol. 12, no. 9, p. e0185356, Sep. 2017, doi: 10.1371/journal.pone.0185356.
[11] A. Markel, J. G. Brook, and M. Aviram, “Increased plasma triglycerides, cholesterol and apolipoprotein E during prolonged fasting in normal subjects,” Postgraduate Medical Journal, vol. 61, pp. 395–400, 1985.
Figures