2289
Advanced reconstruction provides improved image quality and enables shorter breath-holds in contrast-enhanced liver imaging1MRI Unit, The Royal Marsden NHS Foundation Trust, London, United Kingdom, 2Division of Radiotherapy and Imaging, The Institute of Cancer Research, London, United Kingdom, 3MR Application Predevelopment, Siemens Healthcare GmbH, Erlangen, Germany
Synopsis
An advanced reconstruction method, which employs a neural network trained on high resolution data to conduct interpolation, combined with iterative denoising, was applied in contrast-enhanced liver imaging in patients receiving a hepatocyte-specific contrast agent. The advanced reconstruction provides improved image quality, with better contrast-to-noise ratio, vessel edge sharpness, and lesion edge sharpness compared with the standard reconstruction using zero-filling interpolation without advanced reconstruction. The improvement in image quality was also observed in faster acquisitions (lower phase resolution), thus enabling shorter breath-hold acquisitions.
Introduction
Magnetic resonance imaging (MRI) is well established for imaging assessment of the liver. Contrast-enhanced (CE) T1-weighted (T1-w) imaging is an essential component to quantify parenchymal and lesional perfusion characteristics, and for lesion detection. The use of liver-specific contrast agents also allows morphological assessment of the liver and the biliary tree and provides functional information1. Breath-holding is required to minimise motion artefacts, unless motion-insensitive techniques are used. Rapid data acquisition is required to fit into an acceptable breath-hold duration, but even moderate breath-holds (15-18s) are challenging for some patients. Acceleration methods such as reduced phase and slice resolution and partial Fourier techniques conventionally use zero-filling interpolation, and lead to blurring and reduction of signal-to-noise ratio in images, which may impair interpretation, particularly in detection of small lesions. The aims of this study were to apply an advanced reconstruction method, which employs a neural network (NN) trained on high-resolution images to conduct interpolation and partial Fourier reconstruction in slice direction, in combination with iterative denoising (ID) in CE-T1-w liver imaging; compare image quality with standard reconstruction; and assess whether acquisition time can be reduced further whilst maintaining acceptable image quality.Methods
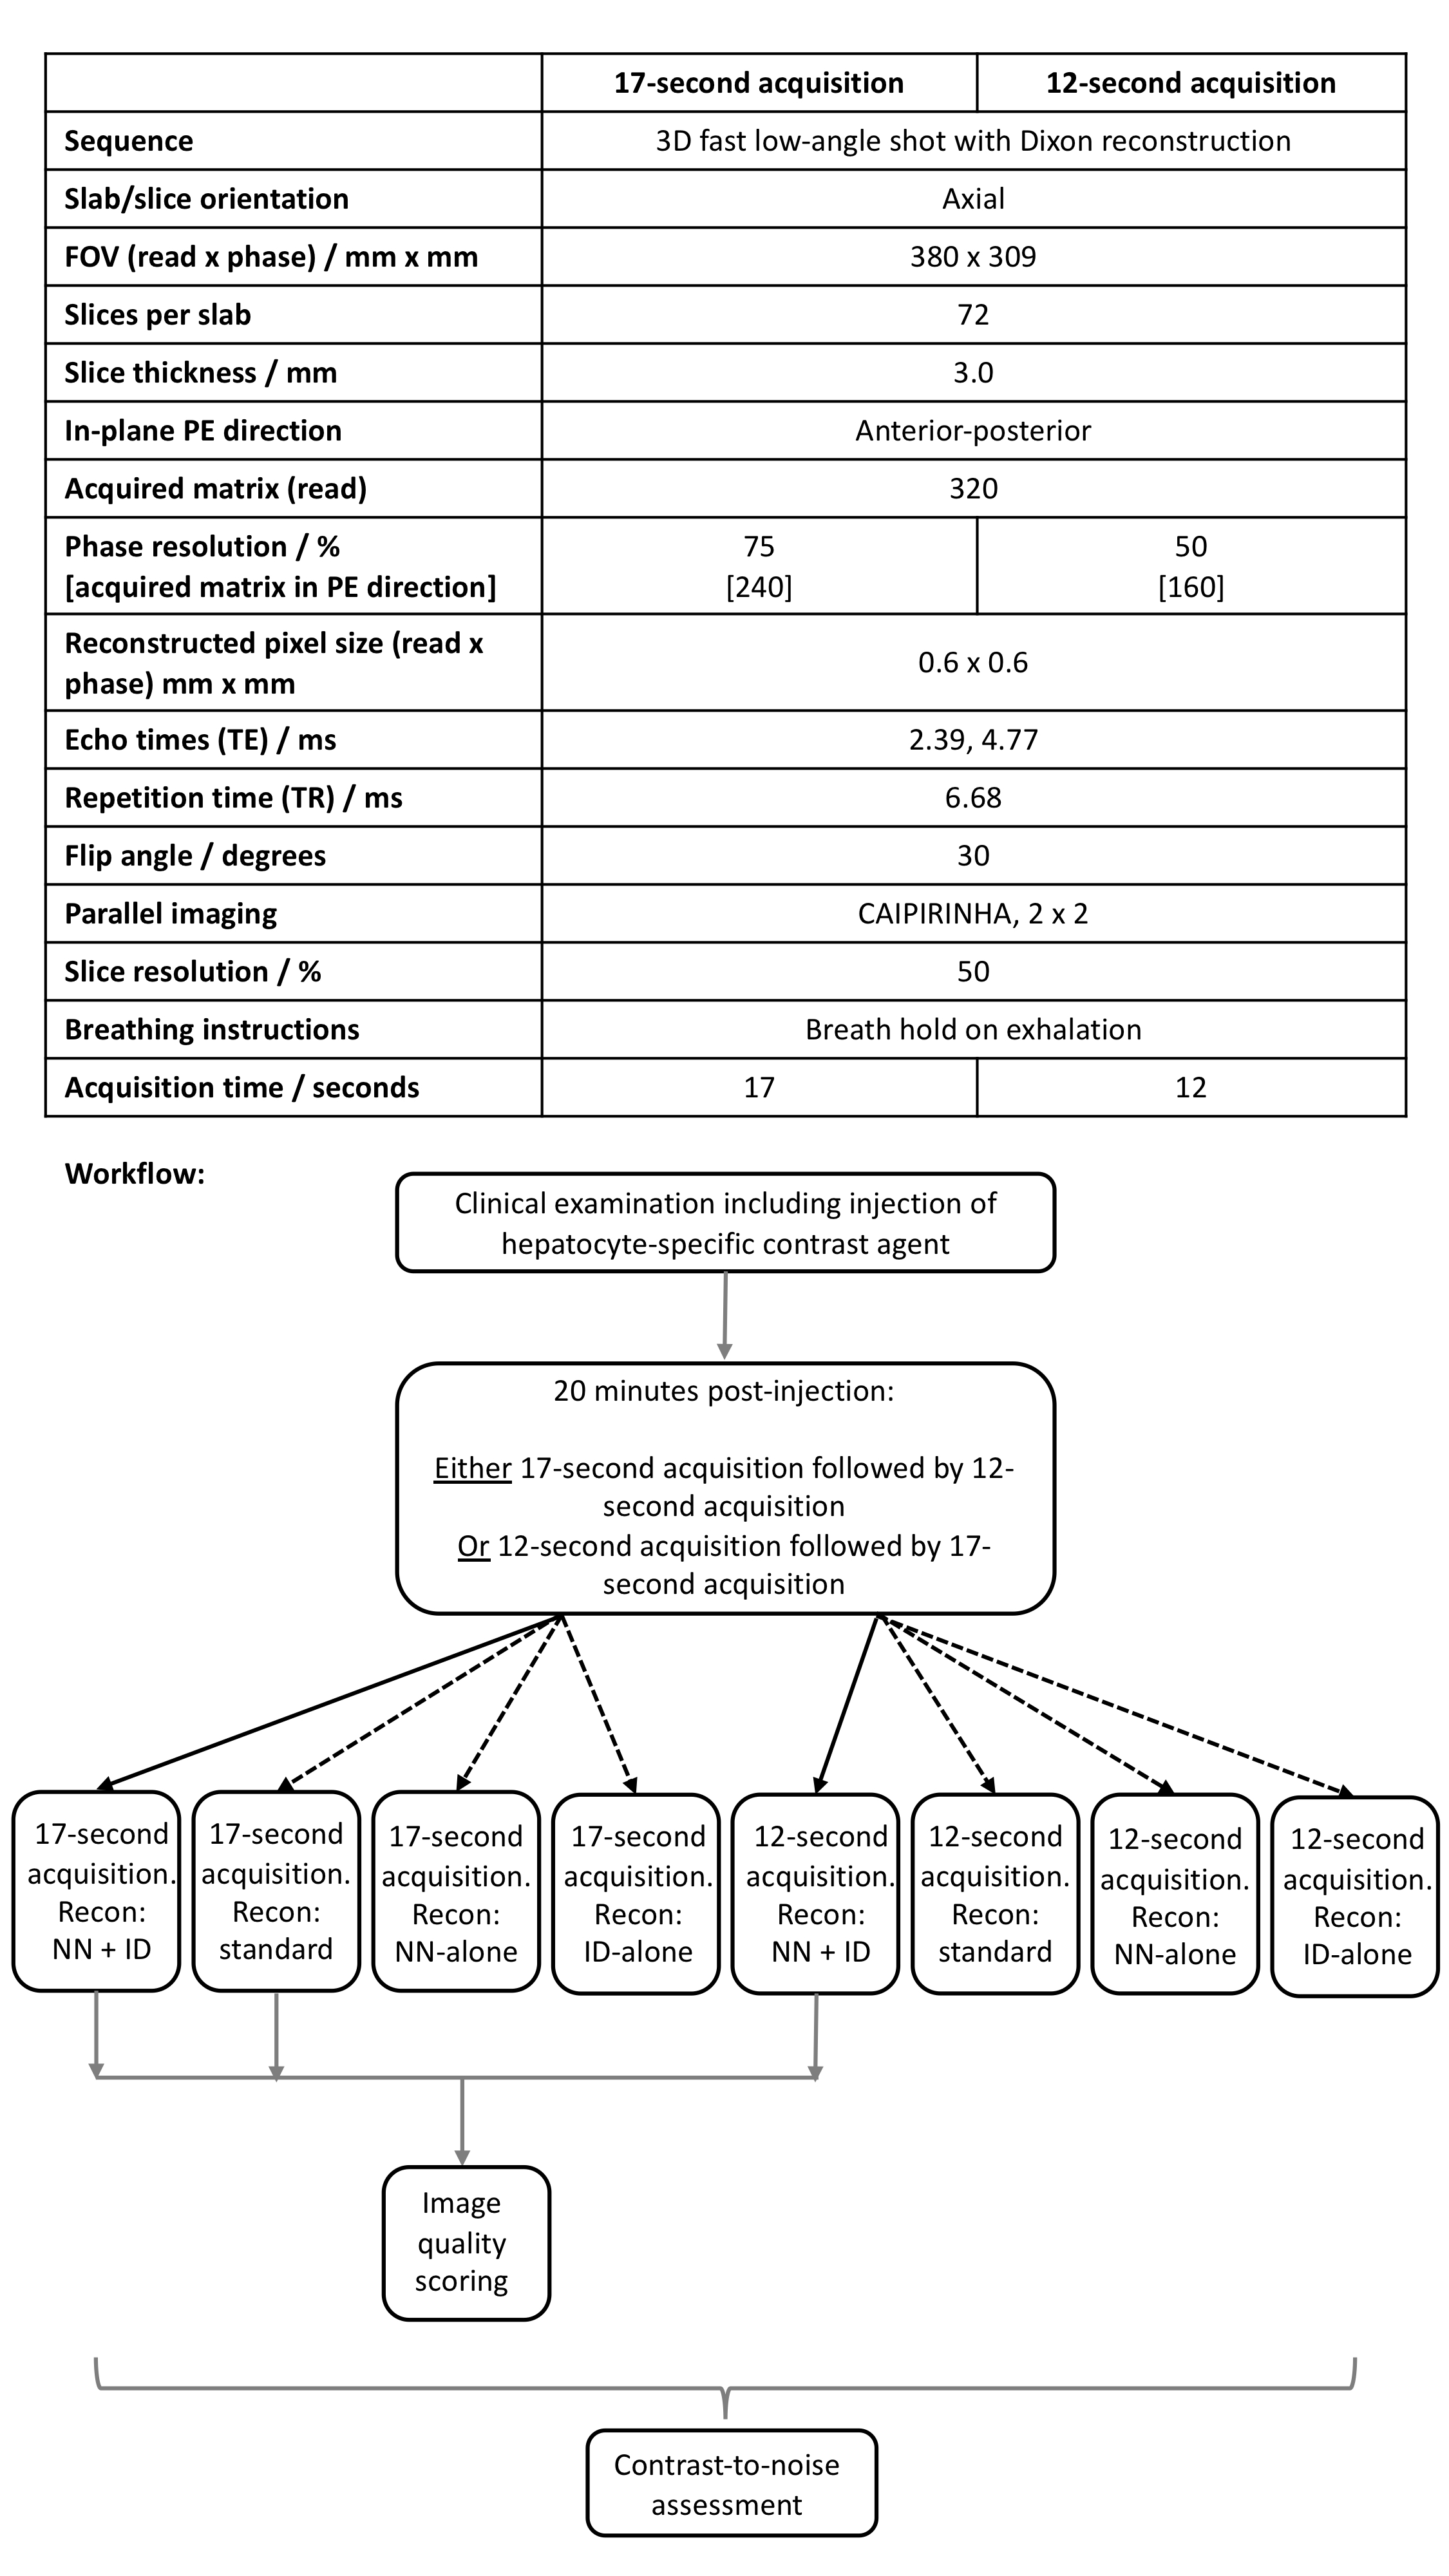
This prospective study was approved by a national research ethics committee and all patients gave verbal consent for acquisition of additional images. 20 patients undergoing liver MRI examinations using a hepatocyte-selective contrast agent (gadoxetate disodium, Gd-EOB-DTPA, PrimovistTM, Bayer, Germany, 0.25mmol/ml, administered at 0.1ml/kg) on one MRI scanner were included. Patients were imaged on a 1.5T MRI scanner (MAGNETOM Aera, Siemens Healthcare, Erlangen, Germany).Patients underwent their routine clinical examination followed by the study sequences (acquired 20 minutes after contrast administration). Patients undergoing either full dynamic examinations or abbreviated protocols were included. Study sequences used a prototype package; parameters are described in Figure 1. Parameters of the 17-second acquisition match the routine protocol at our institution. Acquisition time was further reduced (12-second acquisition) by reducing the phase resolution from 75% to 50%. Data were reconstructed using a NN2 to conduct interpolation combined with ID3 (NN+ID) with additional reconstructions using NN-alone, ID-alone and standard reconstruction (zero-filling interpolation without ID). ‘Water-only’ images from Dixon reconstructions were used for further analysis.
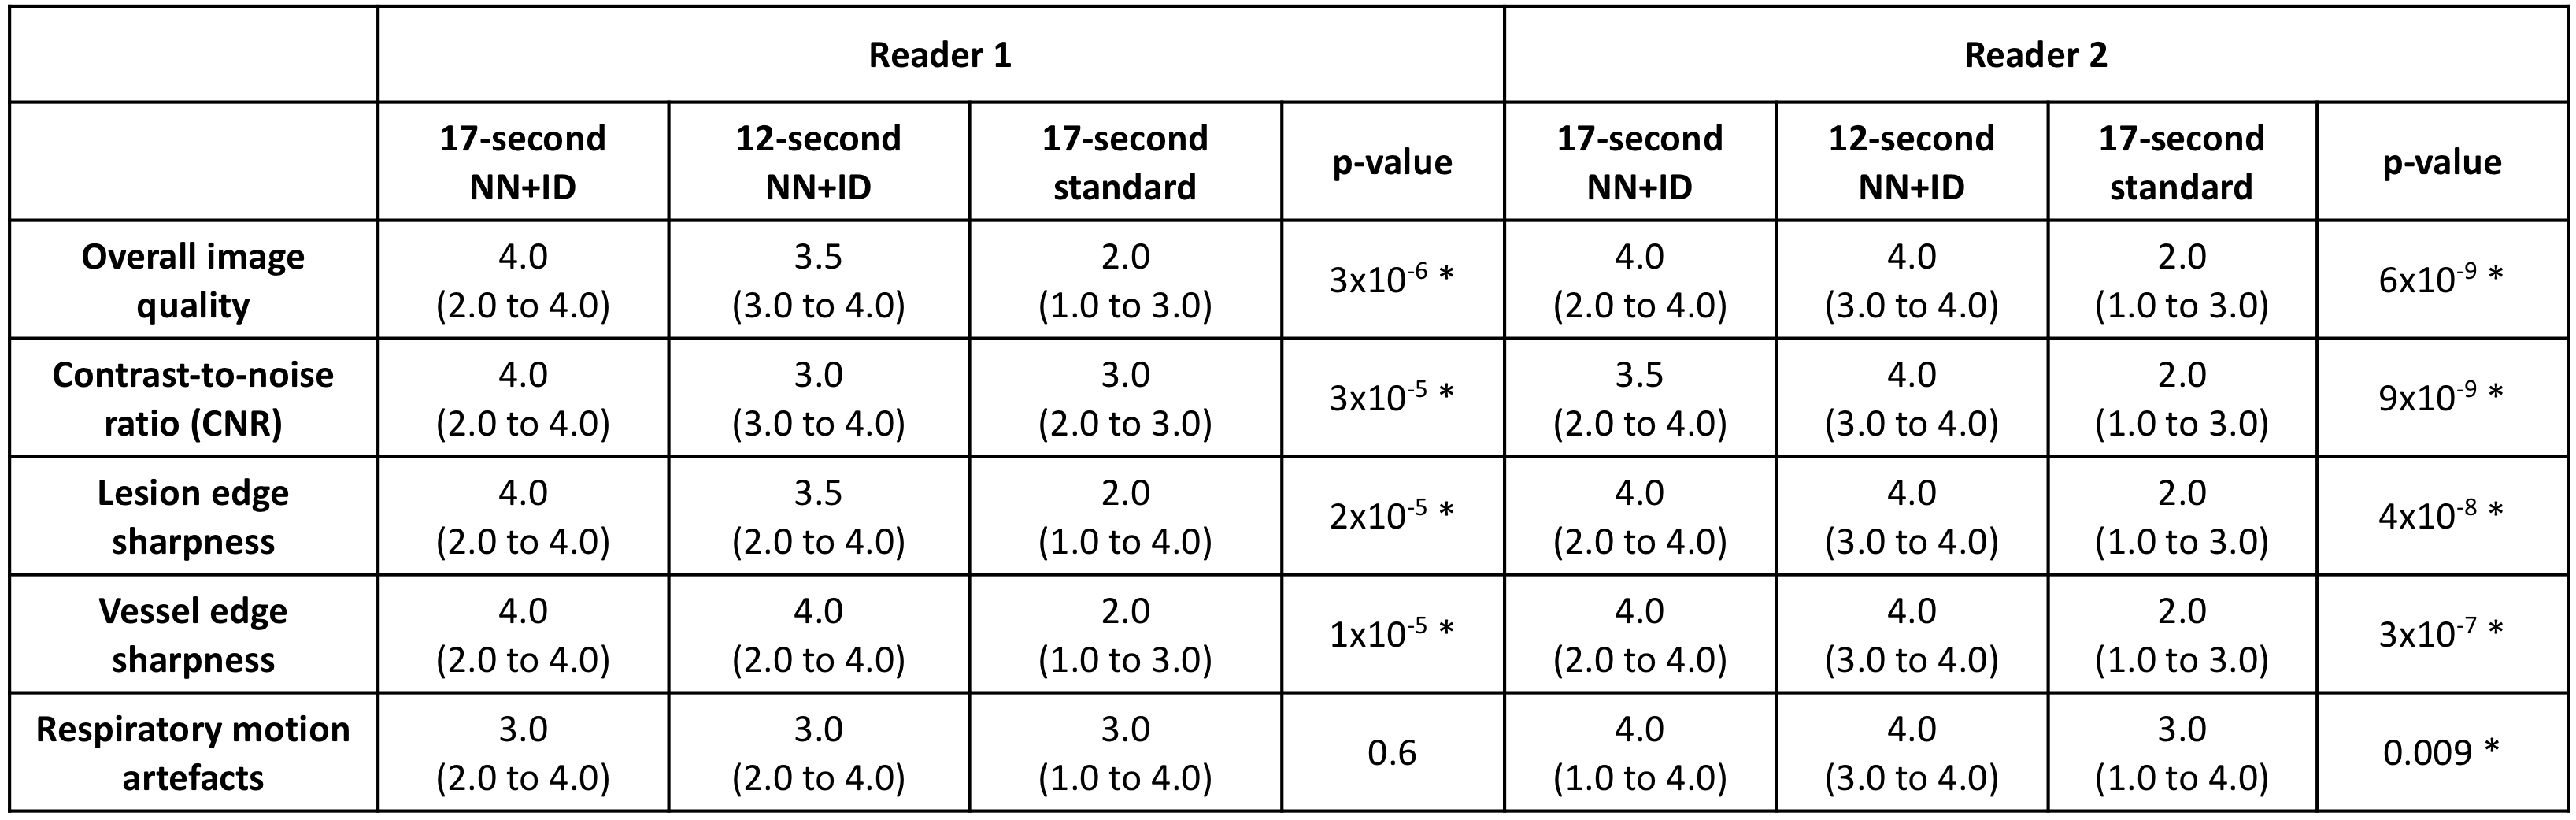
Image quality was assessed independently by two radiologists. Readers were blinded to the acquisition/reconstruction method and series were presented in a random order. The 17-second and 12-second acquisitions (NN+ID) and the 17-second acquisition with standard reconstruction were assessed. Images were scored on a four-point Likert scale for the following measures: overall image quality, contrast-to-noise ratio (CNR), lesion edge sharpness, vessel edge sharpness, and respiratory motion artefacts. All statistical analysis was conducted using Matlab 2021a (Mathworks, Natick, MA). Median scores were calculated for each reader. Differences between three series were assessed using a Kruskal-Wallis test.
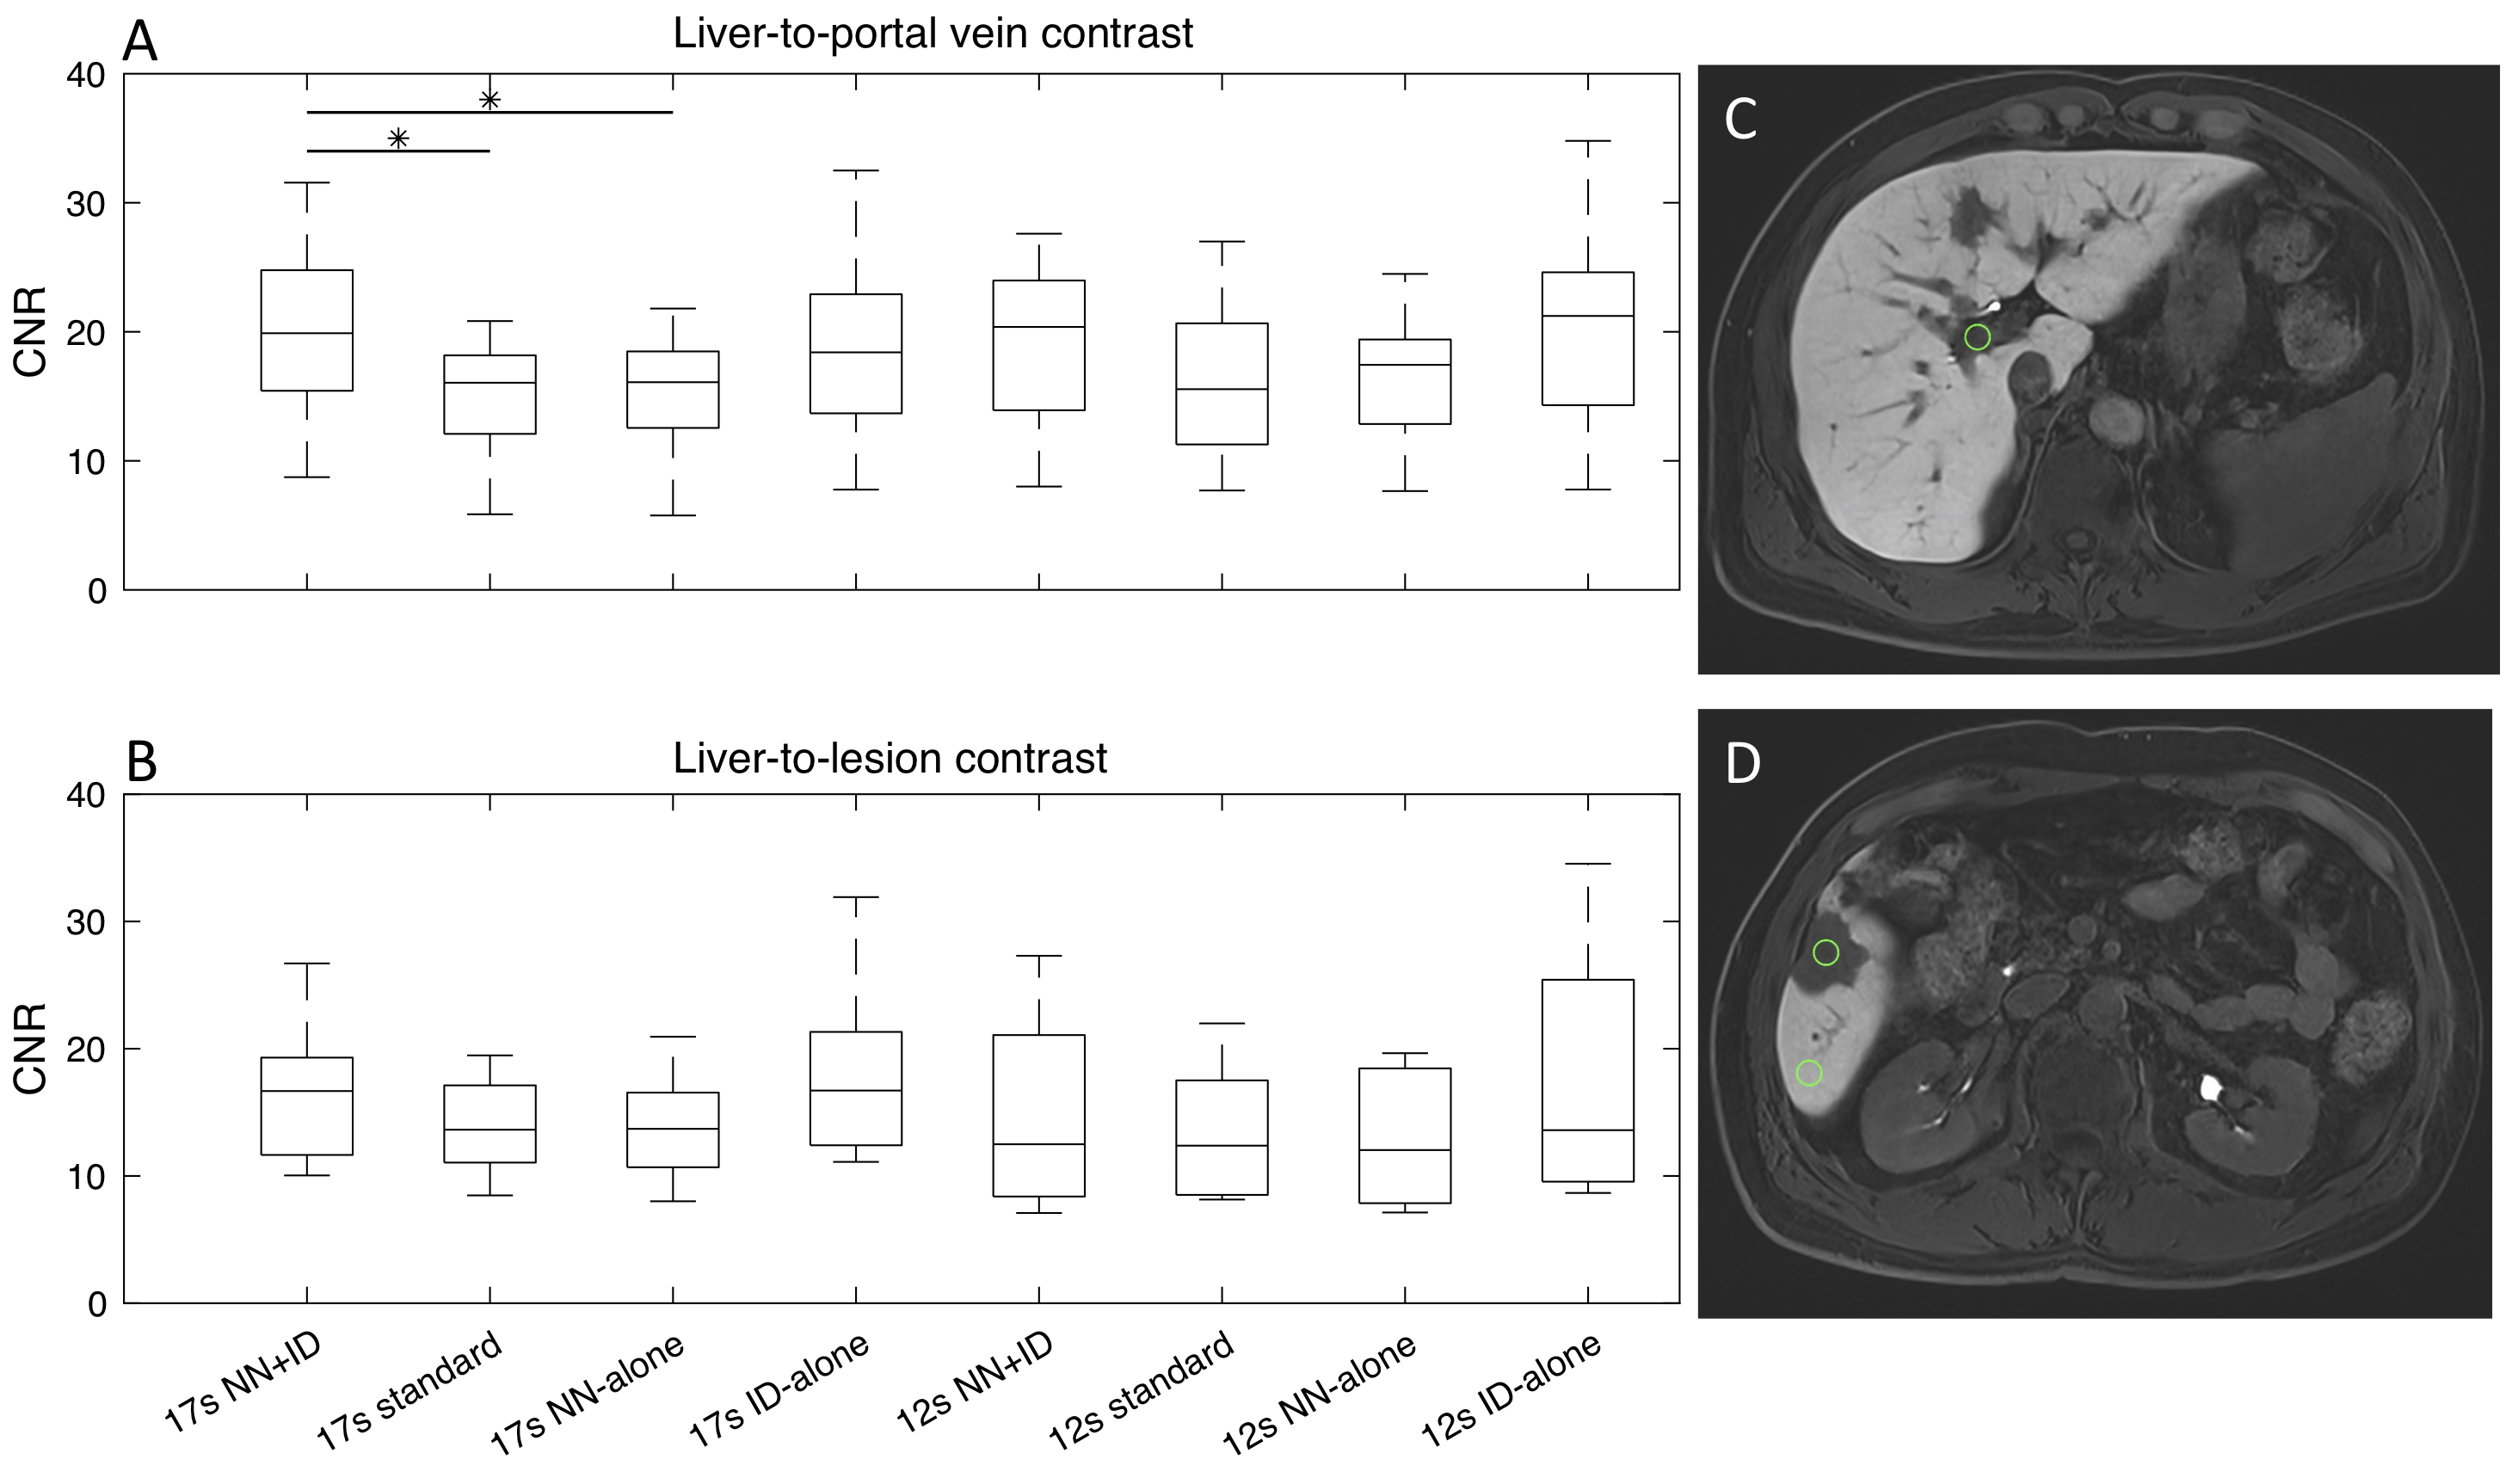
CNR was assessed quantitatively in all series. A 1cm circular region of interest (ROI) was placed in centre of the largest lesion, adjacent normal liver and portal vein. The mean and standard deviation of the signal was measured for each ROI (Osirix MD). CNR between liver and portal vein was quantified as the difference in mean signals divided by the standard deviation of signal in the liver. CNR between liver and lesion (difference in mean signals divided by standard deviation of signal in the liver) was only assessed in patients who had at least one lesion larger than 1cm. Differences between series were assessed using one-way analysis of variance (ANOVA).
Results
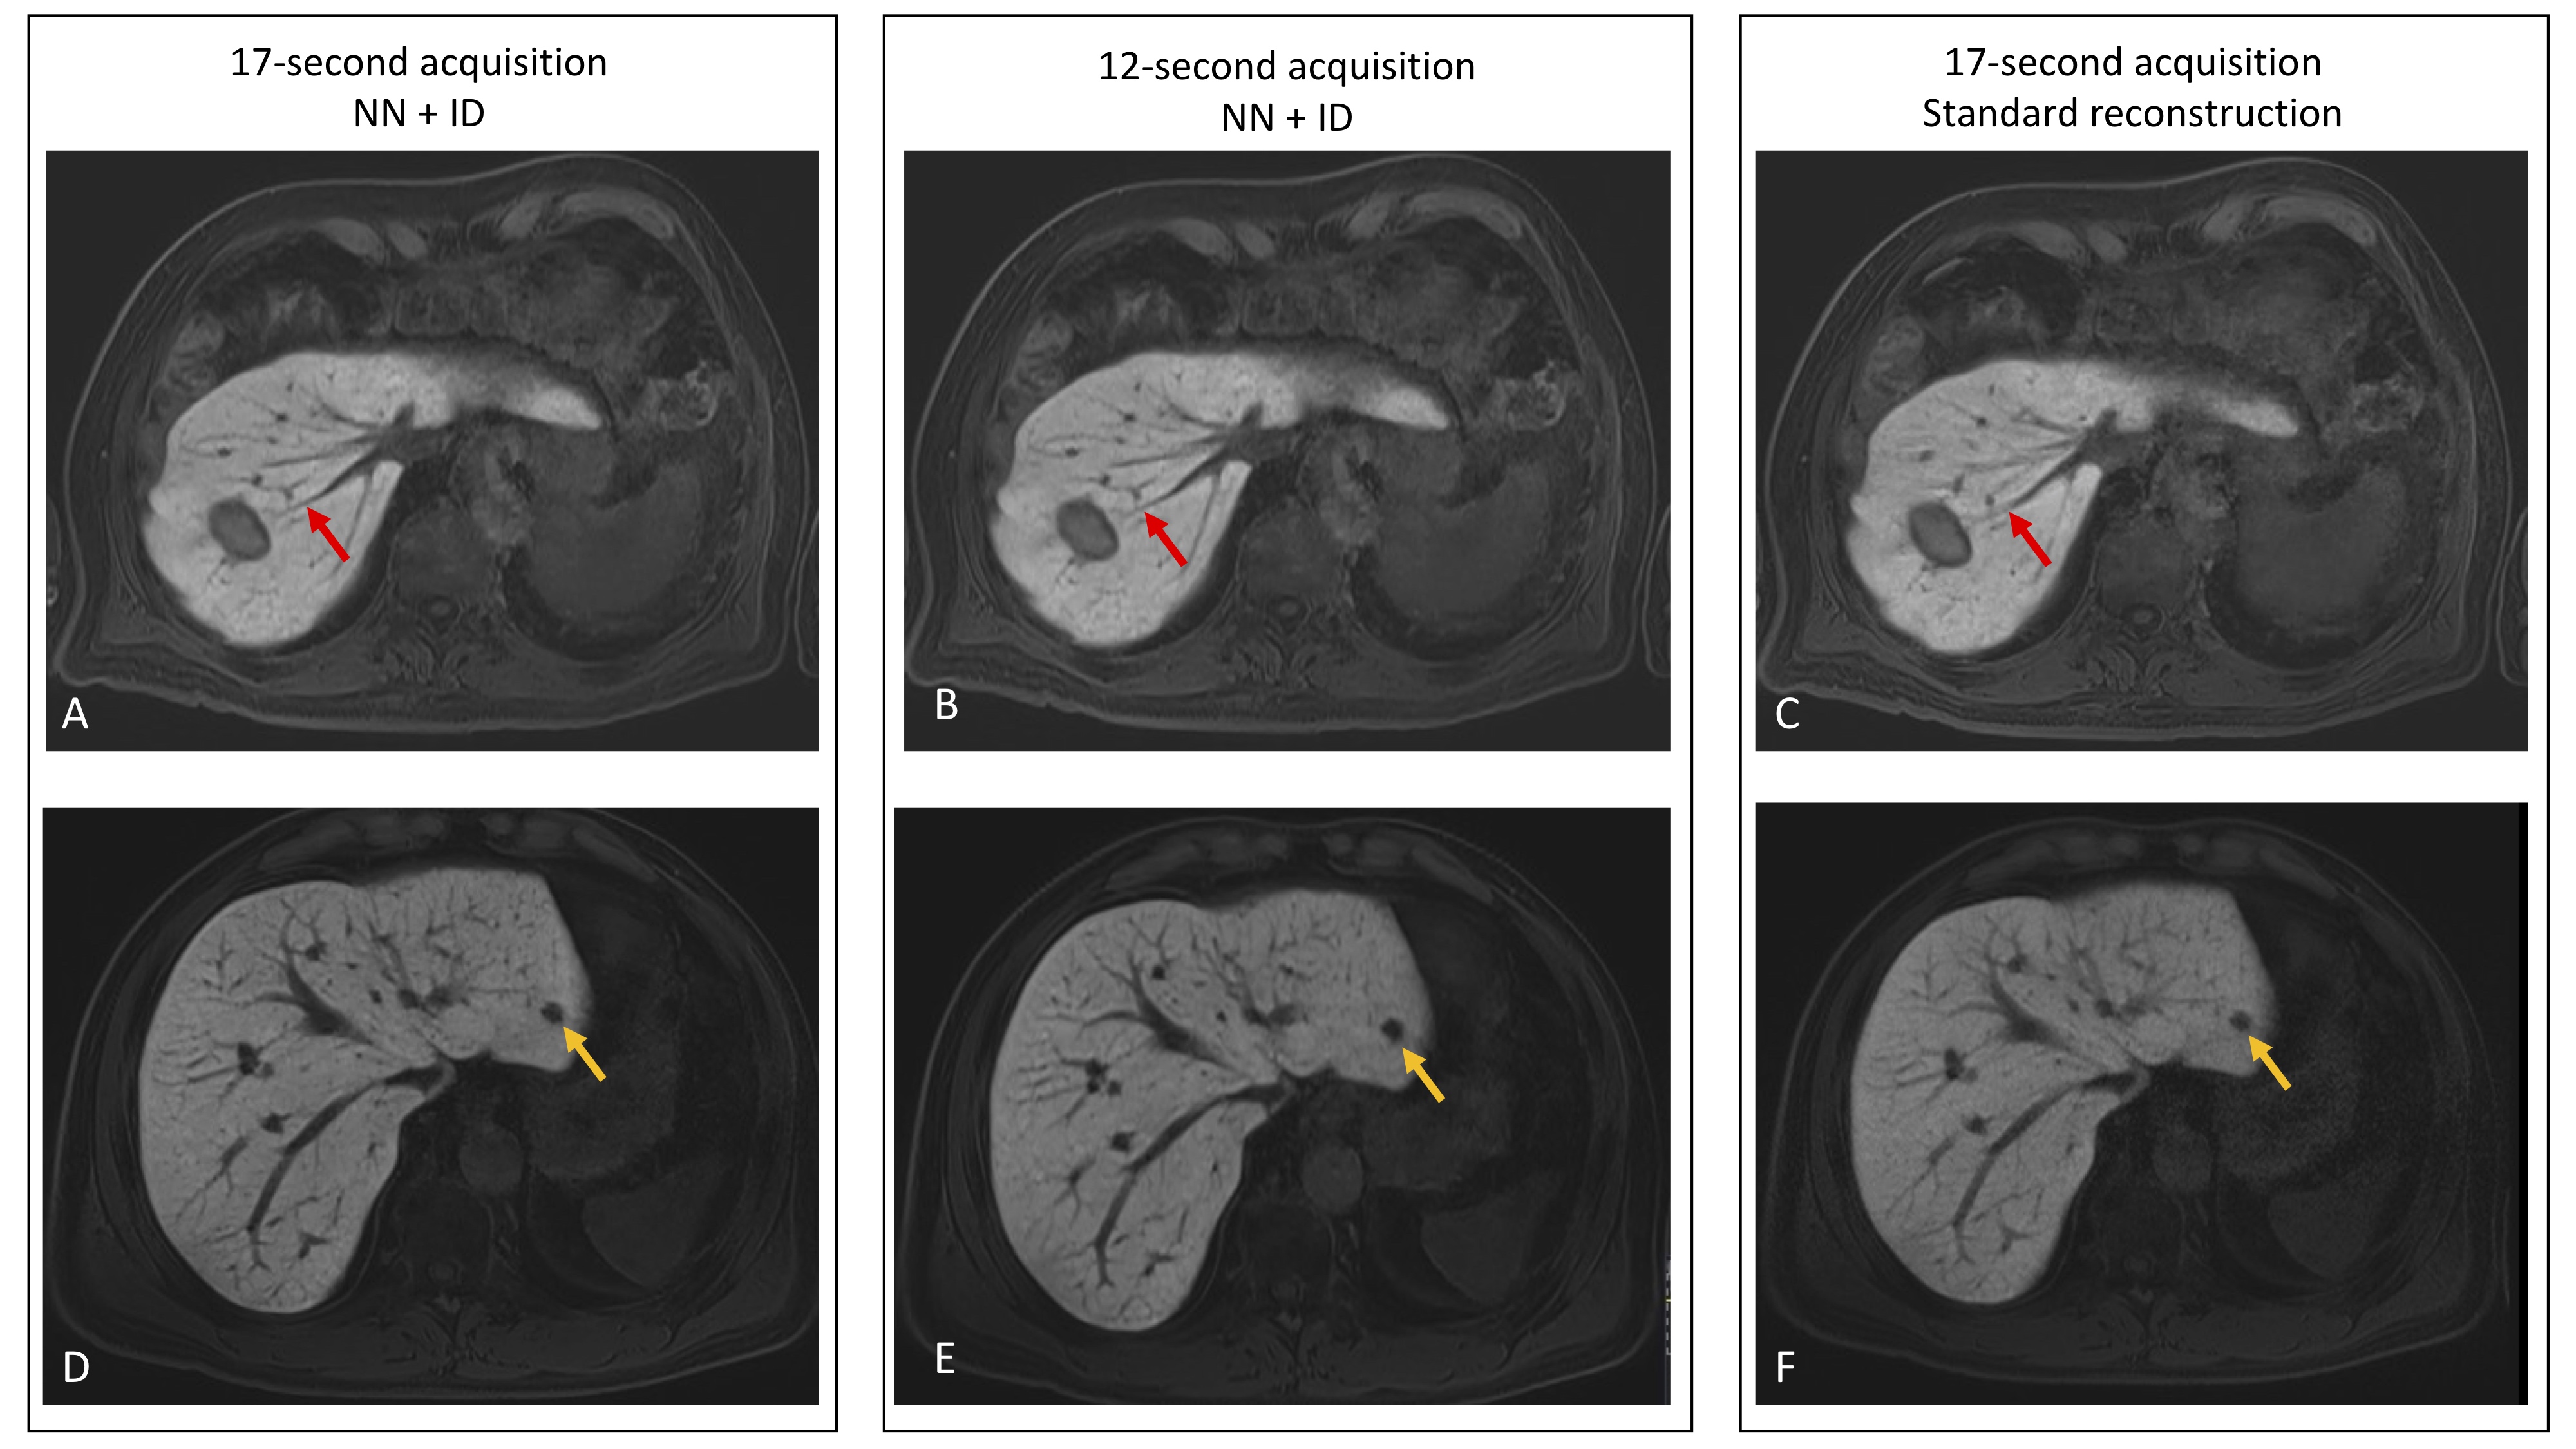
All 20 patients were successfully imaged (median age 57 years, range 36-81, 10 male, 10 female). Overall image quality was improved using NN+ID, with better edge sharpness in lesions and vessels for both 17-second and 12-second acquisitions using NN+ID compared with the standard reconstruction (Figure 2). Quantitative assessment showed significantly higher scores for image quality, CNR, vessel edge sharpness, and lesion edge sharpness for 17-second and 12-second acquisitions using NN+ID compared with the standard reconstruction (Figures 3 and 4) with no significant difference between 17-second and 12-second acquisitions.Considering 17-second and 12-second acquisitions separately, CNR between liver and portal vein was significantly higher for the 17-second acquisition using NN+ID compared with the standard reconstruction or NN-alone (Figure 5); no significant difference was seen for the 12-second acquisition, nor between liver and lesions (Figure 5).
Discussion
The use of NN+ID shows improved image quality with increased CNR and edge sharpness. The excellent image quality attained using 12-second acquisitions suggests that NN+ID can enable reduced data acquisition, thus reducing breath-hold duration and making examinations more tolerable for patients, whilst providing improved image quality. Additional reconstructions using NN-alone and ID-alone enabled assessment of each technique separately. Although higher CNR was observed between liver and portal vein, the absence of a significant difference in CNR between liver and lesions may arise from the small number of patients with lesions larger than 1cm (8/20); CNR will be assessed further in a larger cohort. Further work will also assess number of lesions detected using the 12-second acquisition with NN+ID compared with the 17-second acquisition with standard reconstruction.Conclusions
Advanced reconstruction methods using a trained neural network for data interpolation combined with iterative denoising provides improved image quality and enables shorter breath-hold acquisitions in T1-weighted contrast-enhanced imaging in liver examinations.Acknowledgements
We acknowledge funding from Cancer Research UK and Engineering and Physical Sciences Research Council support to the Cancer Imaging Centre at the Institute of Cancer Research and Royal Marsden Hospital in association with the Medical Research Council and Department of Health C1060/A10334, C1060/A16464 and National Health Service funding to the National Institute for Health Research Biomedical Research Centre, Experimental Cancer Medicine Centre, the Clinical Research Facility in Imaging, and the Cancer Research Network. The views expressed in this publication are those of the author(s) and not necessarily those of the National Health Service, the National Institute for Health Research or the Department of Health.References
1. Koh D, Collins D, Wallace T, Chau I, Riddell A (2012) Combining diffusion-weighted MRI with Gd-EOB-DTPA-enhanced MRI improves the detection of colorectal liver metastases. British J Radiol 85:980-989.
2. Almansour H, Gassenmaier S, Nickel D et al (2021) Deep learning-based superresolution reconstruction for upper abdominal magnetic resonance imaging: an analysis of image quality, diagnostic confidence, and lesion conspicuity. Investigative radiology 56:509-516.
3. Kannengiesser S, Maihle B, Nadar M (2016) Universal iterative denoising of complex-valued volumetric MR image data using supplementary information. Proc ISMRM, pp 1779
Figures