2287
Simultaneous T1, T2, and T2* Mapping of the Liver in a Single Breath Hold Using Multi Inversion Spin and Gradient Echo1Department of Radiology, Cincinnati Children's Hospital Medical Center, Cincinnati, OH, United States, 2Department of Radiology, University of Cincinnati College of Medicine, Cincinnati, OH, United States, 3Clinical Science, Philips Healthcare, Cincinnati, OH, United States
Synopsis
Parametric mapping aids in the non-invasive evaluation and longitudinal monitoring of diffuse chronic liver disease. Commercially available parametric mapping techniques require multiple scans over multiple breath-holds. A multi-inversion spin and gradient echo (MI-SAGE) method is presented to simultaneously estimate T1, T2, and T2* at six slice locations in the liver in a single 16s breath-hold. In five volunteers, the MI-SAGE method produced parametric values comparable to those obtained using modified Lock Locker (T1), multiple gradient and spin echo (T2), and multiple gradient echo (T2*) sequences. MI-SAGE offers the potential to significantly shorten the duration of the quantitative MR liver exams.
Introduction
Non-invasive tissue characterization via quantitative magnetization relaxation parameter maps aids in the detection and assessment of liver diseases1–3 including inflammation, fibrosis, and iron deposition. However, hepatic parametric maps are typically generated clinically through the acquisition of a different sequence type per parameter across multiple breath-holds. Performing multiple consecutive breath-holds while lying still for the prolonged MRI exan is challenging, particlarly in patients with comorbidities and in the pediatric population. Inconsistency in breath-holds may lead to misaligned slice positions across the different parametric maps. Currently, a modified Look-Locker (MOLLI) 4 is used to estimate hepatic T1 with good reproducibility in adults5 in one breath-hold per slice. A gradient and spin echo (GRASE) sequence is used to estimate myocardial T26 in a breath-hold per slice. A multiple gradient echo (mGRE) sequence provides reliable and reproducible quantification of hepatic T2* in a single breath-hold7. Many approaches are being developed to accelerate the acquisition of parametric maps in the liver. The multi-echo chemical shift-encoded Dixon method estimates both T2* and proton density fat fraction (PDFF) 8, but does not include T1 and T2 . Recently, MR fingerprinting (MRF) has been used to simultaneously estimate T1, T2, and T2* and PDFF9 in one breath-hold per slice. The multi-inversion10–12 spin and gradient echo13,14 (MI-SAGE) method simultaneously estimates T1, T2, and T2* and has previously been demonstrated in the brain15. Here, we introduce the MI-SAGE method, optimized to simultaneously estimate hepatic T1, T2, and T2* in 6 slices through the liver within a single 16s breath-hold.Methods
The MI-SAGE sequence15 employs fat-suppressed single-shot echo planar imaging of multiple echoes (gradient echo, mixed spin echo, and spin echo) per excitation13 to rapidly sample the evolution of transverse magnetization. A non-selective inversion pulse is followed by an interleaved slice order that is shuffled every repetition to sample the recovery of longitudinal magnetization10–12 (Figure 1).Five volunteers without known liver disease (age range 38-54 years, 3 men and 2 women) were recruited under an institutional review board approved protocol. All imaging was performed on a 1.5T scanner (Ingenia, Philips Healthcare) using a 28-element coil. The acquisition parameters for MI-SAGE were: FOV= 440x320mm, acquired resolution = 3x3 mm, slice thickness = 8 mm, partial Fourier factor = 6/8, SENSE = 3, TEs = [7, 28, 58, 79, 100] ms, TR = 2 s, and TIs = [85, 198, 310, 423, 545, 648] ms. A total of 8 repetitions, including 2 dummies to attain steady state, followed by 6 repetitions with shuffled interleaved slice ordering, were performed. Six axial slices through the liver were obtained in a single 16s breath-hold. A dictionary of signal evolutions with a range of T1, T2, and T2* values were precomputed resulting in 150,822 dictionary entries. Dictionary matching was performed offline to each voxel over the 30 [6TIx5TE] source images to generate estimated T1, T2, and T2* maps. Scanner generated hepatic T1, T2, and T2* maps were acquired at two matching mid-liver slices with the same FOV and nominally identical acquired spatial resolution using MOLLI 5s(3s)3s with a simulated ECG (11 s breath-hold/slice), 6 echo GRASE (13s breath-hold/slice), and 15 echo mGRE sequences (2s breath-hold/slice), respectively.
In all subjects, three 20x20 voxel regions of interest (ROI) were drawn at matching anatomic location on the parametric maps in the liver avoiding any visible vessels and excluding the liver capsule. Additionally, one ROI each were drawn in the skeletal muscle and spleen. Mean, standard deviation, and median of the values in the ROIs were calculated for each mapping method.
Results
Representative T1, T2, and T2* maps obtained using MI-SAGE, MOLLI, GRASE, and mGRE sequences at the mid-liver slice are shown for two subjects in Figure 2. Distribution of T1, T2, and T2* values obtained with different techniques in one subject are shown in Figure 3. Figure 4 depicts the mean parametric values in liver, muscle, and spleen across all subjects.Discussion
In this feasibility study assessing five volunteers, simultaneously obtained hepatic T1, T2, and T2* estimates in 6 slices within a single breath-hold using the proposed MI-SAGE approach were comparable to those obtained using MOLLI, GRASE, and mGRE individually acquired as separate breath-holds per slice. For this study, the acquisition parameters of MI-SAGE were optimized for accuracy over the range of normal hepatic T1, T2, and T2* values and coverage in a reasonable breath-hold time. The accuracy of the MI-SAGE estimated parametric maps remains to be evaluated over a wider range of T1, T2, T2*, and PDFF values which may provide insight into the source and resolution of the outstanding discrepancies as seen in the spleen. Obvious inaccuracies are seen in the subcutaneous fat due to the application of fat-suppression in the MI-SAGE acquisition. Notably, the amount of liver coverage obtained in the identical scan time can potentially be increased by using simultaneous multi-slice acquisition with MI-SAGE as has been demonstrated in brain12. Hepatic parametric mapping using MI-SAGE offers the potential to significantly shorten the duration of the quantitative liver MRI exam. The results of the present study are sufficiently encouraging to warrant the pursuit of future prospective clinical validation studies in larger cohorts of patients exhibiting a wide range of liver disease.Acknowledgements
No acknowledgement found.References
1. Hernando D, Levin YS, Sirlin CB, Reeder SB. Quantification of liver iron with MRI: State of the art and remaining challenges. J Magn Reson Imaging. 2014;40(5):1003-1021. doi:10.1002/jmri.24584
2. Banerjee R, Pavlides M, Tunnicliffe EM, et al. Multiparametric magnetic resonance for the non-invasive diagnosis of liver disease. J Hepatol. 2014;60(1):69-77. doi:10.1016/j.jhep.2013.09.002
3. Cassinotto C, Feldis M, Vergniol J, et al. MR relaxometry in chronic liver diseases: Comparison of T1 mapping, T2 mapping, and diffusion-weighted imaging for assessing cirrhosis diagnosis and severity. Eur J Radiol. 2015;84(8):1459-1465. doi:10.1016/j.ejrad.2015.05.019
4. Messroghli DR, Radjenovic A, Kozerke S, Higgins DM, Sivananthan MU, Ridgway JP. Modified look-locker inversion recovery (MOLLI) for high-resolution T 1 mapping of the heart. Magn Reson Med. 2004;52(1):141-146. doi:10.1002/mrm.20110
5. Yoon JH, Lee JM, Paek M, Han JK, Choi BI. Quantitative assessment of hepatic function: modified look-locker inversion recovery (MOLLI) sequence for T1 mapping on Gd-EOB-DTPA-enhanced liver MR imaging. Eur Radiol. 2016;26(6):1775-1782. doi:10.1007/s00330-015-3994-7
6. Sprinkart AM, Luetkens JA, Träber F, et al. Gradient Spin Echo (GraSE) imaging for fast myocardial T2 mapping. J Cardiovasc Magn Reson. 2015;17(1):12. doi:10.1186/s12968-015-0127-z
7. Westwood M, Anderson LJ, Firmin DN, et al. A single breath-hold multiecho T2* cardiovascular magnetic resonance technique for diagnosis of myocardial iron overload. J Magn Reson Imaging. 2003;18(1):33-39. doi:10.1002/jmri.10332
8. Yu H, McKenzie CA, Shimakawa A, et al. Multiecho reconstruction for simultaneous water-fat decomposition and T2* estimation. J Magn Reson Imaging. 2007;26(4):1153-1161. doi:10.1002/jmri.21090
9. Jaubert O, Arrieta C, Cruz G, et al. Multi-parametric liver tissue characterization using MR fingerprinting: Simultaneous T1, T2, T2*, and fat fraction mapping. Magn Reson Med. 2020;84(5):2625-2635. doi:10.1002/mrm.28311
10. Ordidge RJ, Gibbs P, Chapman B, Stehling MK, Mansfield P. High-speed multislice T 1 mapping using inversion-recovery echo-planar imaging. Magn Reson Med. 1990;16(2):238-245. doi:10.1002/mrm.1910160205
11. Clare S, Jezzard P. RapidT1 mapping using multislice echo planar imaging. Magn Reson Med. 2001;45(4):630-634. doi:10.1002/mrm.1085
12. Renvall V, Witzel T, Wald LL, Polimeni JR. Automatic cortical surface reconstruction of high-resolution T1echo planar imaging data. Neuroimage. 2016;134:338-354. doi:10.1016/j.neuroimage.2016.04.004
13. Schmiedeskamp H, Straka M, Newbould RD, et al. Combined spin- and gradient-echo perfusion-weighted imaging. Magn Reson Med. 2012;68(1):30-40. doi:10.1002/mrm.23195
14. Eichner C, Jafari-Khouzani K, Cauley S, et al. Slice accelerated gradient-echo spin-echo dynamic susceptibility contrast imaging with blipped CAIPI for increased slice coverage. Magn Reson Med. 2014;72(3):770-778. doi:10.1002/mrm.24960
15. Manhard MK, Stockmann J, Liao C, et al. A multi‐inversion multi‐echo spin and gradient echo echo planar imaging sequence with low image distortion for rapid quantitative parameter mapping and synthetic image contrasts. Magn Reson Med. 2021;(August 2020):mrm.28761. doi:10.1002/mrm.28761
Figures
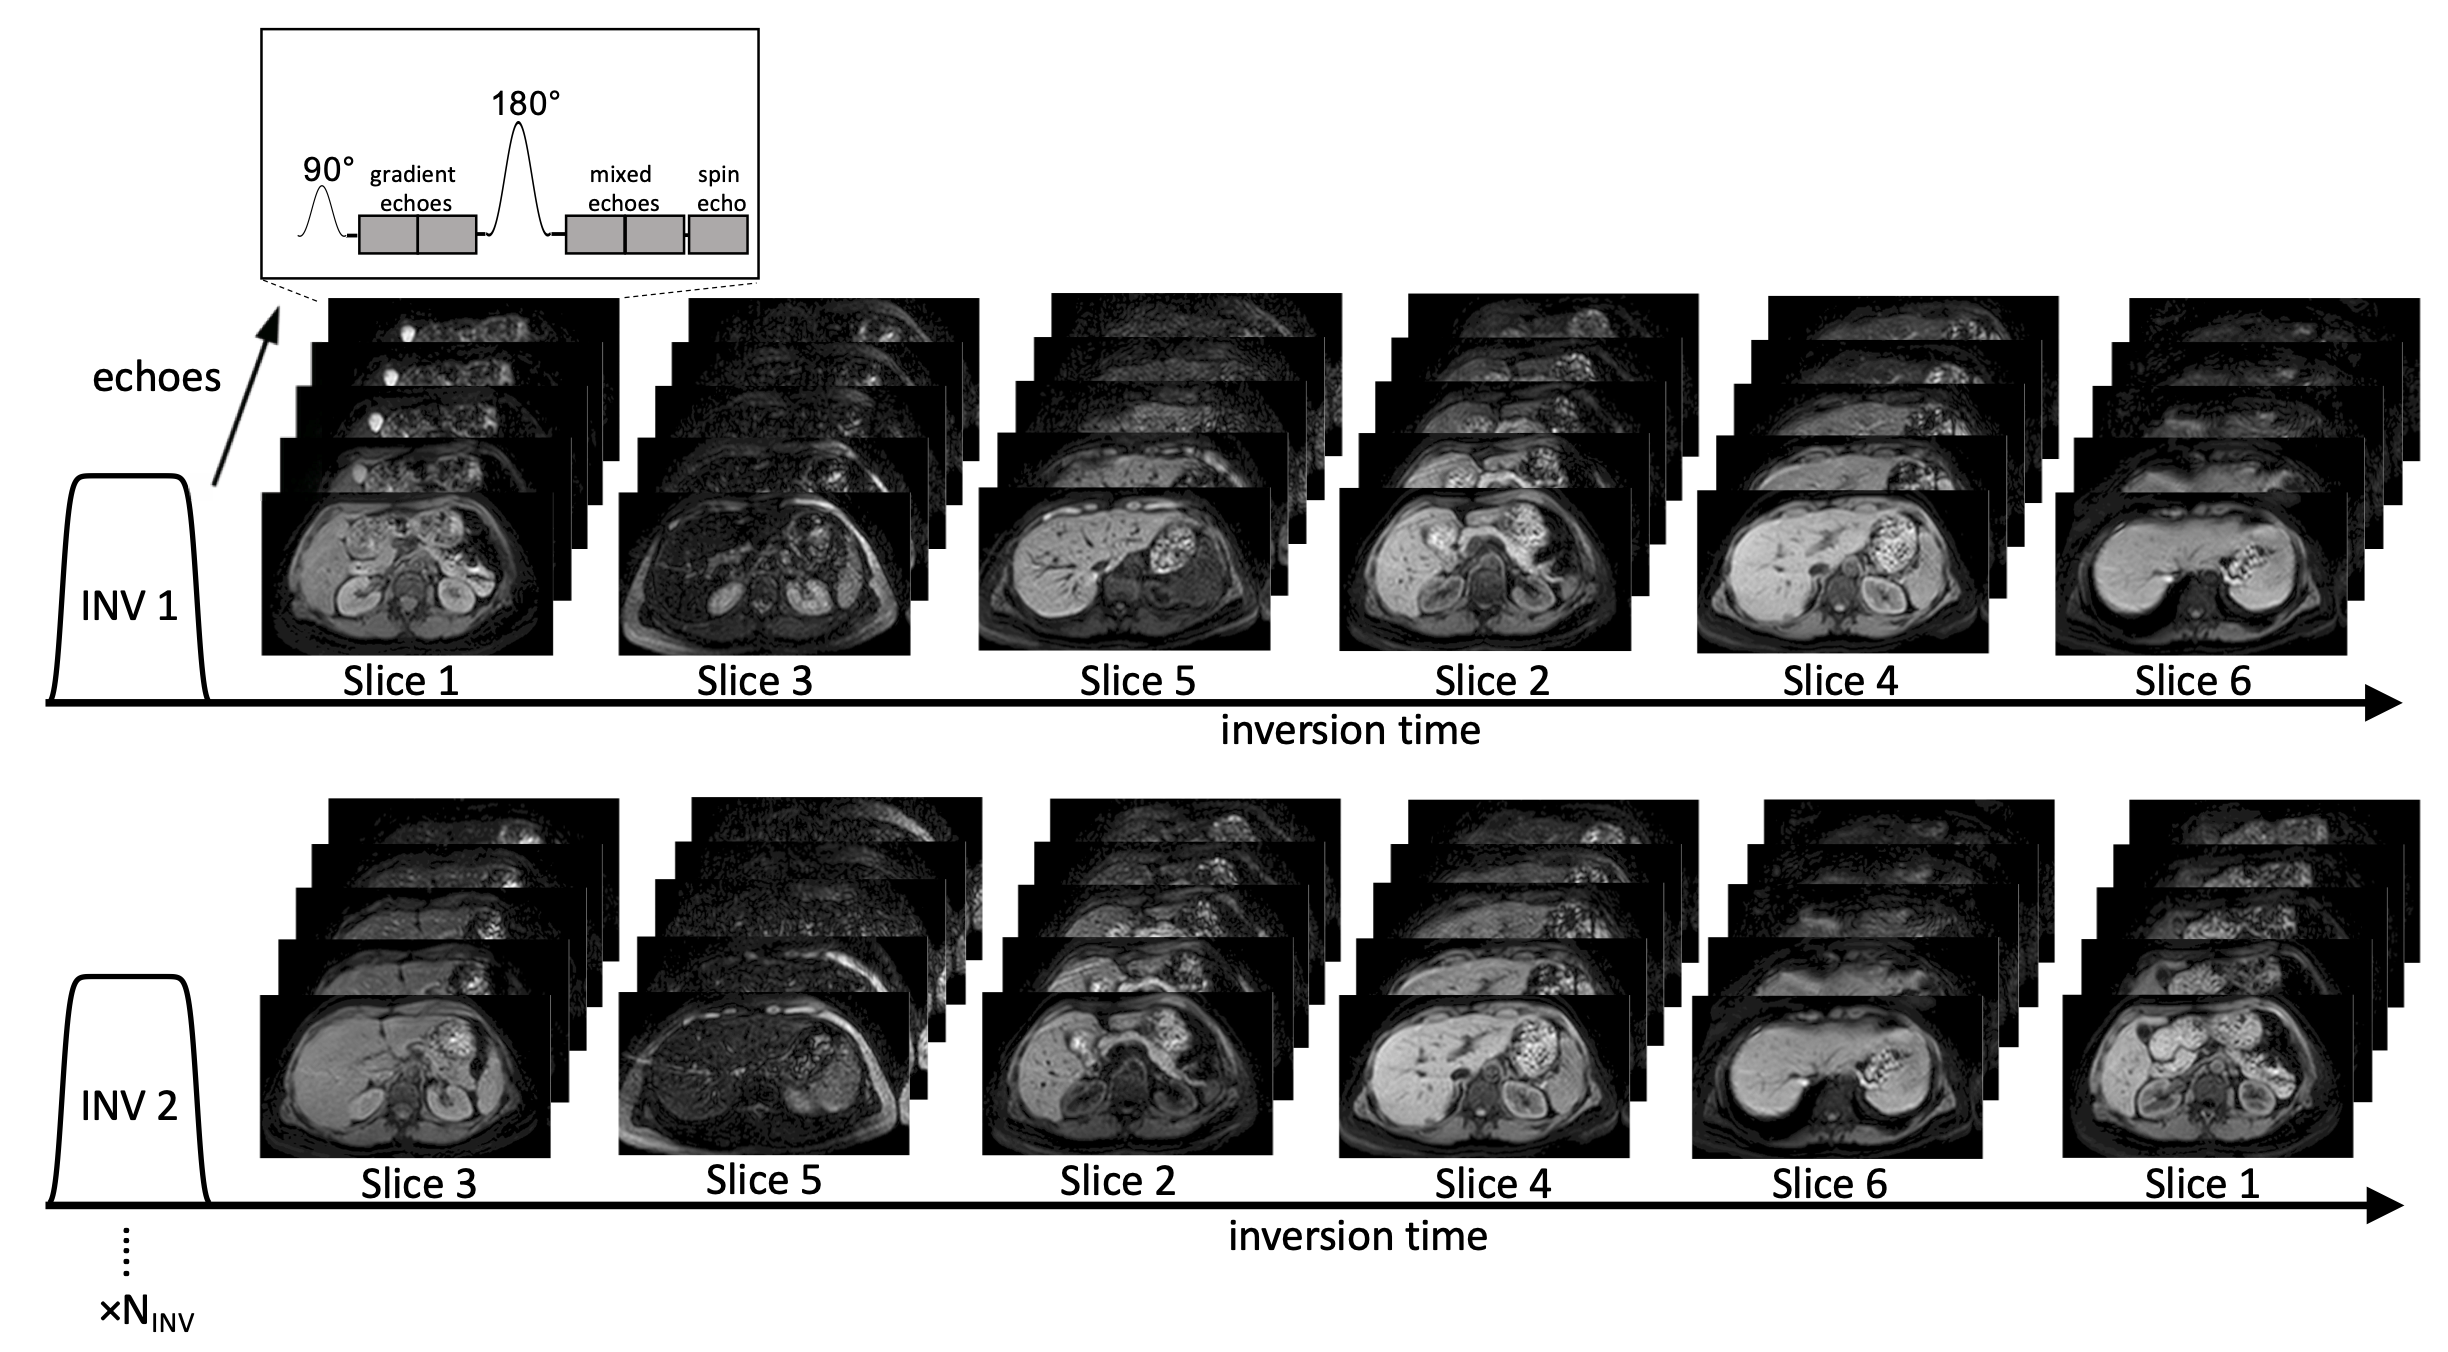
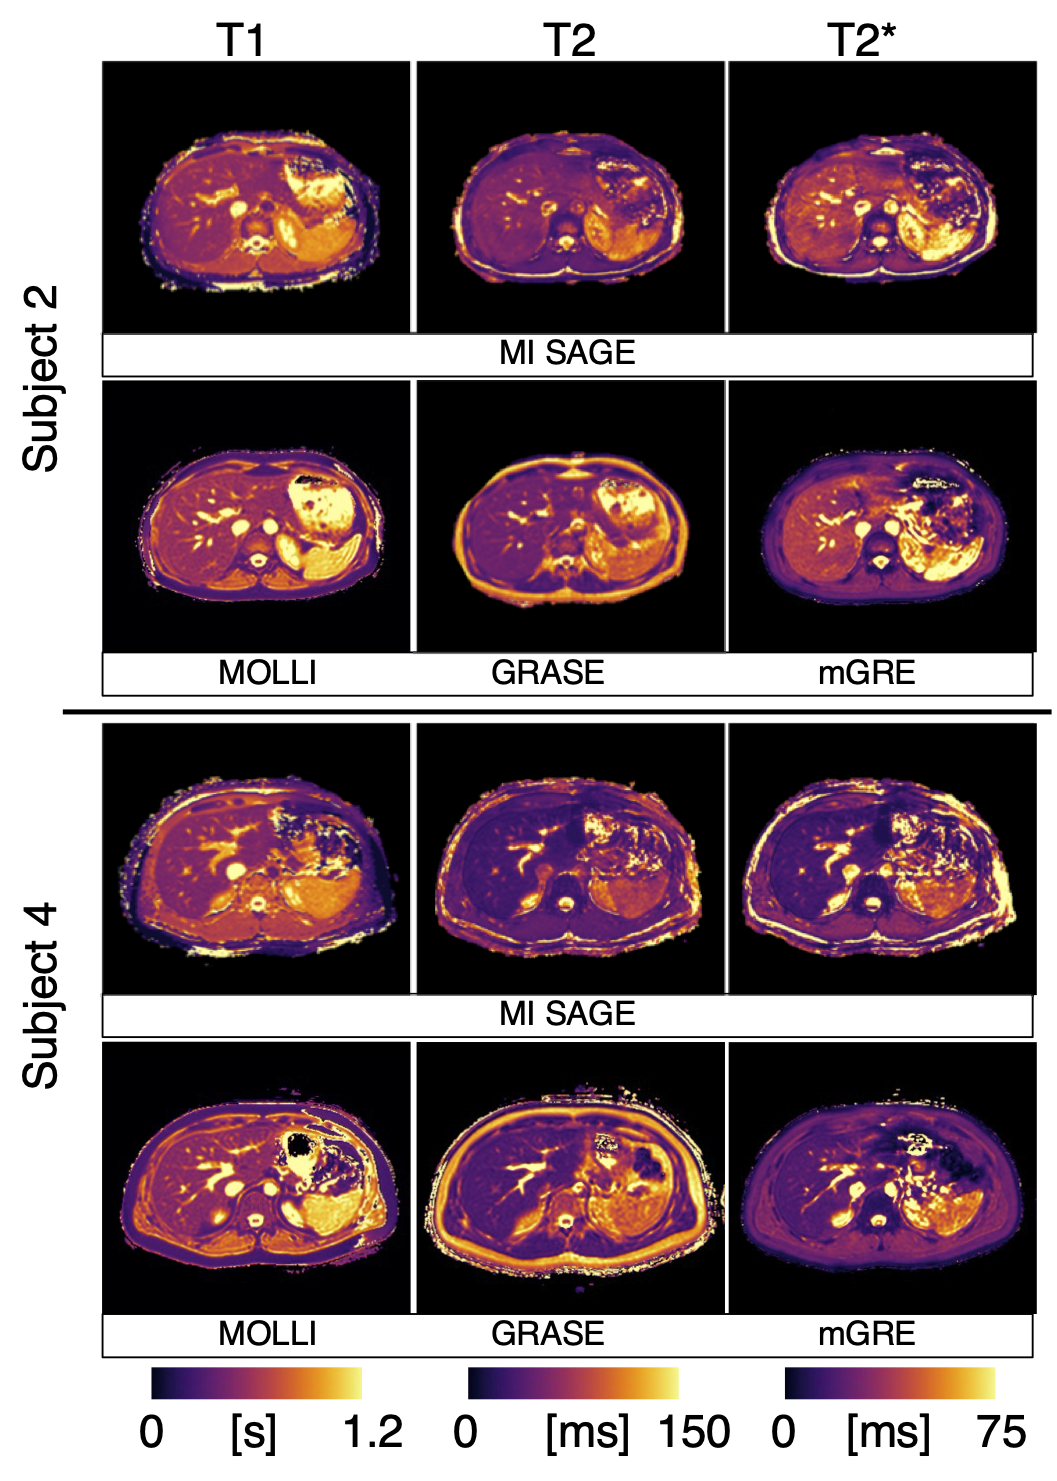
Fig. 2: Representative T1, T2, and T2* maps at a mid-level slice for two of the five subjects, obtained using MI-SAGE and commercially available mapping techniques (MOLLI, GRASE, and mGRE, respectively).
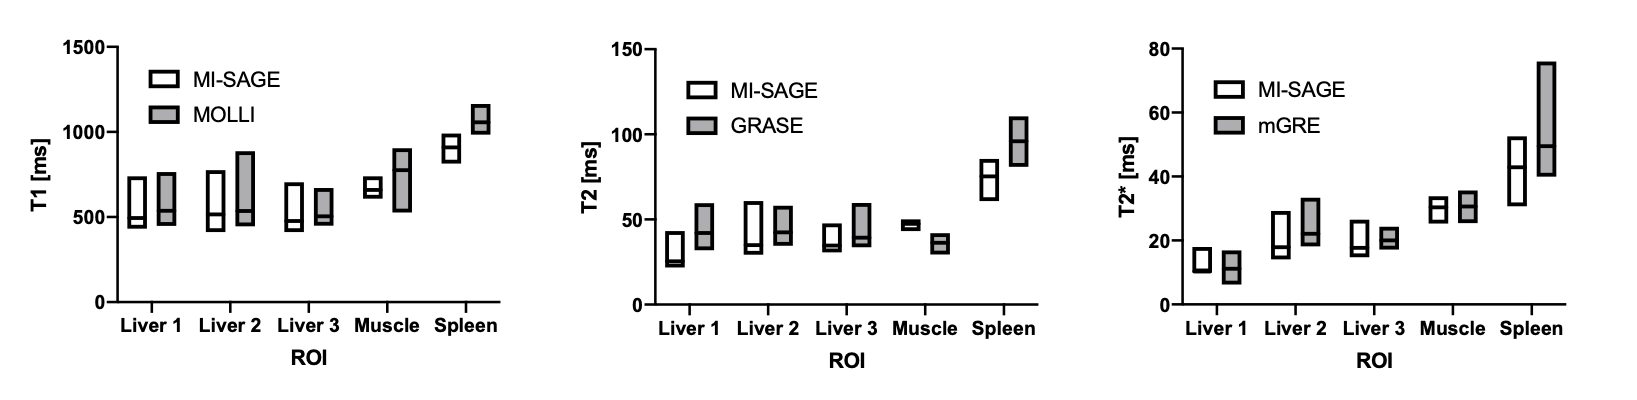
Fig. 3: Distribution of T1, T2, and T2* values in 5 ROIs drawn in one subject (subject 4) obtained using MI-SAGE and MOLLI, GRASE, and mGRE, respectively. The mean value within the ROI is shown by a line, and the boxes show the range of values within each ROI.
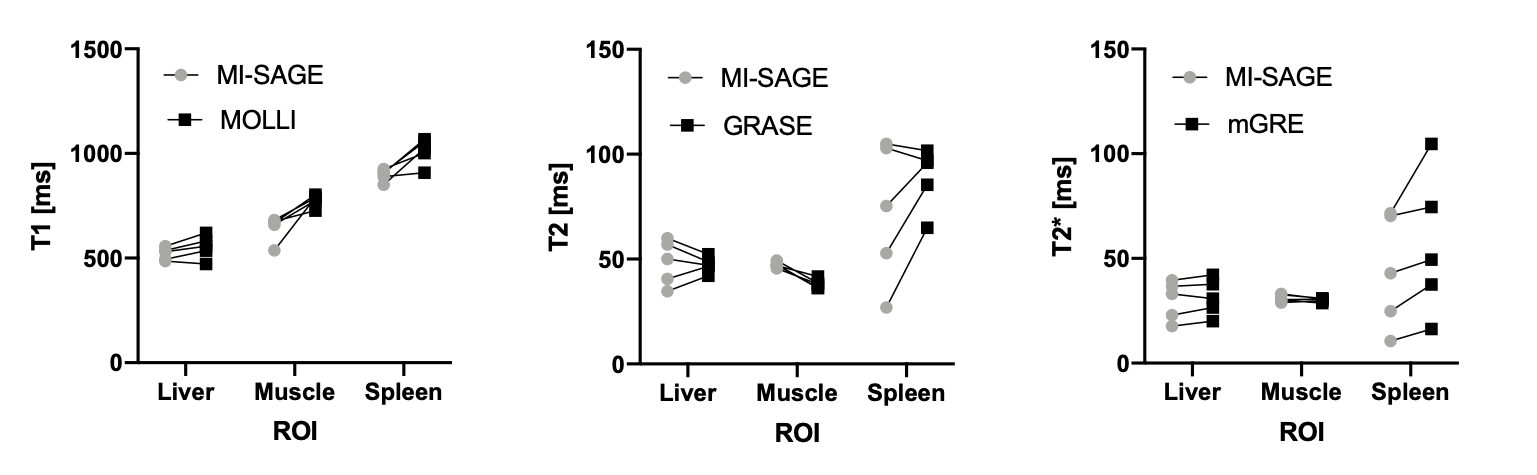
Fig 4: Scatter plots showing matched mean values from all subjects for T1, T2, and T2* obtained using MI-SAGE and MOLLI, GRASE, and mGRE, respectively. For the liver, the median of three ROIs is shown for each subject.