2285
Confidence Maps for Reliable Proton Density Fat-Fraction Estimation in the Presence of Low SNR
Jayse M Weaver1,2, Nathan T Roberts2,3, Diego Hernando1,2, and Scott B Reeder1,2,4,5,6
1Medical Physics, University of Wisconsin-Madison, Madison, WI, United States, 2Radiology, University of Wisconsin-Madison, Madison, WI, United States, 3Electrical Engineering, University of Wisconsin-Madison, Madison, WI, United States, 4Biomedical Engineering, University of Wisconsin-Madison, Madison, WI, United States, 5Medicine, University of Wisconsin-Madison, Madison, WI, United States, 6Emergency Medicine, University of Wisconsin-Madison, Madison, WI, United States
1Medical Physics, University of Wisconsin-Madison, Madison, WI, United States, 2Radiology, University of Wisconsin-Madison, Madison, WI, United States, 3Electrical Engineering, University of Wisconsin-Madison, Madison, WI, United States, 4Biomedical Engineering, University of Wisconsin-Madison, Madison, WI, United States, 5Medicine, University of Wisconsin-Madison, Madison, WI, United States, 6Emergency Medicine, University of Wisconsin-Madison, Madison, WI, United States
Synopsis
Chemical-shift-encoded MRI (CSE-MRI) is an established technique to estimate proton density fat-fraction (PDFF) as a quantitative imaging biomarker of hepatic steatosis. However, due in part to low flip angle acquisitions, CSE-MRI acquisitions often have low SNR leading to biased and noisy PDFF measurements. Unreliable PDFF measurements are particularly problematic considering clinically relevant PDFF thresholds may be as low as 3-5%. There are currently no methods to gauge the reliability of PDFF measurements. We propose a method for generating color-coded CSE-MRI estimation confidence maps, using a normalized residual metric to determine PDFF measurement reliability.
Introduction
Confounder-corrected chemical-shift-encoded MRI (CSE-MRI) is an established technique to quantify proton density fat-fraction (PDFF)1. Recent studies have shown that clinically relevant PDFF thresholds for diagnosing hepatic steatosis may be as low as 3%, demonstrating a need for accurate and precise measurements of low PDFF2,3. Due to accelerated acquisition times4, elevated iron content5, and the low flip angles used to avoid T1 bias, current CSE-MRI acquisitions often have low signal-to-noise ratios (SNR). However, at low SNR, PDFF estimates may be biased6,7 and noisy, i.e., unreliable.Currently, no methods exist for clinicians to gauge the reliability of CSE-MRI PDFF measurements. Therefore, the purpose of this work is to develop a method for generating confidence maps for CSE-MRI PDFF measurements. Confidence maps are displayed as a color-coded overlay on the PDFF map to inform analysts where measurements may or may not be reliable.
Methods
Proposed Metric:CSE-MRI methods to quantify PDFF involve fitting complex or magnitude data to a signal model, typically using non-linear least squares. In this work, we limit our analysis to magnitude-fitting. We propose a metric to characterize the goodness-of-fit based on the normalized residual sum of squares (NRSS), defined as:\begin{equation}NRSS = \frac{\sum_{TE}(|S_{TE}(\hat{\theta})|-|S_{TE,meas}|)^2}{\sum_{TE}|S_{TE,meas}|^2}\tag{1}\end{equation}where $$$S_{TE}$$$ is the signal model, $$$\hat{\theta}$$$ are the estimates of fat and water amplitudes and $$$R_2^\ast$$$, and $$$S_{TE,meas}$$$ is the measured signal. Based on a predetermined threshold for acceptable PDFF bias, chosen as ±0.5% for this work, a threshold NRSS value can be determined, as described below, above which PDFF estimates are considered unreliable.
Simulations:
Noiseless six-echo acquisitions were simulated using a spoiled gradient-echo (SGRE) signal model at 3.0T with varying fat and water amplitudes, $$$R_2^\ast=40s^{-1}$$$, and $$$f_B=30Hz$$$. Simulations used a typical first echo time and spacing (TE1=1.2ms, ΔTE=1.0ms). Complex Gaussian noise was added to simulated echo data, creating a range of low-to-high SNR values (1-40), and magnitude-fitting was used to estimate PDFF and $$$R_2^\ast$$$. NRSS was then calculated using Eq. (1). SNR was defined as the quotient of the echo amplitude at TE=0 and the standard deviation of the Gaussian noise.
Phantom experiments:
A cylindrical water-only phantom (PDFF=0%) doped with NiCl2 (GE Healthcare, Waukesha, WI) was imaged at 3.0T (Signa Premier, GE Healthcare) with a commercial multi-echo 3D SGRE sequence (IDEAL IQ, GE Healthcare) using the integrated body transmit/receive coil. SNR was modulated by varying flip angle. Acquisition parameters are listed in Table 1.
In vivo experiments:
With IRB approval and informed consent, a healthy volunteer was scanned at 3.0T using the same scanner, sequence, and coil as phantom experiments. The body coil was intentionally used to facilitate a range of low-to-acceptable SNR. SNR was also modulated by varying flip angle. Acquisition parameters are listed in Table 1.
Reconstruction and analysis:
Complex echo images were processed with a graph cut algorithm8 for initial parameter estimation, followed by magnitude-fitting to generate PDFF and $$$R_2^\ast$$$ maps. The mean PDFF in the phantom was measured in a 3,400-pixel/47cm2 circular region-of-interest (ROI) covering the entire phantom. In vivo mean PDFF was measured in two 500-pixel/12cm2 circular ROIs placed in the right and left liver lobes.
SNR was estimated from first-echo magnitude images using a background noise standard deviation method9.
Confidence maps are created as a semi-transparent overlay on the PDFF map, where voxels with an NRSS below the threshold are fully transparent, and voxels above the threshold are color-coded according to the effective SNR value corresponding with the NRSS value of the voxel.
Results
Simulations:CSE-MRI simulations demonstrate that low PDFF measurements are negatively biased at low SNR after magnitude-fitting (Figure 1). Simulation results showed that 6.8x10⁻³ was the NRSS threshold corresponding to an expected ±0.5% PDFF bias (Figure 2).
Phantom experiments:
As SNR increases with flip angle, PDFF mean and standard deviation improve (Figure 3). An NRSS threshold of 3.0x10⁻³ was determined from simulations using phantom TE1/ΔΤΕ (Table 1). As SNR decreases, more pixels in the confidence maps are flagged corresponding to the increasing PDFF bias.
In vivo experiments:
As SNR increases with flip angle, PDFF mean and standard deviation improve (Figure 4). An NRSS threshold of 4.2x10⁻³ was determined from simulations using in vivo TE1/ΔΤΕ (Table 1). As SNR decreases, more pixels in the confidence maps are flagged as unreliable. The source images included a region of low signal in the left lobe. PDFF measurements in this area exhibit bias and are flagged in the confidence map.
Discussion and Conclusions
In this work, we present a standardized method to generate confidence maps for PDFF estimation with CSE-MRI, using a normalized residual sum of squares (NRSS) metric. The NRSS threshold is specific to magnitude-fitting and is calculated for each TE1/ΔTE combination, using an acceptable PDFF bias (e.g., ±0.5%). Confidence maps provide a visual indicator of fitting performance and PDFF reliability and can guide analysts to avoid low-SNR regions where PDFF estimates may be biased.As a proof-of-concept, this work uses magnitude-fitting, assumes $$$R_2^\ast$$$ within a normal range, and a low field inhomogeneity, although extension to complex-fitting and cases with iron overload where high $$$R_2^\ast$$$ affects fitting performance should be straightforward. Future in vivo work will use magnetic resonance spectroscopy or high-SNR CSE-MRI acquisitions as the ground truth for PDFF.
Acknowledgements
The authors wish to acknowledge support from the NIH (R01 DK088925), as well as GE Healthcare who provides research support to the University of Wisconsin. Additionally, Dr. Reeder is a Romnes Faculty Fellow, and has received an award provided by the University of Wisconsin-Madison Office of the Vice Chancellor for Research and Graduate Education with funding from the Wisconsin Alumni Research Foundation.References
1. Yokoo T, Serai SD, Pirasteh A, et al. Linearity, Bias, and Precision of Hepatic Proton Density Fat Fraction Measurements by Using MR Imaging: A Meta-Analysis. Radiology. 2018;286(2):486-498. doi:10.1148/radiol.20171705502. Rehm JL, Wolfgram PM, Hernando D, Eickhoff JC, Allen DB, Reeder SB. Proton density fat-fraction is an accurate biomarker of hepatic steatosis in adolescent girls and young women. Eur Radiol. 2015 Oct;25(10):2921-30. doi: 10.1007/s00330-015-3724-1.
3. Nasr P, Forsgren MF, Ignatova S, Dahlström N, Cedersund G, Leinhard OD, Norén B, Ekstedt M, Lundberg P, Kechagias S. Using a 3% Proton Density Fat Fraction as a Cut-Off Value Increases Sensitivity of Detection of Hepatic Steatosis, Based on Results From Histopathology Analysis. Gastroenterology. 2017 Jul;153(1):53-55.e7. doi: 10.1053/j.gastro.2017.03.005.
4. Ruby JA, Hernando D, Campo CA, Shimakawa A, Vigen KK, Holmes JH, Wang K, Reeder SB. Motion insensitive quantification of liver proton density fat-fraction using a single-shot 2D technique. Proc. Intl. Soc. Mag. Reson. Med. 24 (2016) Abstract 3836.
5. Horng DE, Hernando D, Reeder SB. Quantification of liver fat in the presence of iron overload. J Magn Reson Imaging. 2017 Feb;45(2):428-439. doi: 10.1002/jmri.25382.
6. Holmes JH, Hernando D, Wang K, Shimakawa A, Roberts N, Reeder SB. Analysis of bias with SNR in multi-echo chemical shift encoded fat quantification. Proc. Intl. Soc. Mag. Reson. Med. 24 (2016) Abstract 3273.
7. Roberts NT, Hernando D, Holmes JH, Wiens CN, Reeder SB. Noise properties of proton density fat fraction estimated using chemical shift-encoded MRI. Magn Reson Med. 2018 Aug;80(2):685-695. doi: 10.1002/mrm.27065.
8. Hernando D, Kellman P, Haldar JP, Liang ZP. Robust water/fat separation in the presence of large field inhomogeneities using a graph cut algorithm. Magn Reson Med. 2010 Jan;63(1):79-90. doi: 10.1002/mrm.22177.
9. Dietrich O, Raya JG, Reeder SB, Reiser MF, Schoenberg SO. Measurement of signal-to-noise ratios in MR images: influence of multichannel coils, parallel imaging, and reconstruction filters. J Magn Reson Imaging. 2007 Aug;26(2):375-85. doi: 10.1002/jmri.20969.
Figures

Table 1: Acquisition parameters for the multi-SNR phantom and in vivo CSE-MRI experiments. TE1/ΔTE was automatically calculated by the pulse sequence based on voxel dimensions. SNR was modulated by varying flip angle.
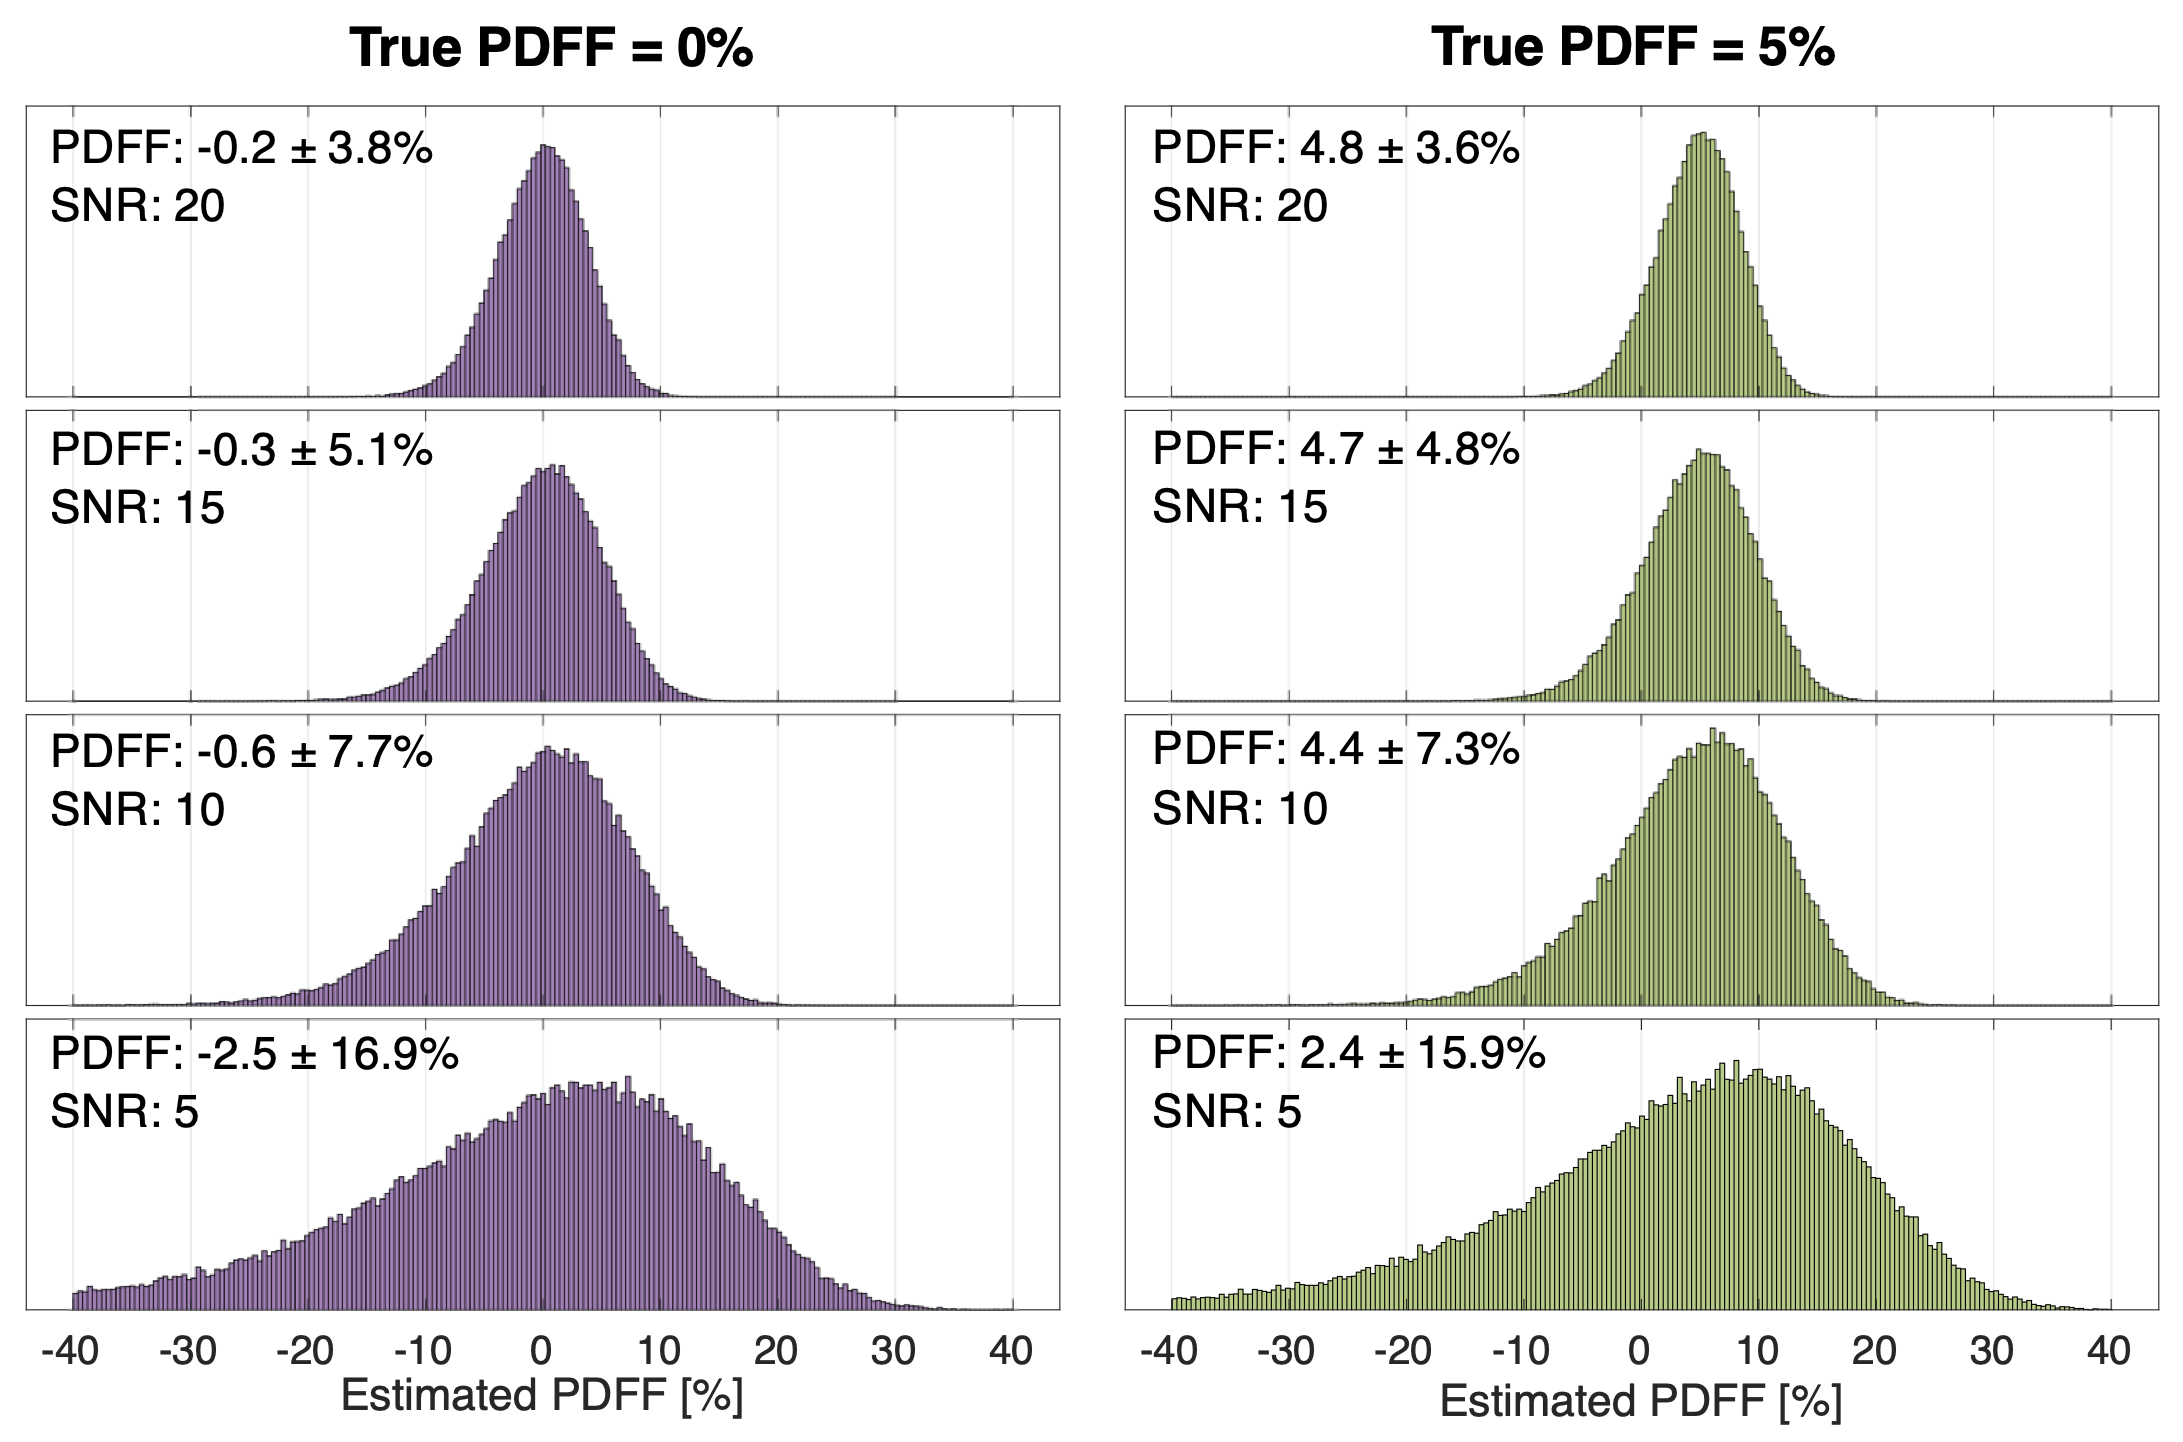
Figure 1: Mean PDFF bias and standard deviation increase as SNR decreases for magnitude-fitting, as seen in the above histograms. For each SNR (5,10,15,20), 100,000 independent pixels with a true PDFF of 0% (left) and 5% (right) were simulated and PDFF was quantified by magnitude-fitting. These simulations demonstrate asymmetric PDFF distribution as SNR decreases, which introduces bias in PDFF measurements obtained by averaging.
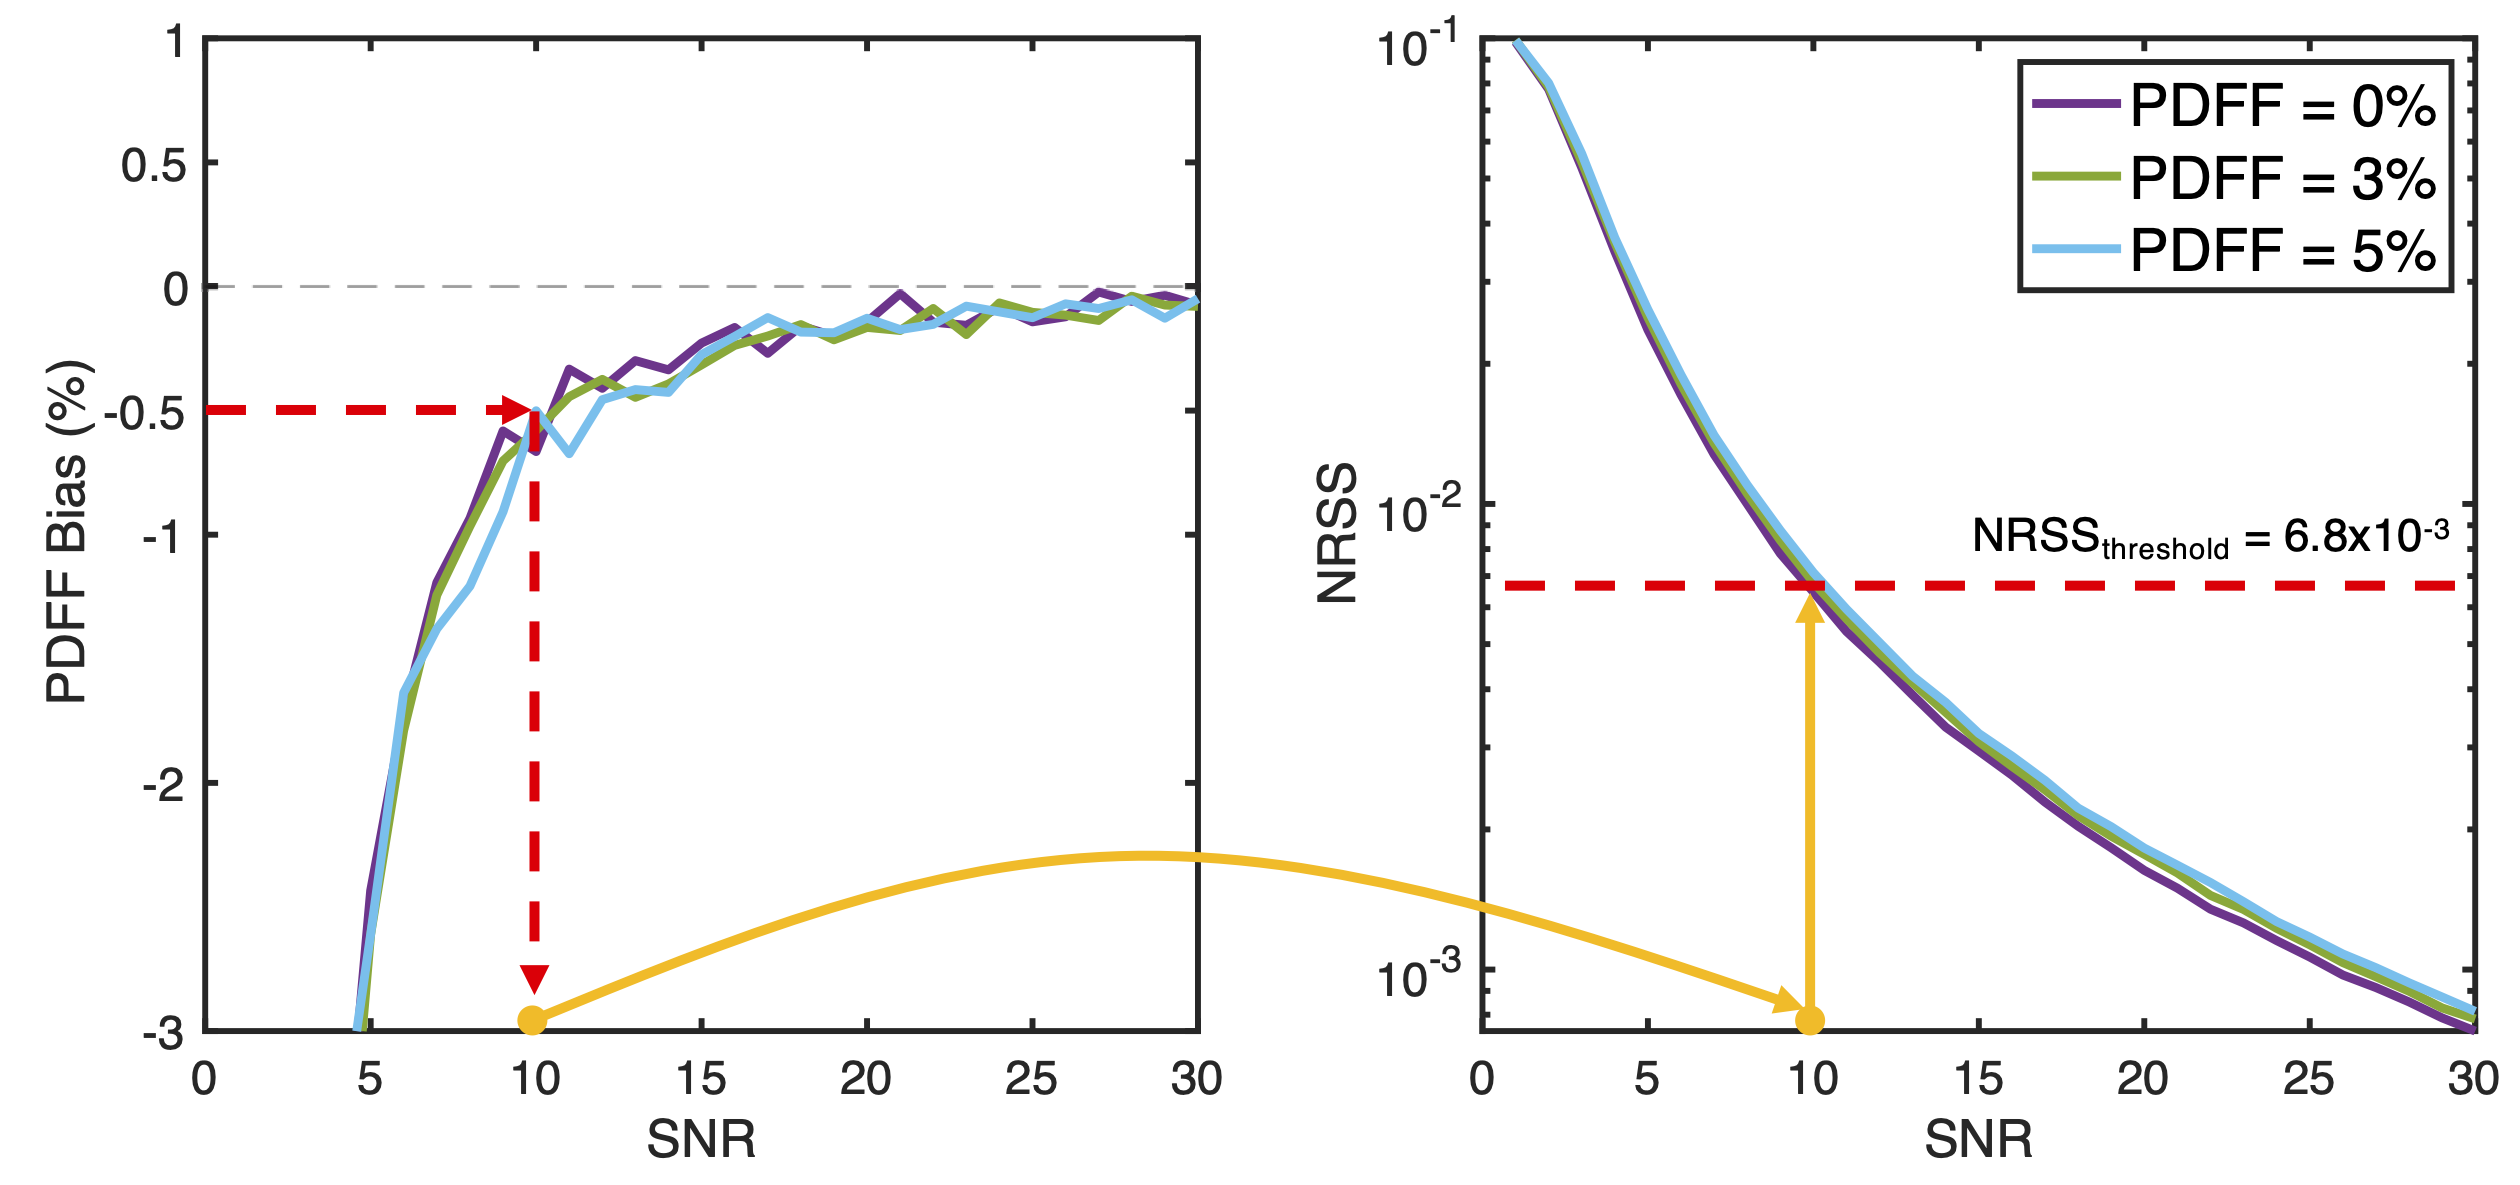
Figure 2: An example of NRSS threshold selection based on simulations of PDFF bias at low SNR and a TE1/ΔΤΕ of 1.2/1.0 ms. For each PDFF and SNR pair, PDFF bias (left) and NRSS (right) are shown. A maximum allowed PDFF bias of -0.5% occurs at an SNR of 10, which corresponds to an NRSS of approximately 6.8x10⁻³. Any pixel with a NRSS above 6.8x10⁻³ would be flagged as unreliable in a resulting confidence map. This process must be repeated for different echo timing and allowed PDFF bias, which may be application-specific.
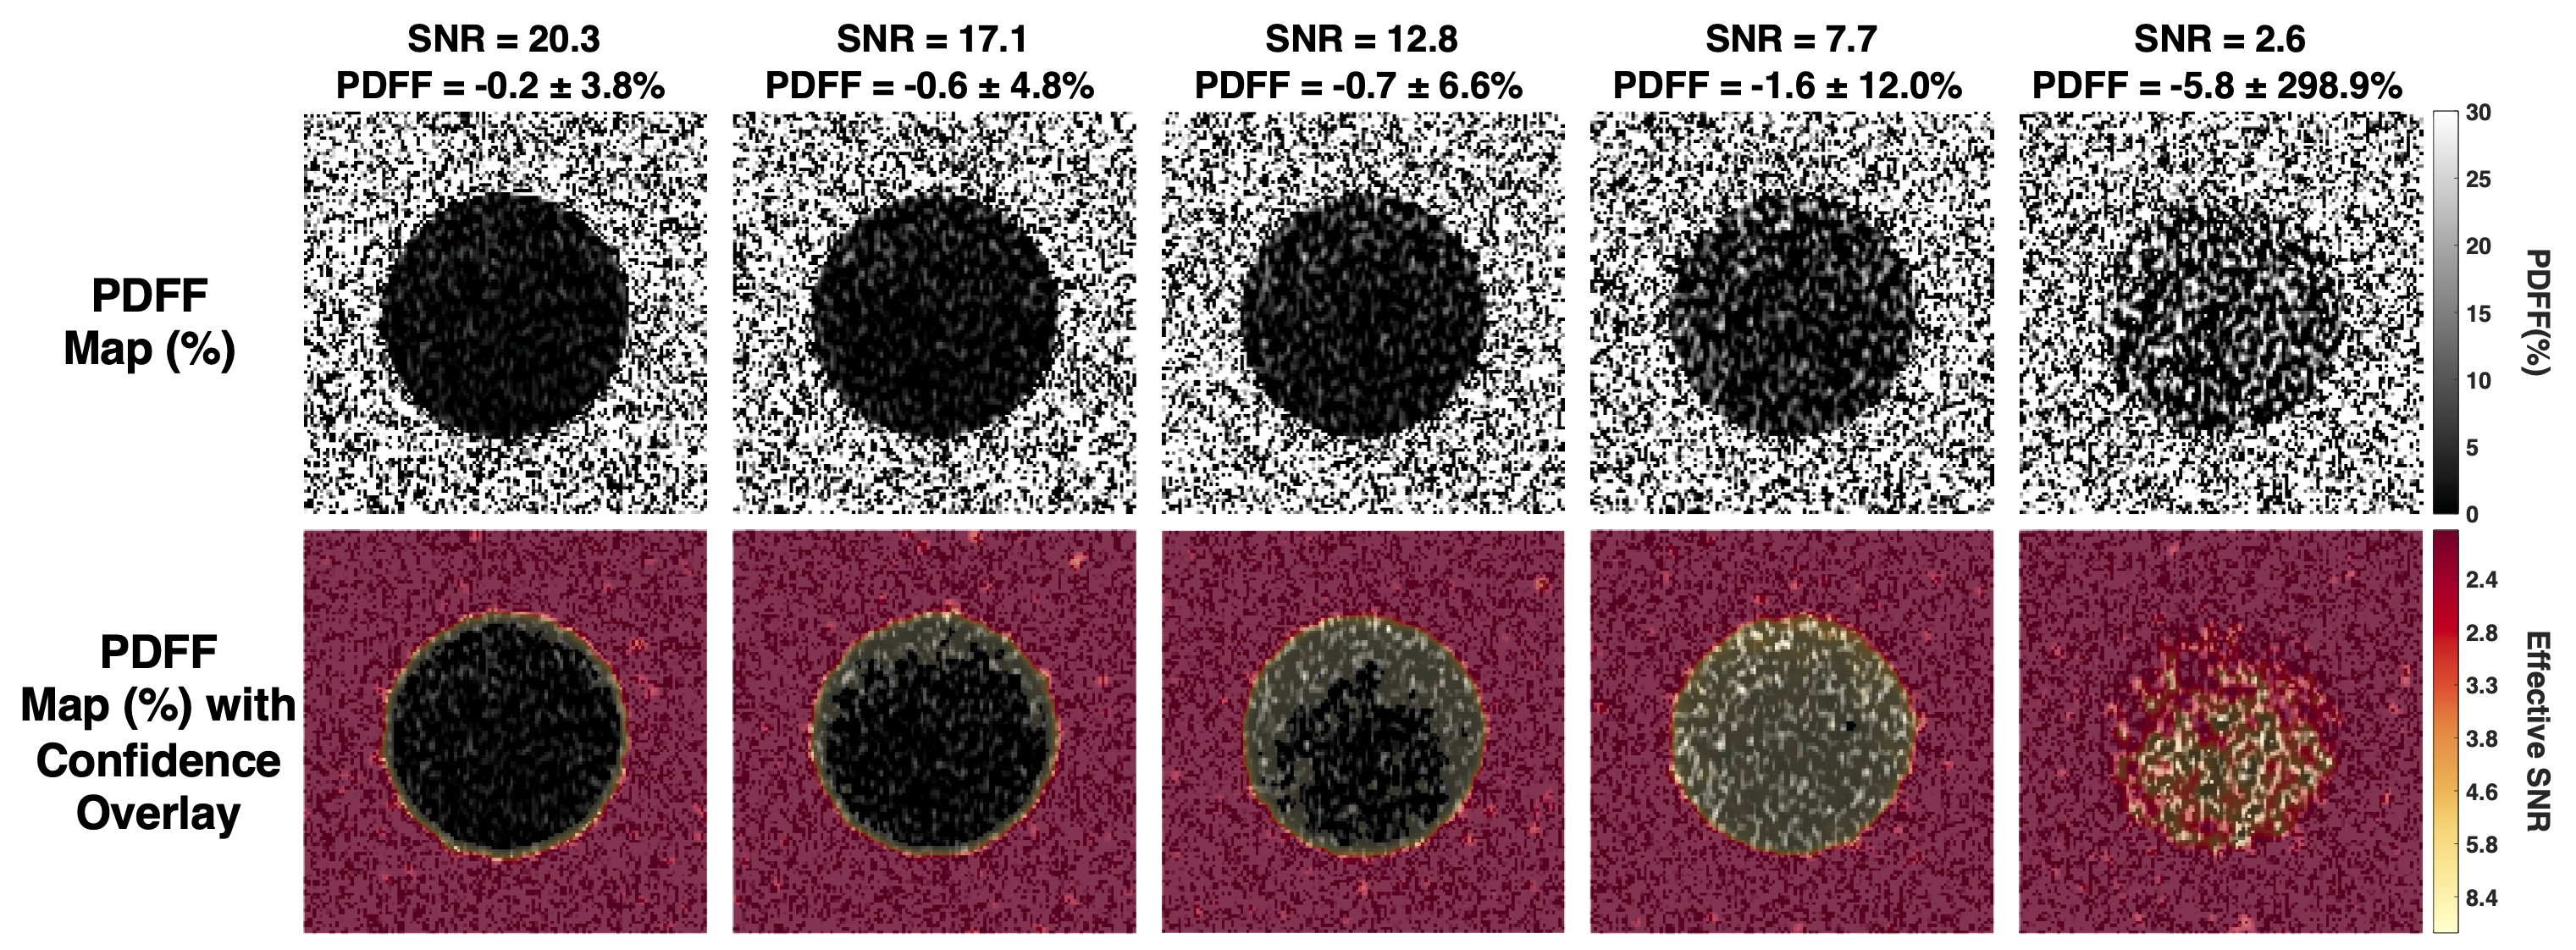
Figure 3: Confidence maps created using NRSS thresholds applied to PDFF maps of a phantom. CSE-MRI acquisition parameters are shown in Table 1. Multiple flip angles were used to modulate SNR. In the confidence maps, voxels with an NRSS above the threshold are color-coded to denote unreliable results. As SNR decreases, more pixels are flagged as unreliable as the PDFF bias increases and the NRSS and effective SNR increases. An NRSS threshold of 3.0x10⁻³ was determined from simulations using acquisition parameters (Table 1) and a maximum allowed PDFF bias of ±0.5% at SNR=15.
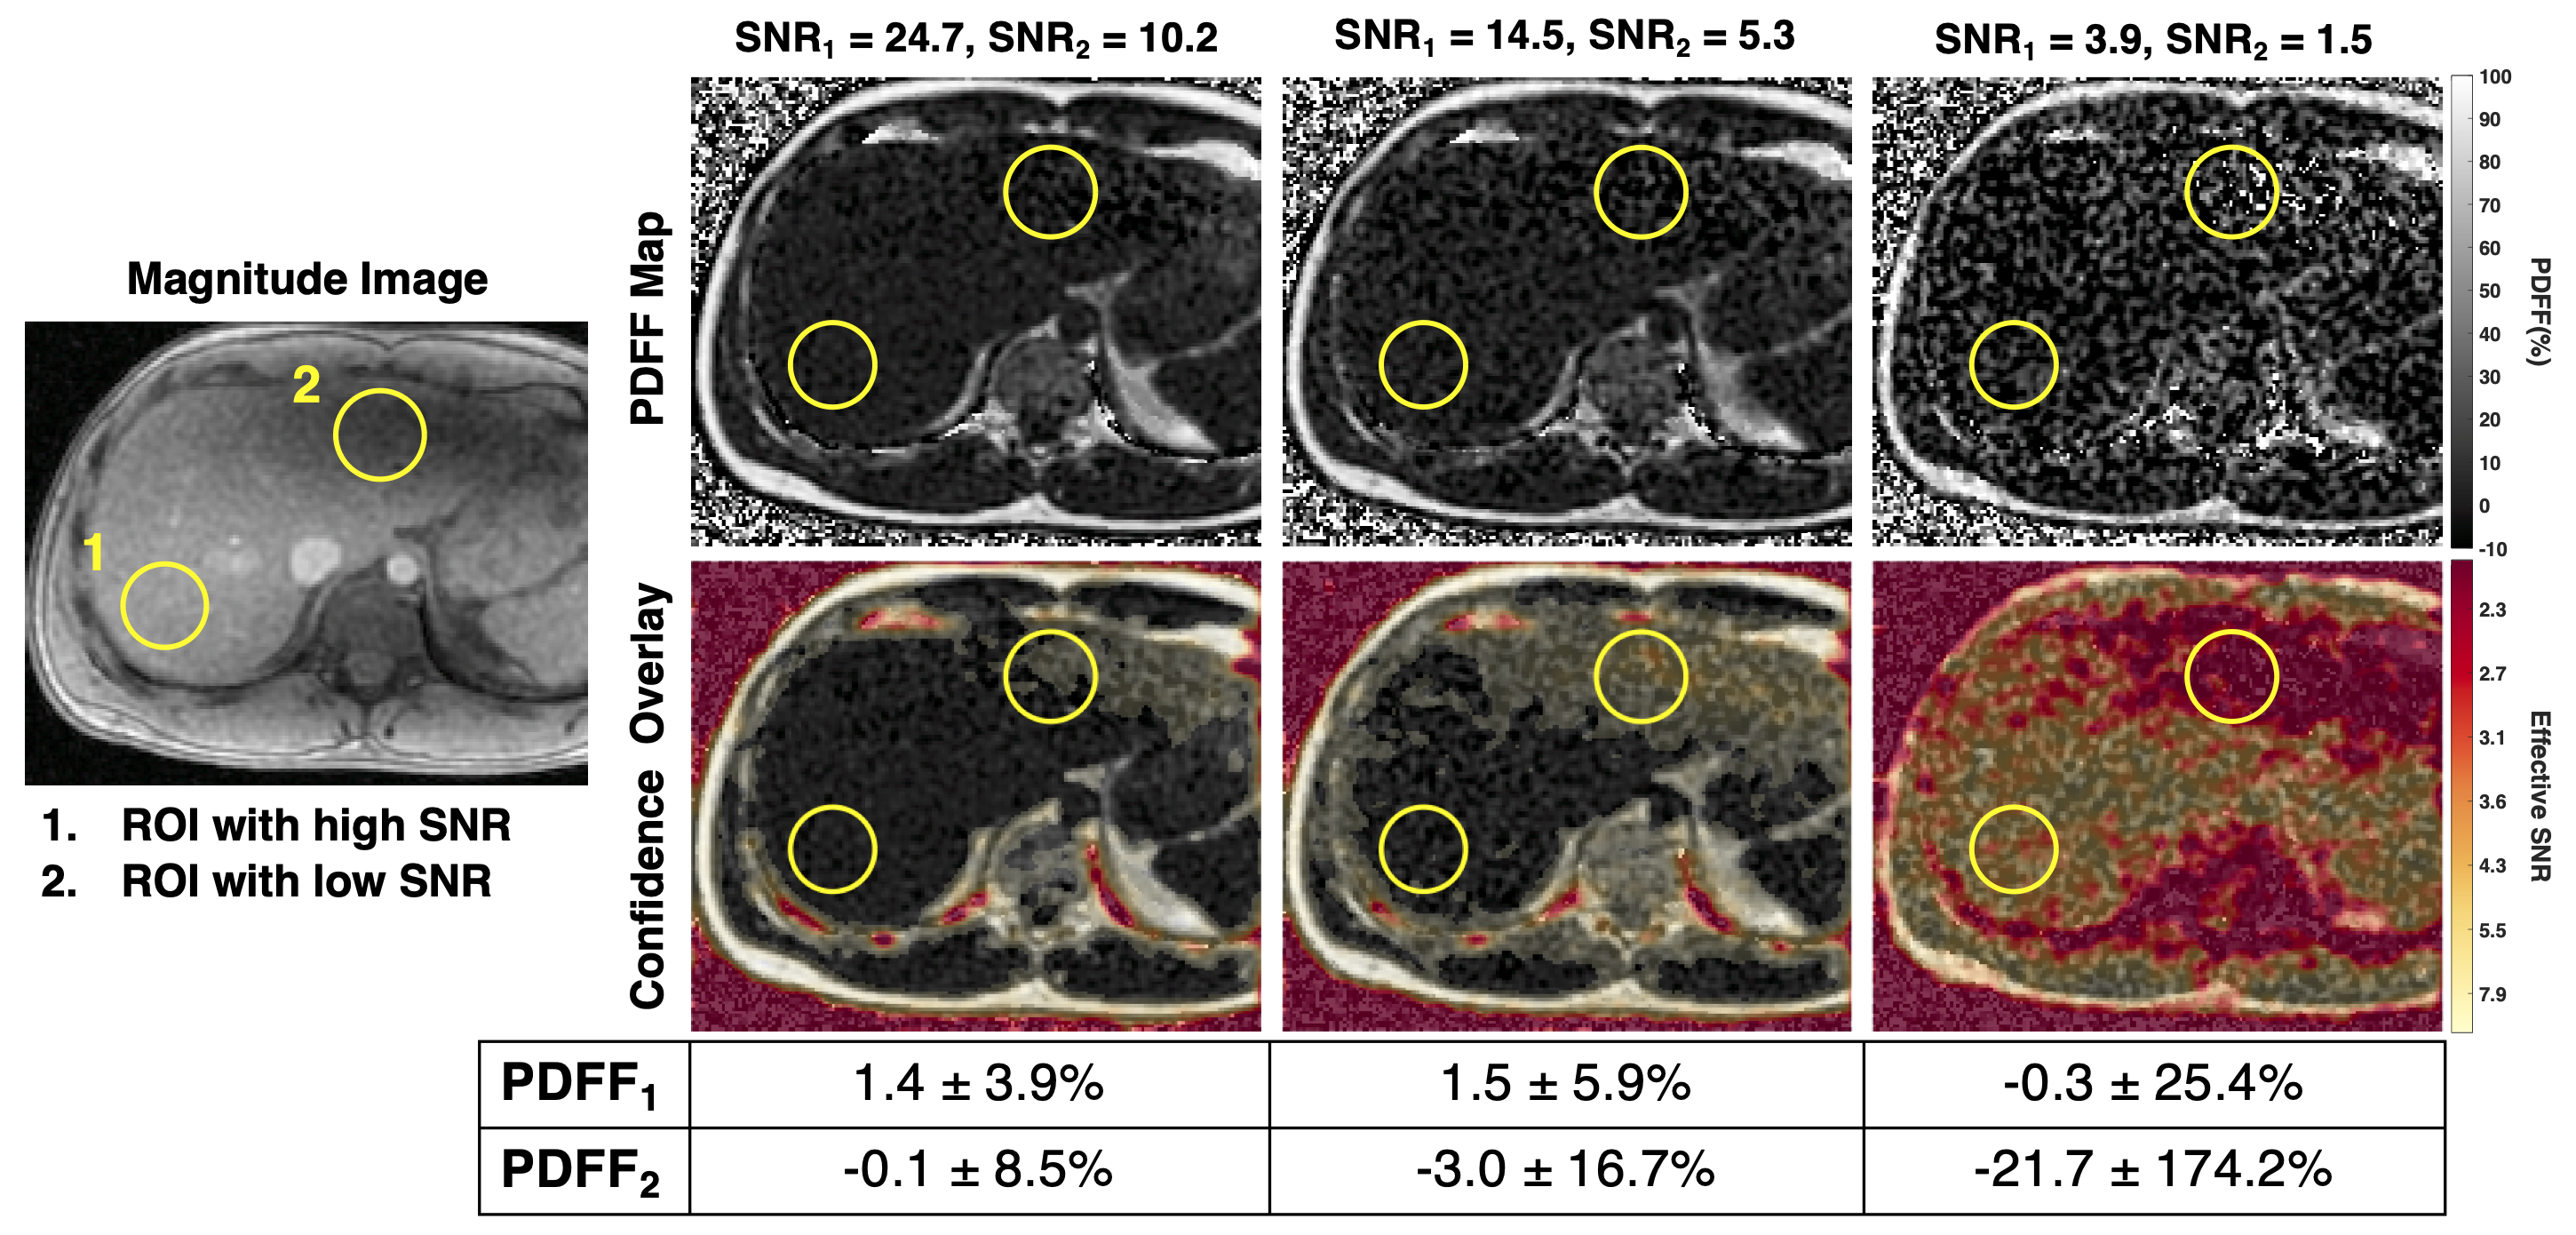
Figure 4: Confidence maps can be used to avoid areas in PDFF maps that are biased due to low SNR. Shown in the magnitude image are two ROIs, one in an area with higher SNR performance (#1) in the right lobe, compared to a second ROI (#2) in the left lobe. In the confidence maps, voxels with an NRSS above the threshold (corresponding to an effective SNR) are color-coded to denote unreliable results. With the confidence map, ROI #2 would be avoided. An NRSS threshold of 4.2x10⁻³ was determined from simulations using acquisition parameters (Table 1) and a maximum allowed PDFF bias of ±0.5% at SNR=13.
DOI: https://doi.org/10.58530/2022/2285