2282
Comparison of vein diameter and susceptibility values in individuals with and without APOE ε4 allele1Concordia University, Montreal, QC, Canada, 2PERFORM Centre, Concordia University, Montreal, QC, Canada, 3Laboratory of Brain and Cognition, Department of Neurology and Neurosurgery, McGill University, Montreal, QC, Canada, 4Departments of Psychiatry and Psychology, Neurological Institute, McGill University, Montreal, QC, Canada, 5McConnell Brain Imaging Centre, Montreal Neurological Institute (MNI), McGill University, Montreal, QC, Canada, 6Centre de Recherche de l’Institut Universitaire de Geriatrie de Montreal, Montreal, QC, Canada, 7Centre de Recherche de l’Institut de Cardiologie de Montreal, Montreal, QC, Canada, 8StoP-AD Centre, Douglas Mental Health Institute Research Centre, Montreal, QC, Canada, 9Douglas Mental Health University Institute, McGill University, Montreal, QC, Canada, 10Psychology, University of Amsterdam, Amsterdam, Netherlands, 11Neurophysics, Max Planck Institute for Human Cognitive and Brian Sciences, Leipzig, Germany, 12Neurology, Max Planck Institute for Human Cognitive and Brian Sciences, Leipzig, Germany
Synopsis
Previous studies have shown an increase in oxygen extraction fraction (OEF) in individuals with Alzheimer’s disease (AD). Here, we investigate if vein diameters and susceptibility values measured with quantitative susceptibility maps (QSM), can be used as a biomarker in individuals with the APOE ε4 allele, which confers an increased risk of developing AD for detecting early changes in venous and metabolic properties.
Introduction
Alzheimer’s disease (AD) is a neurodegenerative disorder and the most common form of dementia1. Individuals with AD demonstrate significantly decreased cerebral blood flow (CBF)2,3, and cerebral rate of oxygen consumption (CMRO2)4, as well as an increase in oxygen extraction fraction (OEF) measured using positron emission tomography (PET)4,5. Quantitative susceptibility maps (QSM), a non-invasive alternative of PET, exploits the paramagnetic nature of deoxyhemoglobin to yield a quantitative measure of OEF6. Importantly, QSM in AD demonstrates high OEF compared to healthy controls in veins of the thalamus and dentate nuclei2. Moreover, QSM can also measure other venous properties which may be changed in AD7–9, and used to improve OEF quantification by taking partial volume effects into account. Thus, QSM is likely a promising biomarker for the quantification of OEF in AD, and to characterize it’s prodromal stage. Here, we investigate venous properties and susceptibility differences in individuals at greater risk of AD, due to presence of the APOE ε4 allele, compared to a lower risk group.Methods
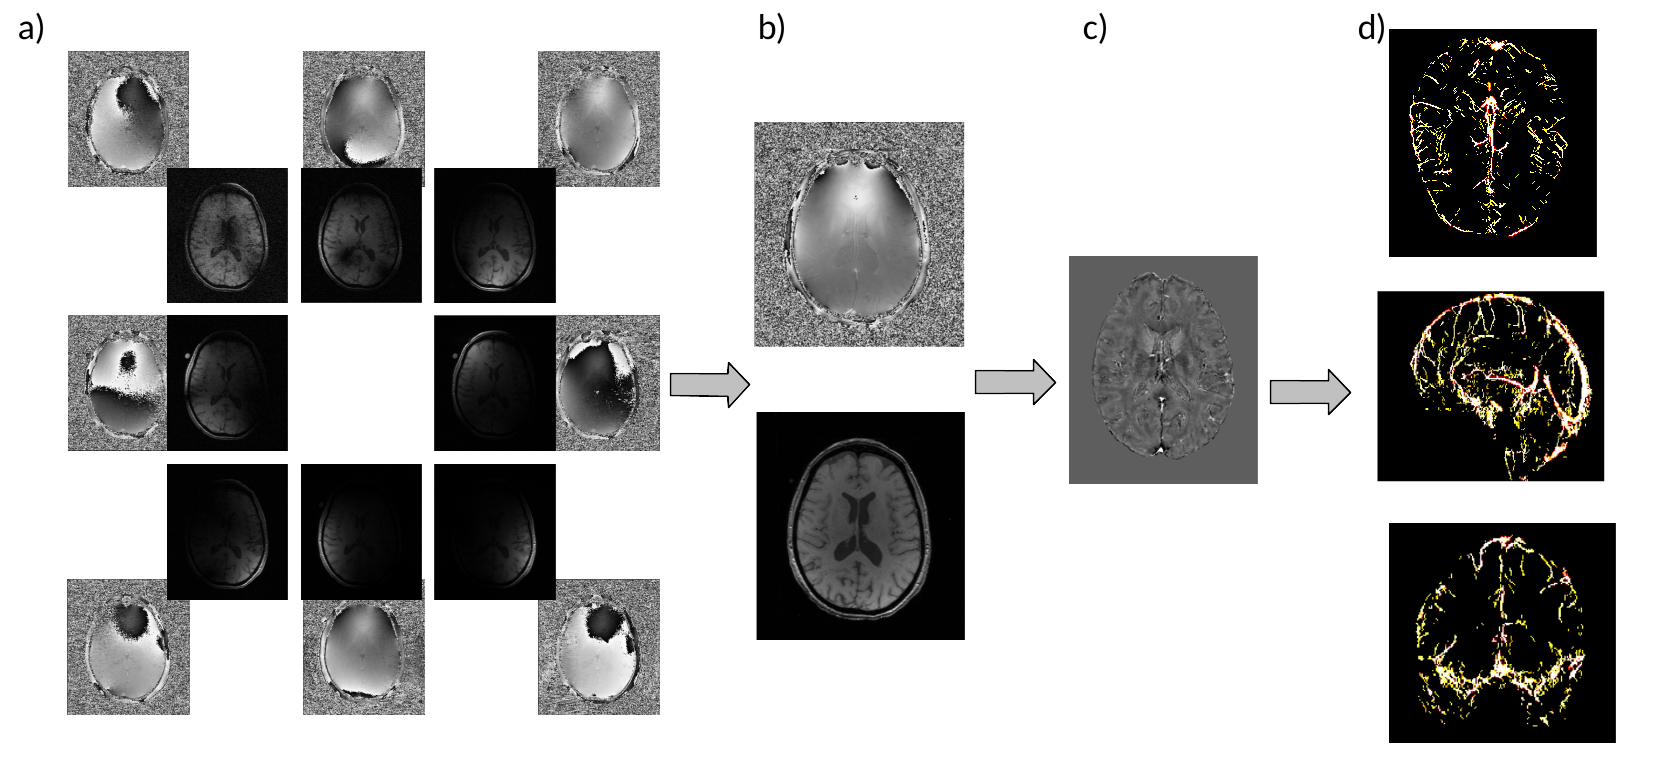
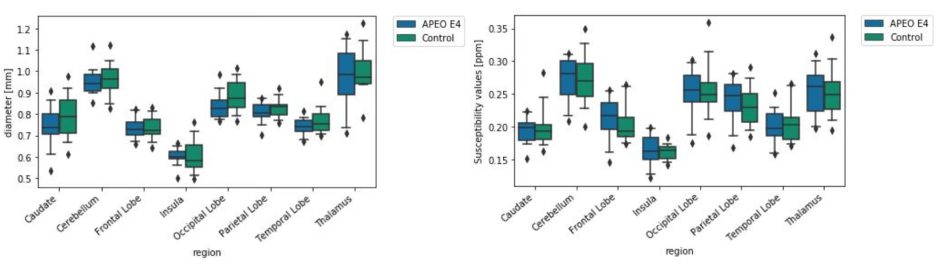
Data from the PREVENT-AD study was used10. A subsample of the study with the presence of APOE ε4 allele (n =14), were chosen at random, and then sex and age matched to participants without the APOE ε4 allele (control group, n = 14) (age: 66.71 ± 4.08 , 8 females). The data set was acquired on a 3T Siemens PRISMA scanner. Here, MPRAGE (T1w) images, low resolution gradient echo (GRE) multi echo (ME) fieldmaps, and high resolution GRE (QSM) sequence with 1 echo time were used. The T1w images were utilized for registration to MNI space, and QSM images were registered to T1w. The QSM reconstruction was completed on the high resolution GRE sequence. Data from all 32 channels were combined using the low resolution fieldmap with POEM11, and the TGV QSM toolbox12 was used for reconstruction. An in-house multiscale vessel filter was applied on the reconstructed QSM images to segment the venous vasculature9,13 with the ATAG atlas as negative prior to exclude the basal ganglia14, yielding vessel probability and diameter maps (Fig.1). The mean vessel diameter for each group was calculated in each region of the FSL (version 6.0.5) MNI structural atlas15,16 (Fig.2 (left)). Susceptibility values within the veins were averaged across the same regions (see Fig.2 (right)).Results
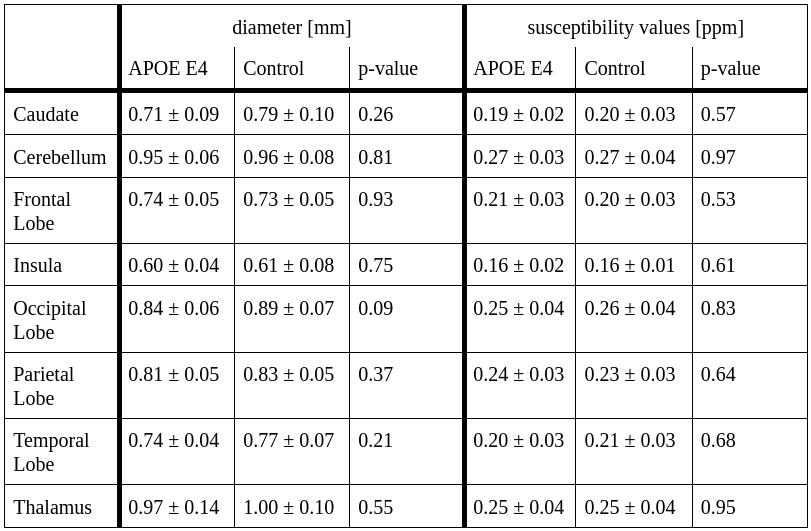
The mean vein diameter and susceptibility values for the APOE ε4 allele and control groups for each region in the MNI atlas are shown in Tab.1. Independent samples t-tests demonstrated no significant difference between the two groups (Tab.1). However a trend towards higher diameters across some regions, most notably the occipital lobe (Fig.2, Tab.1) was identified. While the mean susceptibility values were similar between both groups, Fig.3 shows slightly higher median values in the APOE ε4 group across all regions.Discussion
Here,preliminary results demonstrate no significant differences in the diameter or susceptibility values between those with and without APOE ε4 allele. Given the small sub-sample size, these results should be interpreted with caution. Median values showed a trend for larger diameters in the control group compared to the APOE ε4 group, approaching significance in the occipital lobe. While the mean susceptibility values are similar, the median reveals systematically slightly higher susceptibility values in participants with the ε4 allele, in line with previous AD results2. Thus, our results may be underpowered, and the use of the full sample in future analyses may reveal differences in diameter and susceptibility. Previous work demonstrated significantly higher local susceptibility in AD patients compared to healthy controls in the left dentate nucleus, and bilateral thalamic veins2. Moreover, others showed increased OEF values in temporo-parietal regions using PET4. Identifying differences in these properties in younger and cognitively normal individuals at risk for developing AD may require use of the full sample, as well as the use of an atlas with a greater number of regions for a more fine-grained spatial analysis. Future analyses of this data will also investigate OEF. This was not possible here due to data quality issues in the ventricles, preventing an accurate measurement of the susceptibility shift between CSF and tissue, and requiring optimization of the QSM reconstruction. Furthermore, we will use vessel diameter for a more accurate estimation of OEF. This will help mitigate the effects of systematic bias towards larger vessels in the control group, leading to greater partial volume bias and therefore lower OEF values in the APOE ε4 group. Finally, statistical sex differences were not investigated due to power concerns. As females with the APOE ε4 allele have an increased risk of developing AD compared to males3, it is possible that there are sex differences in presence of the APOE ε4 allele on venous properties and susceptibility in males versus females. We aim to answer this in future work with a larger sample from this study.Conclusion
No significant regional differences in venous diameter and susceptibility values were observed between APOE ε4 carriers and non-carriers in this preliminary sample. Future work will use the complete PREVENT-AD dataset to investigate differences in diameter and susceptibility in more specific regions, as well as potential sex differences in the link between AD genetic risk and venous properties.Acknowledgements
Data used in preparation of this article were obtained from the Pre-symptomatic Evaluation of Novel or Experimental Treatments for Alzheimer’s Disease (PREVENT-AD) program (https://douglas.research.mcgill.ca/stop-ad-centre), data release 6.0 (2020). A complete listing of PREVENT-AD Research Group can be found in the PREVENT-AD database: https://preventad.loris.ca/acknowledgements/acknowledgements.php?date=[2019-06-03]. The investigators of the PREVENT-AD program contributed to the design and implementation of PREVENT-AD and/or provided data but did not participate in analysis or writing of this report. The authors would also like to thank the Fonds de recherche du Québec - Nature et technologies (FRQNT) (JH), the Natural Sicence and Engineering Research Council (NSERC RGPIN-2015-04665) (JH), and the Heart and Stroke Foundation (Grant-in-Aid G-17-0018336) (BI),
References
- Breijyeh Z, Karaman R. Comprehensive Review on Alzheimer’s Disease: Causes and Treatment. Mol Basel Switz. 2020;25(24):E5789. doi:10.3390/molecules252457892.
- Liu Y, Dong J, Song Q, et al. Correlation Between Cerebral Venous Oxygen Level and Cognitive Status in Patients With Alzheimer’s Disease Using Quantitative Susceptibility Mapping. Front Neurosci. 2021;14:570848. doi:10.3389/fnins.2020.5708483.
- Espeland MA, Hayden KM, Lockhart SN, et al. Sex-Related Differences in Brain Volumes and Cerebral Blood Flow Among Overweight and Obese Adults With Type 2 Diabetes: Exploratory Analyses From the Action for Health in Diabetes Brain Magnetic Resonance Imaging Study. Newman A, ed. J Gerontol Ser A. 2020;75(4):771-778. doi:10.1093/gerona/glz0904.
- Nagata K, Kondoh Y, Atchison R, et al. Vascular and metabolic reserve in Alzheimer’s disease. Neurobiol Aging. 2000;21(2):301-307. doi:10.1016/s0197-4580(00)00130-55.
- Nagata K, Maruya H, Yuya H, et al. Can PET Data Differentiate Alzheimer’s Disease from Vascular Dementia? Ann N Y Acad Sci. 2000;903(1 VASCULAR FACT):252-261. doi:10.1111/j.1749-6632.2000.tb06375.x6.
- Fan AP, Bilgic B, Gagnon L, et al. Quantitative oxygenation venography from MRI phase. Magn Reson Med. 2014;72(1):149-159. doi:10.1002/mrm.249187.
- Nan D, Cheng Y, Feng L, Zhao M, Ma D, Feng J. Potential Mechanism of Venous System for Leukoaraiosis: From post-mortem to in vivo Research. Neurodegener Dis. 2019;19(3-4):101-108. doi:10.1159/0005051578.
- Wallin A, Román GC, Esiri M, et al. Update on Vascular Cognitive Impairment Associated with Subcortical Small-Vessel Disease. J Alzheimers Dis JAD. 2018;62(3):1417-1441. doi:10.3233/JAD-1708039.
- Huck J, Wanner Y, Fan AP, et al. High resolution atlas of the venous brain vasculature from 7 T quantitative susceptibility maps. Brain Struct Funct. 2019;224(7):2467-2485. doi:10.1007/s00429-019-01919-410.
- Tremblay-Mercier J, Madjar C, Das S, et al. Open science datasets from PREVENT-AD, a longitudinal cohort of pre-symptomatic Alzheimer’s disease. NeuroImage Clin. 2021;31:102733. doi:10.1016/j.nicl.2021.10273311.
- Sun H, MacDonald, ME, Pike GB. Phase correction of a bipolar gradient-echo acquisition for quantitative susceptibility mapping. In: Proceedings of the 24th Annual Meeting of ISMRM. ; 2016.12.
- Langkammer C, Bredies K, Poser BA, et al. Fast quantitative susceptibility mapping using 3D EPI and total generalized variation. NeuroImage. 2015;111:622-630. doi:10.1016/j.neuroimage.2015.02.04113.
- Bazin PL, Plessis V, Fan AP, Villringer A, Gauthier CJ. Vessel segmentation from quantitative susceptibility maps for local oxygenation venography. In: 2016 IEEE 13th International Symposium on Biomedical Imaging (ISBI). IEEE; 2016:1135-1138. doi:10.1109/ISBI.2016.749346614.
- Keuken MC, Bazin PL, Crown L, et al. Quantifying inter-individual anatomical variability in the subcortex using 7 T structural MRI. NeuroImage. 2014;94:40-46. doi:10.1016/j.neuroimage.2014.03.03215.
- Collins DL, Holmes CJ, Peters TM, Evans AC. Automatic 3-D model-based neuroanatomical segmentation. Hum Brain Mapp. 1995;3(3):190-208. doi:10.1002/hbm.46003030416.
- Mazziotta J, Toga A, Evans A, et al. A probabilistic atlas and reference system for the human brain: International Consortium for Brain Mapping (ICBM). Philos Trans R Soc Lond Ser B. 2001;356(1412):1293-1322. doi:10.1098/rstb.2001.0915
Figures