2281
REPRODUCIBILITY OF 7T MEASUREMENTS OF THE SUSCEPTIBILITY AND VOLUME OF HIPPOCAMPAL SUBFIELDS1University of Nottingham, Nottingham, United Kingdom, 2University of Abuja, Abuja, Nigeria, 3Nottingham University Hospital, Nottingham, United Kingdom
Synopsis
This study provides an assessment of the level of reproducibility of measurements of the magnetic susceptibility of the hippocampal sub-fields that can achieved at 7T in a group of healthy volunteers using high-resolution QSM in conjunction with ASHS segmentation. The 2 to 4 ppb range of the values of the average standard deviation of repeated measurements characterises the minimum level of susceptibility change that could be reliably assessed in longitudinal studies, such as those evaluating changes in the iron content of the hippocampal sub-fields in Alzheimer’s disease.
INTRODUCTION
Quantitative susceptibility mapping (QSM) at 7T provides a powerful method for characterising brain iron concentration at the sub-millimetre level12. This is clinically relevant since changes in tissue iron have been linked to a range of neurological conditions. In preparation for assessing longitudinal changes in the hippocampal sub-fields in Alzheimer’s disease, we have characterised the reproducibility of high-resolution 7T susceptibility measurements in the hippocampus.METHODS
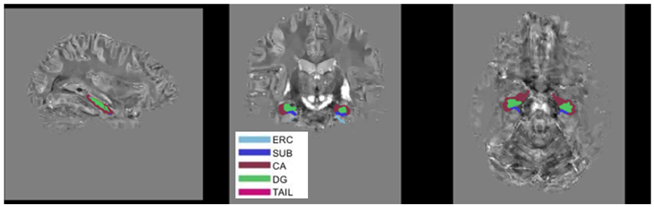
Ten healthy volunteers (age 32 ± 6 years) were each scanned five times at 7T using a single-echo gradient echo (GE) sequence (0.7x0.7x0.7 mm3 resolution TE/TR=20/31ms; FA=150), along with similar resolution T1- and T2-weighted sequences32. Five sites using three different scanner platforms (2 Siemens Terra, 2 Siemens Magnetom and 1 Philips Achieva) were involved, with two subjects scanned at each site and sequences were harmonised across scanner platforms. Susceptibility maps of the brain were created from the GE data using the multi-scale dipole inversion (MSDI) approach implemented in QSMbox4.Hippocampal segmentation involved applying the open-source, ASHS software5 to the T1- and T2-weighted images using a pipeline that combines multi-atlas6 label fusion and learning-based error correction. Regions of interest (ROIs) delineated using this approach were: Cornu ammonis (CA) areas: CA1, 2 and 3, hippocampal tail (TAIL), dentate gyrus (DG), subiculum (SUB) & entorhinal cortex (ERC). The average value of the susceptibility and volume of each of ROI was evaluated for each scan of each subject. The volumes of CA2 & CA3 were too low to produce reliable susceptibility values, so CA1-3 values were combined into a single CA measurement. Two approaches to referencing the susceptibility values were tried: (i) standard referencing where the average of the susceptibility over the brain is zero; (ii) referencing to small ROIs manually defined in CSF regions, whose susceptibility values defined the zero level. CSF-referencing was found to significantly increase the variance of the susceptibility values measured in the five repeats on each subject, so we report only results based on average-referencing here.
RESULTS
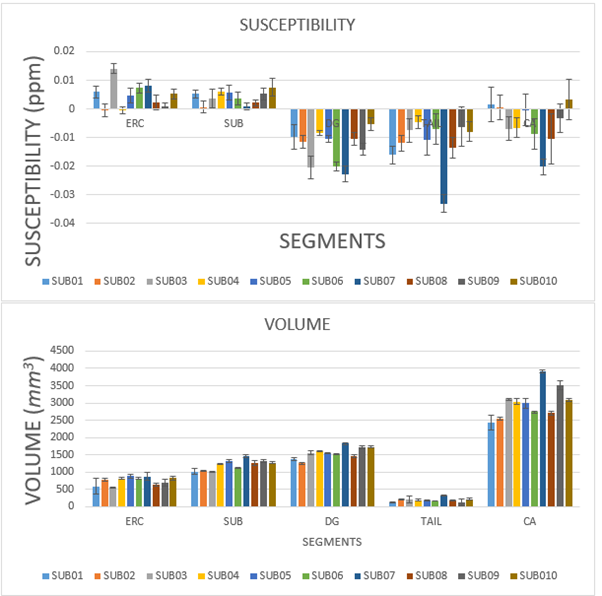
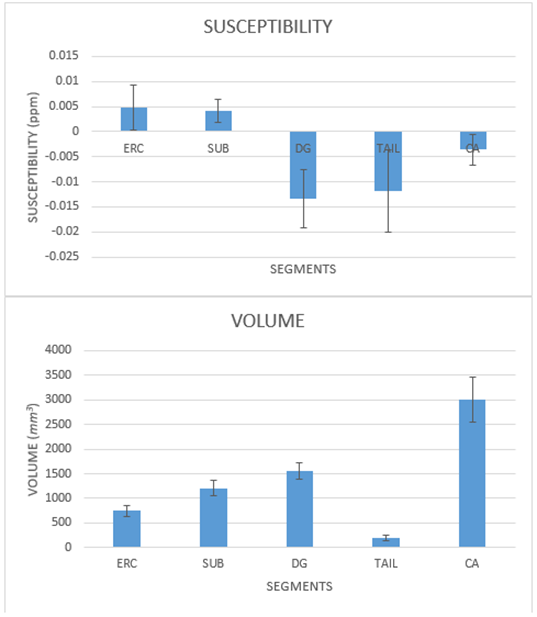
Figure 1 shows example QSM data for one subject, along with the overlaid ASHS segmentation of the hippocampal sub-fields. Good quality data was obtained in all 50 scanning sessions allowing evaluation of the average and standard deviation of the susceptibility values and volumes of the selected ROIs in the 10 subjects, as shown in Figure 2. The mean and standard deviation over participants of the measured volumes and susceptibility values for all ROIs are shown in Figure 3. These values are also reported in Table 1, along with the average over subjects of the standard deviations across the five repeated measurements.DISCUSSION
Individual and average hippocampal sub-field volumes (Figs. 2 and 3) are in good agreement with previously reported 7T measurements6. The susceptibility values show a consistent pattern of variation over ROIs across subjects. Measurements span the range of -33 to +14 ppb (parts per billion), with the ERC & SUB showing consistently positive values, DG & TAIL showing consistently negative values and the CA generally being slightly negative. Table 1 shows that the average over subjects of the standard deviation of the measured susceptibility across the five repeated scans varied from about 4 ppb (TAIL) to 2 ppb (ERC, SUB and CA), while the standard deviation of the average subject values was approximately twice as large in most sub-regions (except in SUB, where the two values were similar). The results show that the differences in susceptibility values between subjects are generally larger than the repeat measurement error in individual subjects, indicating that the small differences in regional susceptibility values between individuals can be characterised. The volume measurements show similar behaviour with the standard deviation of the average values over subjects being more than 1.6 times as large as the standard deviation over repeated measurements for all ROIs.CONCLUSION
This study provides an assessment of the level of reproducibility of measurements of the magnetic susceptibility of the hippocampal sub-fields that can achieved at 7T in a group of healthy volunteers using high-resolution QSM in conjunction with ASHS segmentation. The 2 to 4 ppb range of the values of the average standard deviation of repeated measurements characterises the minimum level of susceptibility change that could be reliably assessed in longitudinal studies, such as those evaluating changes in the iron content of the hippocampal sub-fields in Alzheimer’s disease.Acknowledgements
I want to appreciate the University of Abuja for giving me the opportunity for pursue this study and the UK7T network for the data use in this study.References
1. Betts MJ, Acosta-Cabronero J, Cardenas-Blanco A, Nestor PJ, Düzel E. High-resolution characterisation of the aging brain using simultaneous quantitative susceptibility mapping (QSM) and R2* measurements at 7 T. Neuroimage. 2016;138:43-63. doi:10.1016/j.neuroimage.2016.05.024
2. Rua C, Clarke WT, Driver ID, et al. Multi-centre, multi-vendor reproducibility of 7T QSM and R2* in the human brain: results from the UK7T study. bioRxiv. Published online April 24, 2020:2020.04.22.055624. doi:10.1101/2020.04.22.055624
3. Clarke WT, Mougin O, Driver ID, et al. Multi-site harmonization of 7 tesla MRI neuroimaging protocols. Neuroimage. 2020;206(October 2019):116335. doi:10.1016/j.neuroimage.2019.116335
4. Acosta-Cabronero J, Milovic C, Mattern H, Tejos C, Speck O, Callaghan MF. A robust multi-scale approach to quantitative susceptibility mapping. Neuroimage. 2018;183:7-24. doi:10.1016/j.neuroimage.2018.07.065
5. Yushkevich PA, Pluta JB, Wang H, et al. Automated volumetry and regional thickness analysis of hippocampal subfields and medial temporal cortical structures in mild cognitive impairment. Hum Brain Mapp. 2015;36(1):258-287. doi:10.1002/hbm.22627
6. Wisse LEM, Kuijf HJ, Honingh AM, et al. Automated hippocampal subfield segmentation at 7T MRI. Am J Neuroradiol. 2016;37(6):1050-1057. doi:10.3174/ajnr.A4659
Figures