2279
Longitudinal Assessment of Intravoxel Incoherent Motion Diffusion-Weighted MRI (IVIM-DWI) Metrics in Alzheimer’s Disease1Neuroimaging Division, Barrow Neurological Institute, Phoenix, AZ, United States, 21Neuroimaging Division, Barrow Neurological Institute, Phoenix, AZ, United States, 3Division of Neurology, Barrow Neurological Institute, Phoenix, AZ, United States, 4Department of Neurology, Mayo Clinic Arizona, Phoenix, AZ, United States, 5Alzheimer's and Memory Disorders Division, Barrow Neurological Institute, Phoenix, AZ, United States
Synopsis
The objective of this pilot study was to assess the complementary brain microstructural and perfusion changes using the apparent diffusion coefficient (ADC) and the intravoxel incoherent motion-diffusion weighted imaging (IVIM-DWI) parameters in a group of cognitively impaired people over a period of 12 months. Additionally, voxel-based correlations between cognitive assessment scores and DWI imaging parameters were evaluated.
Introduction
Alzheimer’s disease (AD) is the most common cause of dementia characterized neuropathologically by amyloid plaques and neurofibrillary tangles1. The intermediate stage between normal cognitive function and dementia is termed mild cognitive impairment (MCI), which is considered a prodrome of AD2.The microscopic neurodegenerative changes of AD can be assessed using diffusion weighted imaging (DWI) MRI. Increases in the apparent diffusion coefficient (ADC) have been observed in both MCI and AD3 and may reflect cellular damage, myelin changes, and/or axonal loss. Intravoxel incoherent motion DWI (IVIM-DWI) enables the simultaneous measurement of both diffusion- and perfusion-related parameters4. IVIM-DWI can quantify three parameters: D, D*, and f, which represent the pure diffusion coefficient, the pseudo-diffusion coefficient associated with perfusion, and the perfusion fraction, respectively5. In this study, we assessed microstructural and perfusion changes using ADC and IVIM-DWI parameters in cognitively impaired (CI, including both MCI and AD) and healthy control (HC) cohorts over a period of 12 months (baseline and M12). Additionally, voxel-based (VB) correlations between the Montreal Cognitive Assessment (MoCA) score and imaging parameters were evaluated.Methods
Twenty-five subjects were included in this study: 12 CI subjects (nine females; 73 ± 7 years)6 and 13 HC subjects (nine females; 76 ± 8 years). All participants completed the MoCA7 immediately prior to MRI. MRI data were acquired at 3T (Ingenia, Philips). IVIM-DWI was performed using seven b-values with the following acquisition parameters: TR/TE=6000/67.98 msec; acquisition matrix=96×96; voxel size =2.5×2.5 mm; slice thickness=2.5 mm. IVIM-D and IVIM-f maps were calculated by Dipy v.1.4.08 with the ‘Variable Projection’ (VarPro) fitting method9. The ADC maps were created from b = 0 and 1000 s/mm2 images using a monoexponential model fit. All voxel-based analyses were performed using a group-wise template (antsMultivariateTemplateConstruction.sh, (ANTs) (http:// stnava.github.io/ANTs/)). The Student’s t-test was used to evaluate differences in age; the Mann-Whitney U-test was used to evaluate differences in MoCA scores. The repeated measures ANCOVA, with sex and age as covariates, was used to obtain the F statistics for the main effects of group and time (with FDR-correction). Post-hoc comparisons were performed by an unpaired Student’s t-test with age and sex as covariates (for group main effect) and a paired Student’s t-test (for time main effect) (with Bonferroni-correction). The Spearman’s correlations, with age and gender as covariates, between ADC/IVIM maps and MoCA scores were assessed.Results
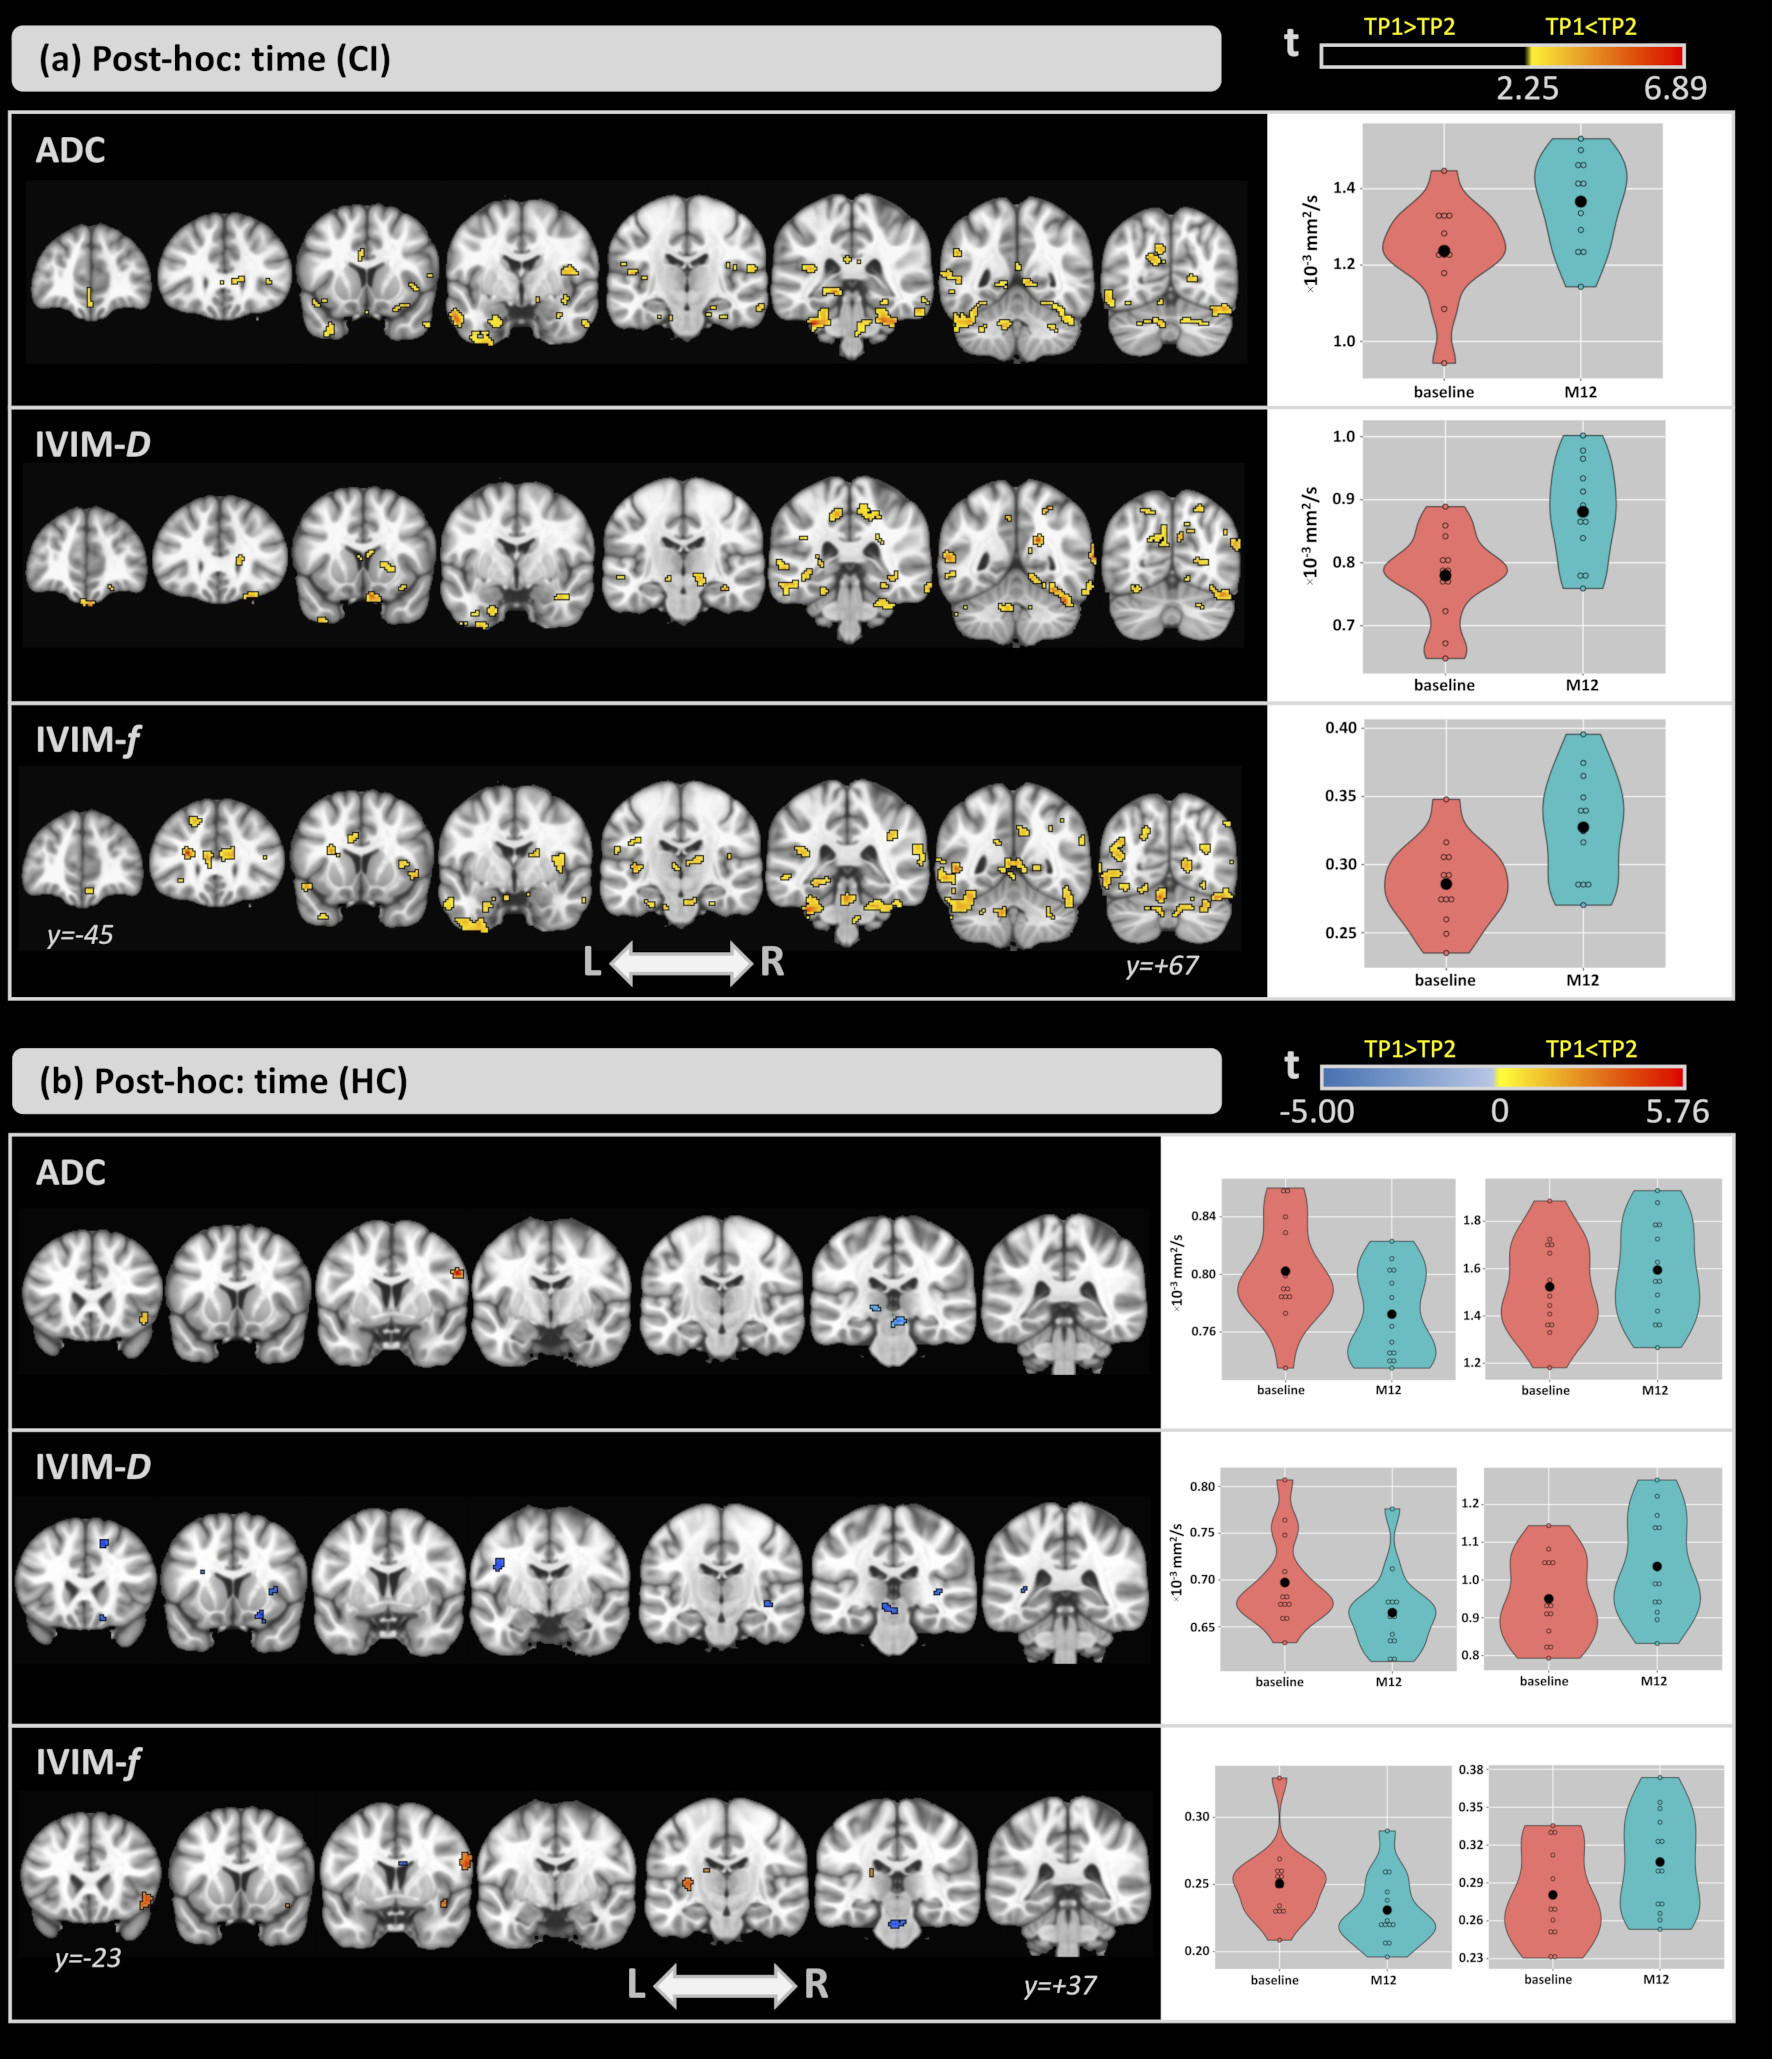
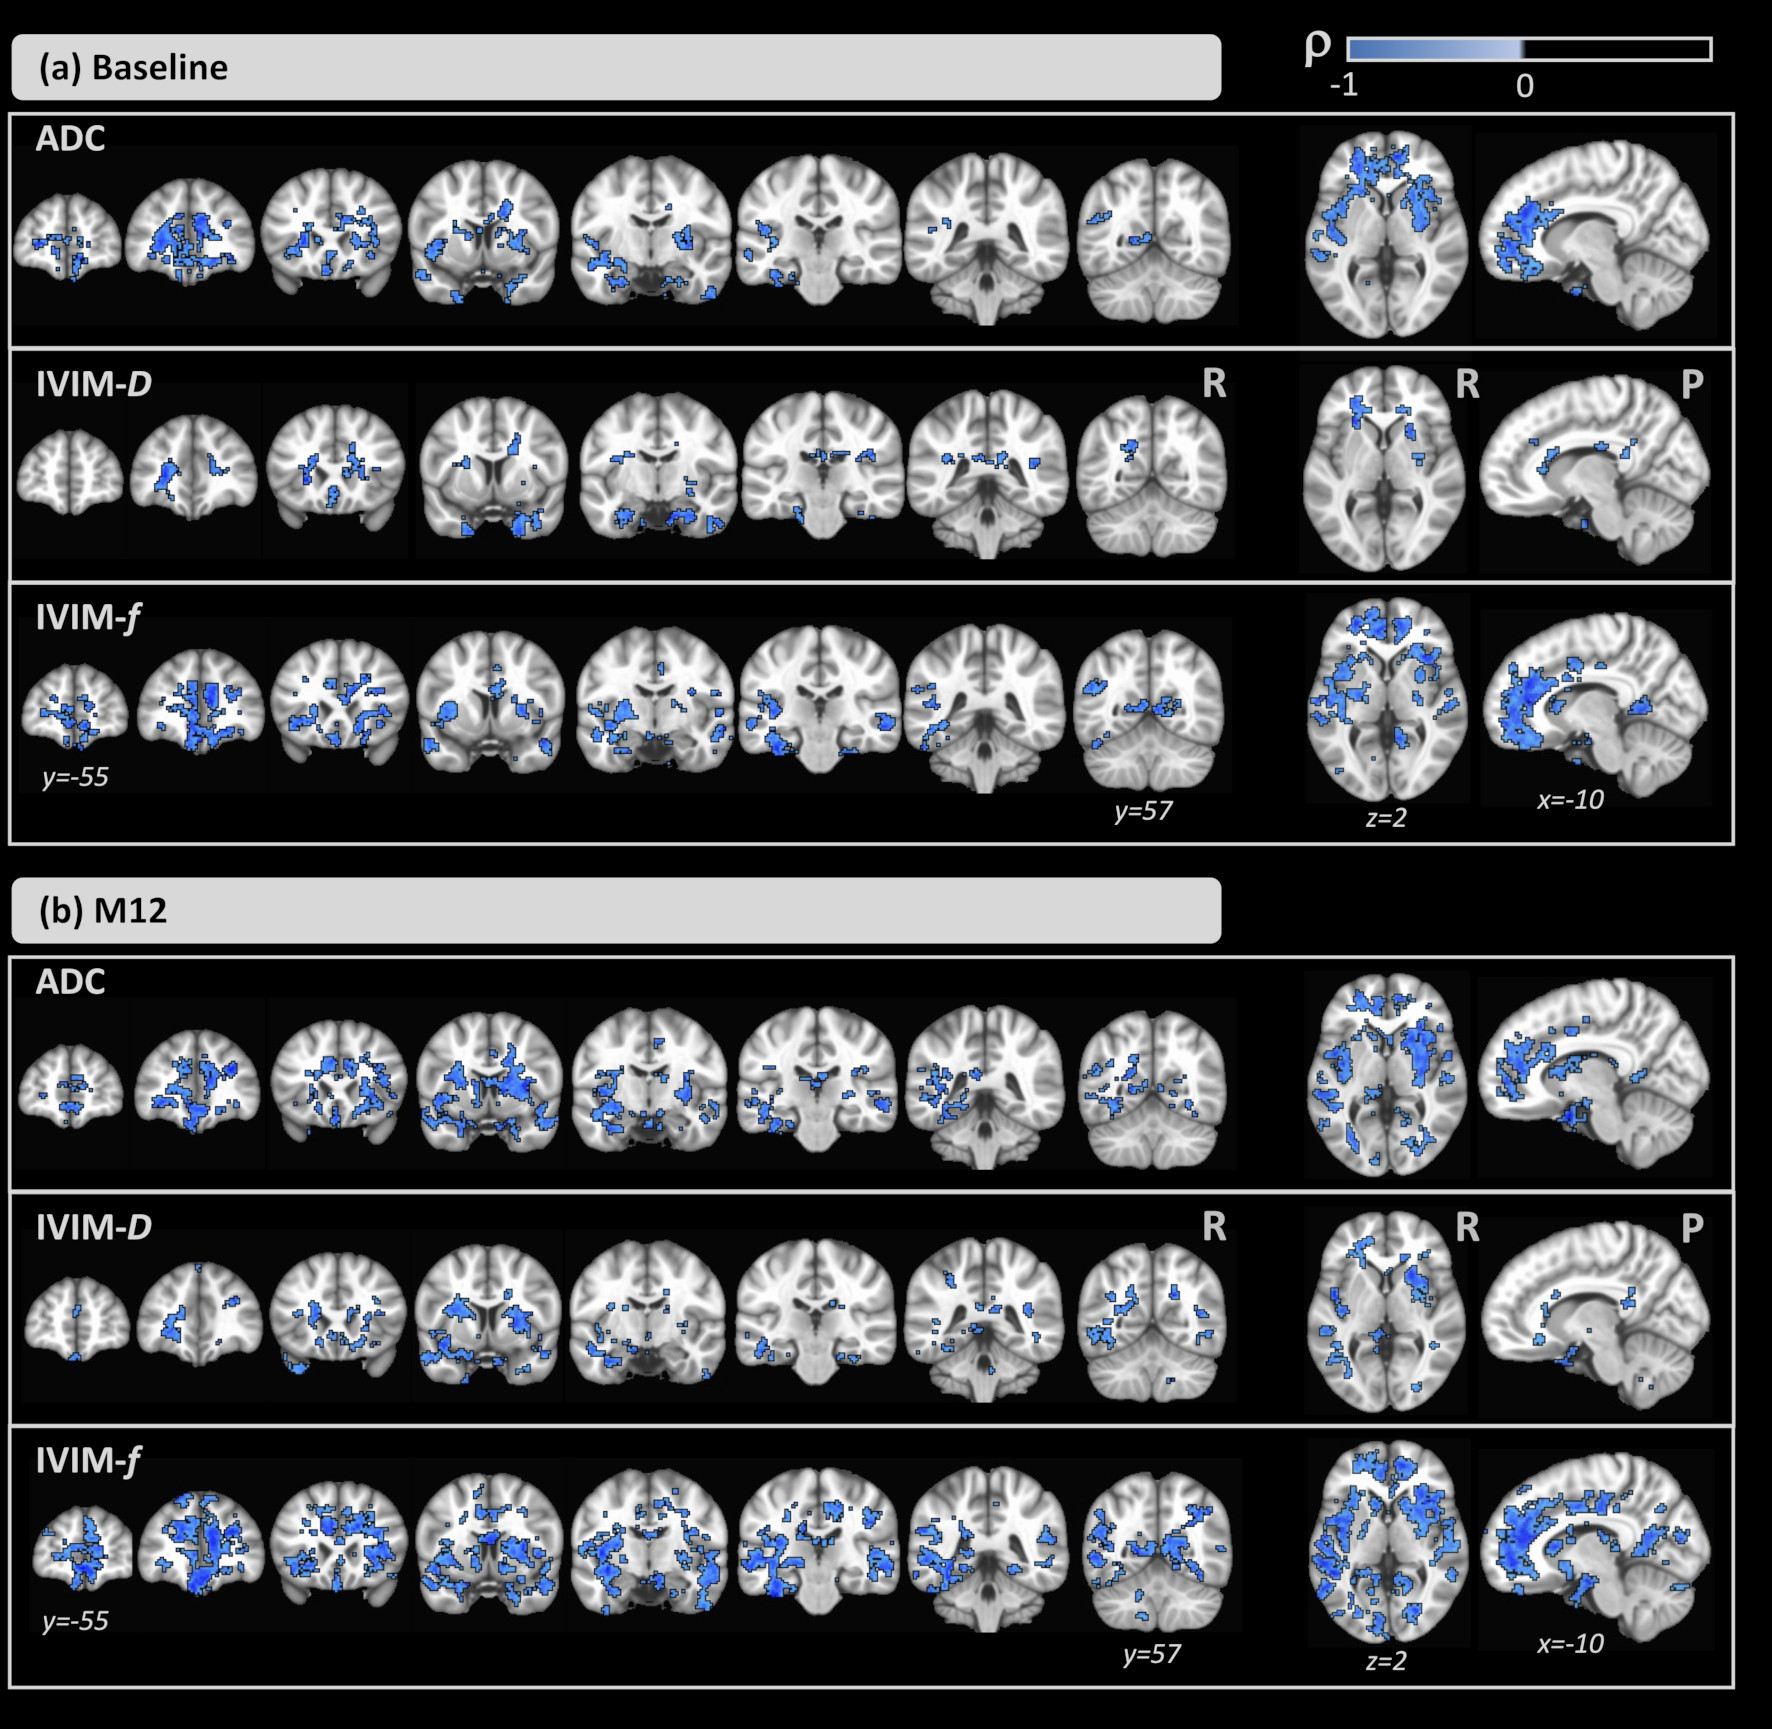
The groups did not differ significantly in age (t=0.96; p=0.35); however, significant differences were detected for the MoCA score (Z=-3.76; p<0.001).Figure 1-a shows the ANCOVA results for the main effect of group. Differences were found in both time-points. Compared with the HCs, CI subjects showed higher ADC and IVIM-metrics in several brain areas. Figure 1-b shows the results for the main effect of time. Here, ADC and IVIM-metrics were higher at M12 than at baseline for both groups. For all metrics, significant differences were found in the left hippocampus, thalamus, and amygdala and, only for ADC and IVIM-f, in the right thalamus and bilateral hippocampus. Figure 2 shows the post-hoc comparisons for the main effect of time for the (a) CI and (b) HC groups. For CI group, higher values were observed at M12 compared to baseline for all metrics. In the HC group, small clusters with both increases and decreases in ADC and IVIM-metrics were observed. The post-hoc comparisons for the main effect of group, are shown in Figure 3 for (a) baseline and (b) M12. Compared with HCs, higher values for all metrics were observed in the CI group at both time-points. Differences between groups were found in the thalamus, caudate, hippocampus, and amygdala. Figure 4 shows the voxel-based correlation coefficients between ADC/IVIM metrics and MoCA score for (a) baseline and (b) M12 in CI group.Discussion
Differences in both brain perfusion and diffusion between HC and CI groups were found. The main effect of group showed large differences between the two groups, and post-hoc group analysis revealed higher ADC/IVIM values in the CI group than HC group at both time-points. These group differences were exacerbated at the later time point with larger clusters of group differences at M12. The main effect of time showed smaller differences primarily observed in IVIM-f and ADC. The post-hoc comparisons for time revealed higher ADC/IVIM values for the CI group in M12 compared to baseline, while both higher and lower values across smaller clusters were found in the HC group. For all metrics, cluster locations were consistent with known AD pathology, including the hippocampus. We also identified significant correlations between MoCA and ADC/IVIM metrics, mainly located in the hippocampus, the left amygdala, and the right caudate and putamen. These findings suggest a close relationship between cognitive changes and brain diffusion and perfusion.Conclusions
Using a longitudinal study, we demonstrated that ADC and IVIM-metrics can distinguish between CI and HC cohorts; additionally, changes over time were primarily driven by the CI cohort. The IVIM technique can be used to evaluate brain changes with neurodegenerative diseases over time, and the use of this MRI method in the future may provide insight into complementary diffusion and perfusion changes in CI patients.Acknowledgements
This work was supported by the Arizona Alzheimer’s Consortium and the Barrow Neurological FoundationReferences
1. Kukull WA, Bowen JD. Dementia epidemiology. Med Clin North Am. May 2002;86(3):573-90. doi:10.1016/s0025-7125(02)00010-x
2. DeCarli C. Mild cognitive impairment: prevalence, prognosis, aetiology, and treatment. Lancet Neurol. Jan 2003;2(1):15-21. doi:10.1016/s1474-4422(03)00262-x
3. Kantarci K, Jack CR, Xu YC, et al. Mild cognitive impairment and Alzheimer disease: regional diffusivity of water. Radiology. Apr 2001;219(1):101-7. doi:10.1148/radiology.219.1.r01ap14101
4. Le Bihan D, Breton E, Lallemand D, Aubin ML, Vignaud J, Laval-Jeantet M. Separation of diffusion and perfusion in intravoxel incoherent motion MR imaging. Radiology. Aug 1988;168(2):497-505. doi:10.1148/radiology.168.2.3393671
5. Bergamino M, Nespodzany A, Baxter LC, et al. Preliminary Assessment of Intravoxel Incoherent Motion Diffusion-Weighted MRI (IVIM-DWI) Metrics in Alzheimer's Disease. J Magn Reson Imaging. 12 2020;52(6):1811-1826. doi:10.1002/jmri.27272
6. Albert MS, DeKosky ST, Dickson D, et al. The diagnosis of mild cognitive impairment due to Alzheimer's disease: recommendations from the National Institute on Aging-Alzheimer's Association workgroups on diagnostic guidelines for Alzheimer's disease. Alzheimers Dement. May 2011;7(3):270-9. doi:10.1016/j.jalz.2011.03.008
7. Nasreddine ZS, Phillips NA, Bédirian V, et al. The Montreal Cognitive Assessment, MoCA: a brief screening tool for mild cognitive impairment. J Am Geriatr Soc. Apr 2005;53(4):695-9. doi:10.1111/j.1532-5415.2005.53221.x
8. Garyfallidis E, Brett M, Amirbekian B, et al. Dipy, a library for the analysis of diffusion MRI data. Front Neuroinform. 2014;8:8. doi:10.3389/fninf.2014.00008
9. Farooq H, Xu J, Nam JW, et al. Microstructure Imaging of Crossing (MIX) White Matter Fibers from diffusion MRI. Sci Rep. 12 16 2016;6:38927. doi:10.1038/srep38927
Figures