2277
Fine-grained characterisation of white matter microstructural abnormality in the pathophysiological cascade of Alzheimer’s disease1Centre for Medical Image Computing, Department of Computer Science, UCL, London, United Kingdom
Synopsis
White matter (WM) microstructure abnormalities have been observed in prodromal and manifest Alzheimer’s disease (AD). However, the precise nature and sequence of WM neurodegeneration across the disease course is unclear. Here, we leverage state-of-the-art disease progression modelling to sequence WM microstructure abnormalities in AD, as quantified by diffusion MRI in the ADNI study. We observe WM abnormalities among the earliest AD structural abnormalities and characterise the precise sequence of WM neurodegeneration. This fine-grained approach may be used to identify subjects at early disease stages for participation in therapeutic clinical trials.
Introduction
Computational disease progression modelling (DPM) has provided data-driven quantification and fine-grained characterisation of the Alzheimer’s disease (AD) pathophysiological cascade, which holds promise for supporting precision patient selection in clinical trials. However, despite demonstration of WM microstructure abnormality using diffusion MRI in both manifest AD1 and prior to disease onset1,2,3, the position of WM microstructure neurodegeneration in the cascade remains unclear. This is due to the absence of commonly defined in vivo AD stages and subjectivity required to estimate the sequence across different studies4. Here, we leverage DPM to provide the first description of the precise ordering of WM neurodegeneration in a cohort of individuals across the AD spectrum. WM abnormalities are placed in the context of known macroscopic structural degeneration in AD5 by using grey matter (GM) volumetric measures as reference.Methods
Disease progression modellingComputational DPM estimates a sequence of WM abnormalities and its uncertainty from a set of subjects’ biomarker data using event-based modelling (EBM)6. This data-driven approach estimates the evolution of biomarker abnormalities as a series of events, whereby biomarkers transition from normal to abnormal states. EBM also enables patient staging7, where participants are assigned a model stage based on their cumulative abnormality, as estimated from the data. Here, the latest version of EBM was used: kernel density estimation (KDE)-EBM8.
Subjects and pre-processing
WM and GM biomarkers were obtained from the ADNI database9, which was chosen as it comprises a large cohort of individuals across the AD spectrum with WM biomarkers covering many regions. We analysed data from ADNI participants with a complete biomarker set, yielding 51 healthy controls, 36 AD cases and 138 individuals with mild cognitive impairment (MCI) or significant memory concerns. Each metric was averaged over left and right hemispheres, as we expected no hemisphere-specific disease effects. GM volumes were normalised by intra-cranial volume (head size). All metrics were adjusted for potential confounders of age, sex and APOE4 status.
Biomarkers
We selected WM regions of interest (ROIs) with known abnormality in AD, according to the literature. To provide sensitivity to the initial degenerative processes, the diffusion tensor imaging (DTI) metric with earliest abnormality, as determined by EBM of DTI biomarkers, was chosen for each ROI. DTI biomarkers were selected from mean diffusivity (MD), axial diffusivity (AxD), radial diffusivity (RD), and fractional anisotropy (FA). To provide reference to known structural degeneration in AD, volume measures of four GM ROIs were also selected. Biomarkers used for EBM are shown in Fig. 1 and ROI abbreviations listed in Table 1.
Resampling analysis
To stress-test the dependence of the sequence on the particular set of subjects included in EBM, variability in the sequence was estimated from 90 re-samples of subjects’ data (as in [7]). Each resample estimated the sequence from 8/9ths of the data after splitting it into 9 disjoint sets. Each possible combination of 8 sets was sampled, and the process repeated 10 times with a different reshuffling of the original data.
Results & Discussion
Figure 1 shows that the estimated sequence of MRI biomarker abnormalities in AD starts with decreased volume of the hippocampus and increased MD in the hippocampal cingulum WM ROI. This is followed by abnormalities in both WM and GM biomarkers that resampling analysis suggests have a less certain ordering (Fig. 2). The relatively early appearance of WM abnormality and its position alongside landmarks of known GM structural degeneration suggests that WM markers are among the earliest detectable neurodegeneration events in the AD pathophysiological cascade5.The ordering of WM abnormalities is consistent with findings based on more crude comparisons between clinical groups. In particular, increased hippocampal cingulum MD, the earliest WM biomarker in the sequence, has been observed in amnestic MCI and AD4,10. Abnormal DTI metrics in the uncinate fasciculus4 and superior longitudinal fasciculus1 have been reported in AD but not MCI, consistent with their later sequence position.
Subject staging showed high prevalence of MCI subjects up to stage two (increased hippocampal cingulum MD) (Fig. 3), whereas AD subject stages were more evenly distributed and were the only group with subjects at late stages. The high prevalence of MCI individuals at early stages suggests a potential application of DPM of WM biomarkers for selecting individuals for clinical trials who are most likely to benefit from therapy that prevents disease progression.
Conclusion & Future work
This study provides the first fine-grained and data-driven characterisation of the progression of WM microstructural abnormality in the AD pathophysiological cascade. Ordering of WM abnormality is consistent with previous studies and supports use of several WM biomarkers, in particular MD of the hippocampal cingulum, as early indicators of structural degeneration. The fine-grained sequencing permitted a refined staging that placed MCI subjects at multiple early stages, suggesting an added benefit to including WM in disease progression modelling of AD for selecting candidates for preventative clinical trials.In future, improved specificity to neurodegenerative processes and even finer staging of AD individuals may be achieved by using an alternative dataset that employs advanced diffusion MRI models and covers additional ROIs.
Acknowledgements
CP, GZ and NPO were funded by the EPSRC (Platform Grant: EP/M020533/1). CP and GZ were also funded by the Wellcome Trust (Collaborative Award 200181/Z/15/Z). NPO is a UKRI Future Leaders Fellow (MR/S03546X/1) and acknowledges funding from the National Institute for Health Research University College London Hospitals Biomedical Research Centre.
References
[1] Agosta, F., Pievani, M., Sala, S., Geroldi, C., Galluzzi, S., Frisoni, G.B. and Filippi, M., 2011. White matter damage in Alzheimer disease and its relationship to gray matter atrophy. Radiology, 258(3), 853-863.
[2] Araque Caballero, M.Á., Suárez-Calvet, M., Duering, M., Franzmeier, N., Benzinger, T., Fagan, A.M., Bateman, R.J., Jack, C.R., Levin, J., Dichgans, M. and Jucker, M., 2018. White matter diffusion alterations precede symptom onset in autosomal dominant Alzheimer’s disease. Brain, 141(10), 3065-3080.
[3] Zhuang, L., Sachdev, P.S., Trollor, J.N., Reppermund, S., Kochan, N.A., Brodaty, H. and Wen, W., 2013. Microstructural white matter changes, not hippocampal atrophy, detect early amnestic mild cognitive impairment. PloS one, 8(3), e58887.
[4] Sexton CE, Kalu UG, Filippini N, Mackay CE, Ebmeier KP., 2011. A meta-analysis of diffusion tensor imaging in mild cognitive impairment and Alzheimer's disease. Neurobiology of aging. 32(12): 2322-e5.
[5] Jack Jr, C.R., Knopman, D.S., Jagust, W.J., Shaw, L.M., Aisen, P.S., Weiner, M.W., Petersen, R.C. and Trojanowski, J.Q., 2010. Hypothetical model of dynamic biomarkers of the Alzheimer's pathological cascade. The Lancet Neurology, 9(1), 119-128.
[6] Fonteijn, H.M., Modat, M., Clarkson, M.J., Barnes, J., Lehmann, M., Hobbs, N.Z., Scahill, R.I., Tabrizi, S.J., Ourselin, S., Fox, N.C. and Alexander, D.C., 2012. An event-based model for disease progression and its application in familial Alzheimer's disease and Huntington's disease. NeuroImage, 60(3), 1880-1889.
[7] Young, A.L., Oxtoby, N.P., Daga, P., Cash, D.M., Fox, N.C., Ourselin, S., Schott, J.M. and Alexander, D.C., 2014. A data-driven model of biomarker changes in sporadic Alzheimer's disease. Brain, 137(9), 2564-2577.
[8] Firth, N.C., Primativo, S., Brotherhood, E., Young, A.L., Yong, K.X., Crutch, S.J., Alexander, D.C. and Oxtoby, N.P., 2020. Sequences of cognitive decline in typical Alzheimer's disease and posterior cortical atrophy estimated using a novel event‐based model of disease progression. Alzheimer's & Dementia, 16(7), 965-973.
[9] Mueller, S.G., Weiner, M.W., Thal, L.J., Petersen, R.C., Jack, C.R., Jagust, W., Trojanowski, J.Q., Toga, A.W. and Beckett, L., 2005. Ways toward an early diagnosis in Alzheimer’s disease: the Alzheimer’s Disease Neuroimaging Initiative (ADNI). Alzheimer's & Dementia, 1(1), 55-66.
[10] Rogalski, E.J., Murphy, C.M., deToledo-Morrell, L., Shah, R.C., Moseley, M.E., Bammer, R. and Stebbins, G.T., 2009. Changes in parahippocampal white matter integrity in amnestic mild cognitive impairment: a diffusion tensor imaging study. Behavioural neurology, 21(1, 2), 51-61.
Figures
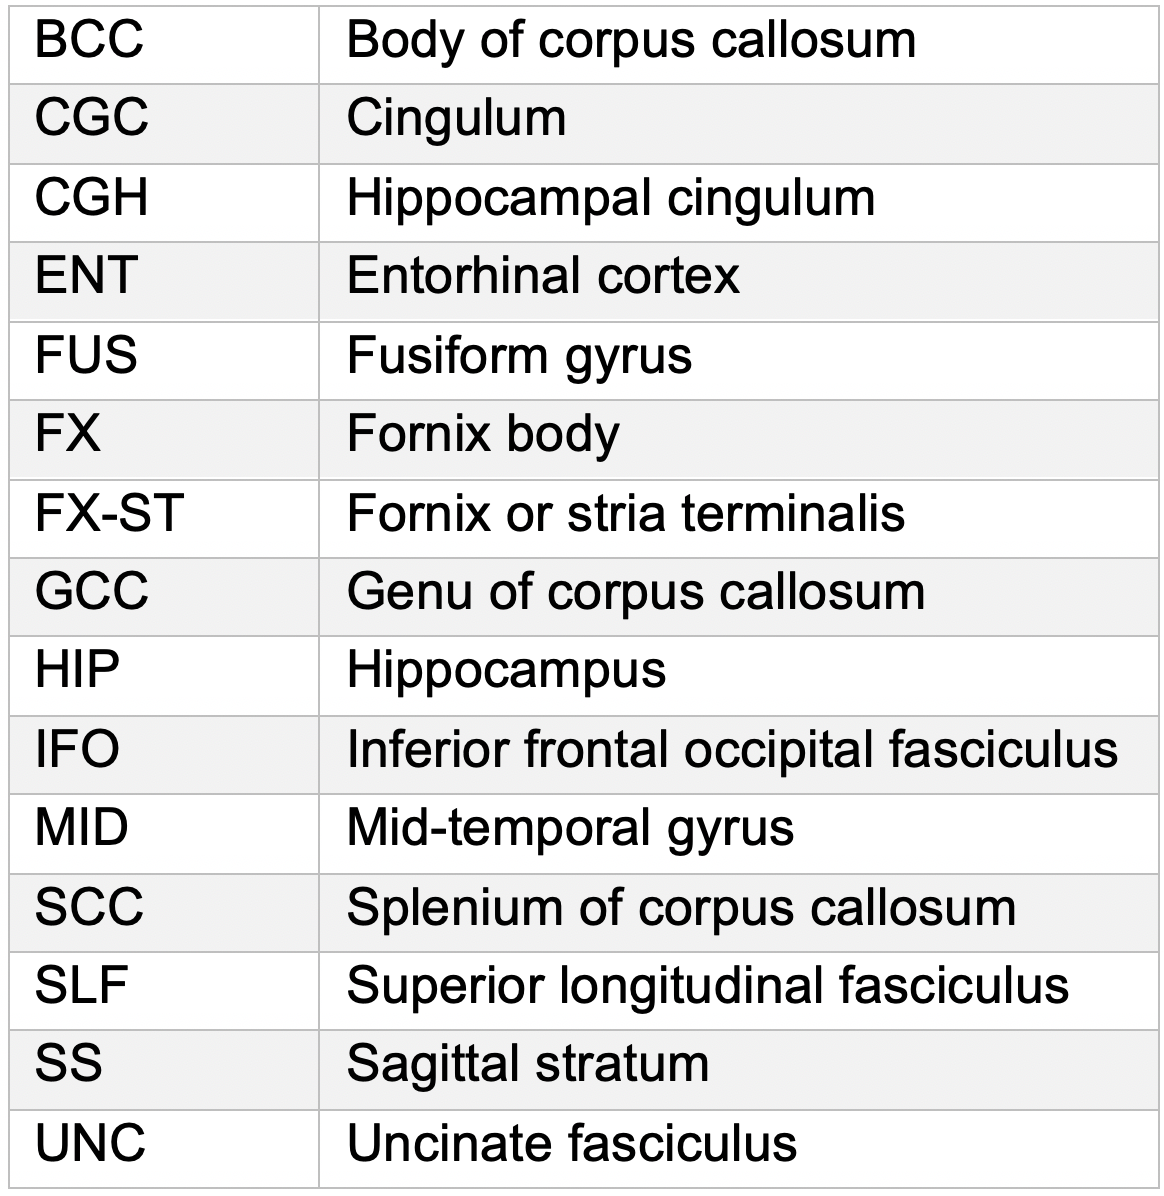
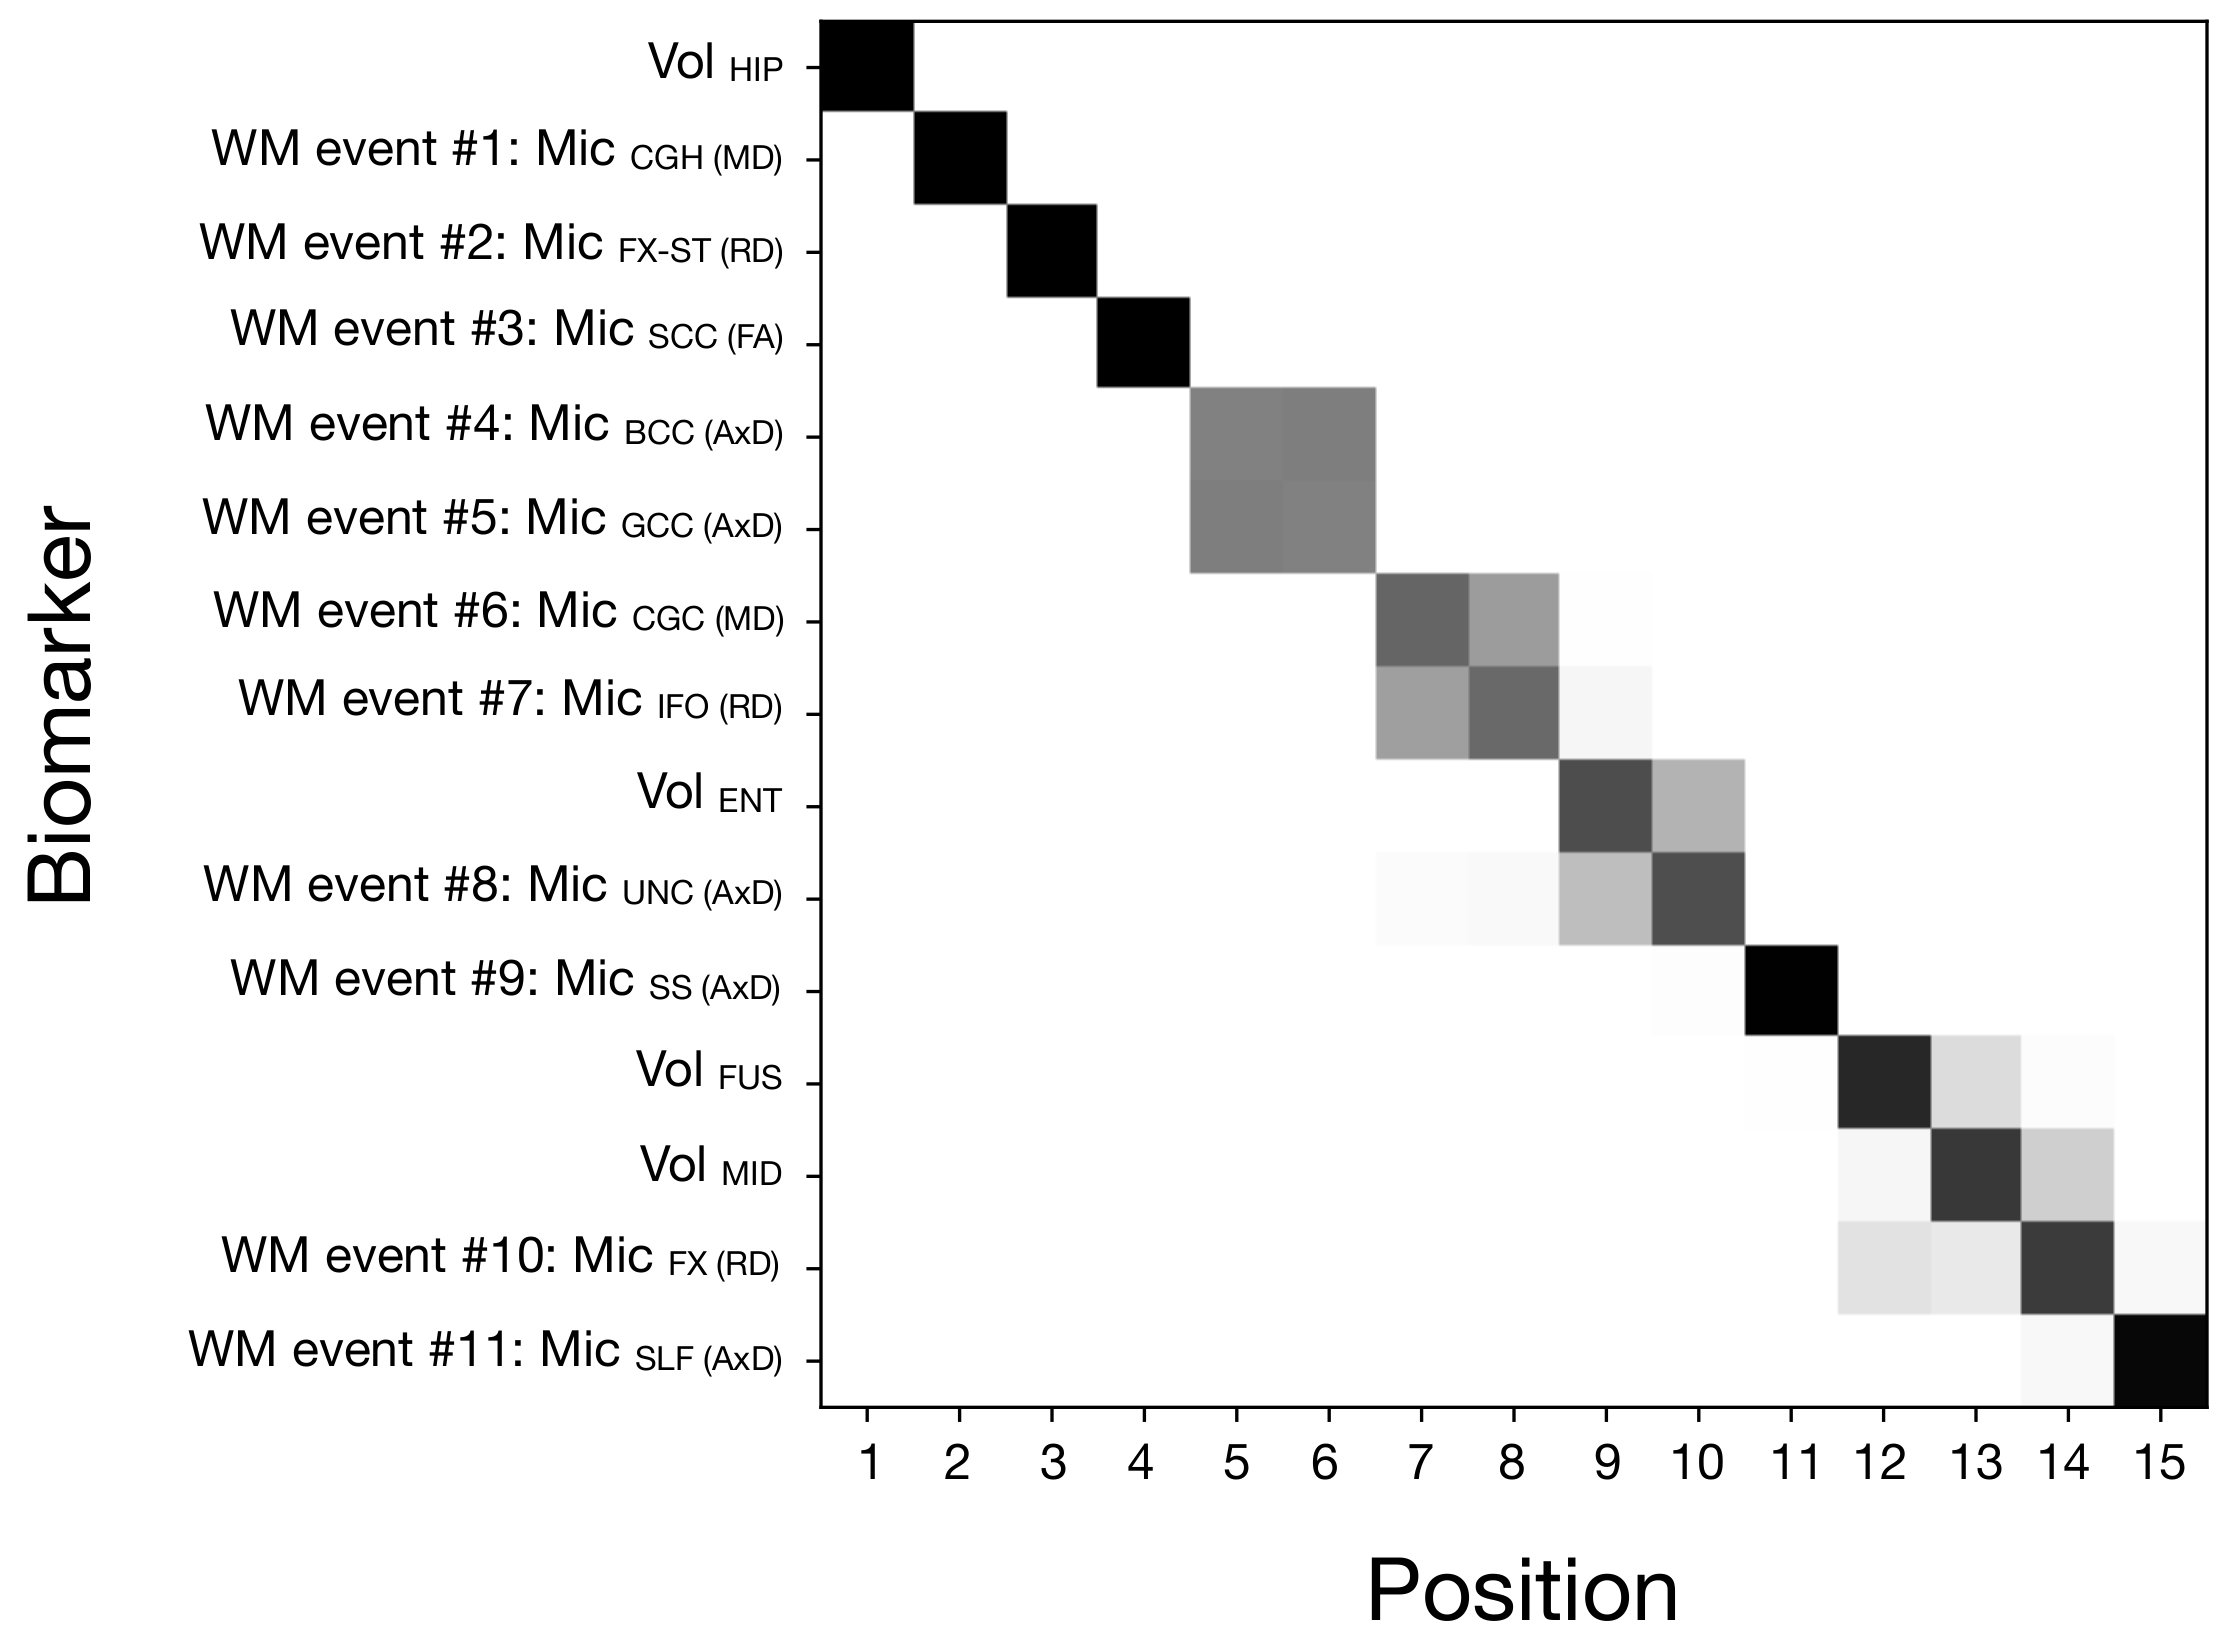
Figure 1. Positional variance diagram showing the maximum likelihood model with positional variance shown in grayscale. The maximum likelihood sequence was estimated from ten greedy ascents, each with different initialisations. The posterior uncertainty of the model was obtained using Markov chain Monte Carlo. ROI abbreviations are listed in Table 1.
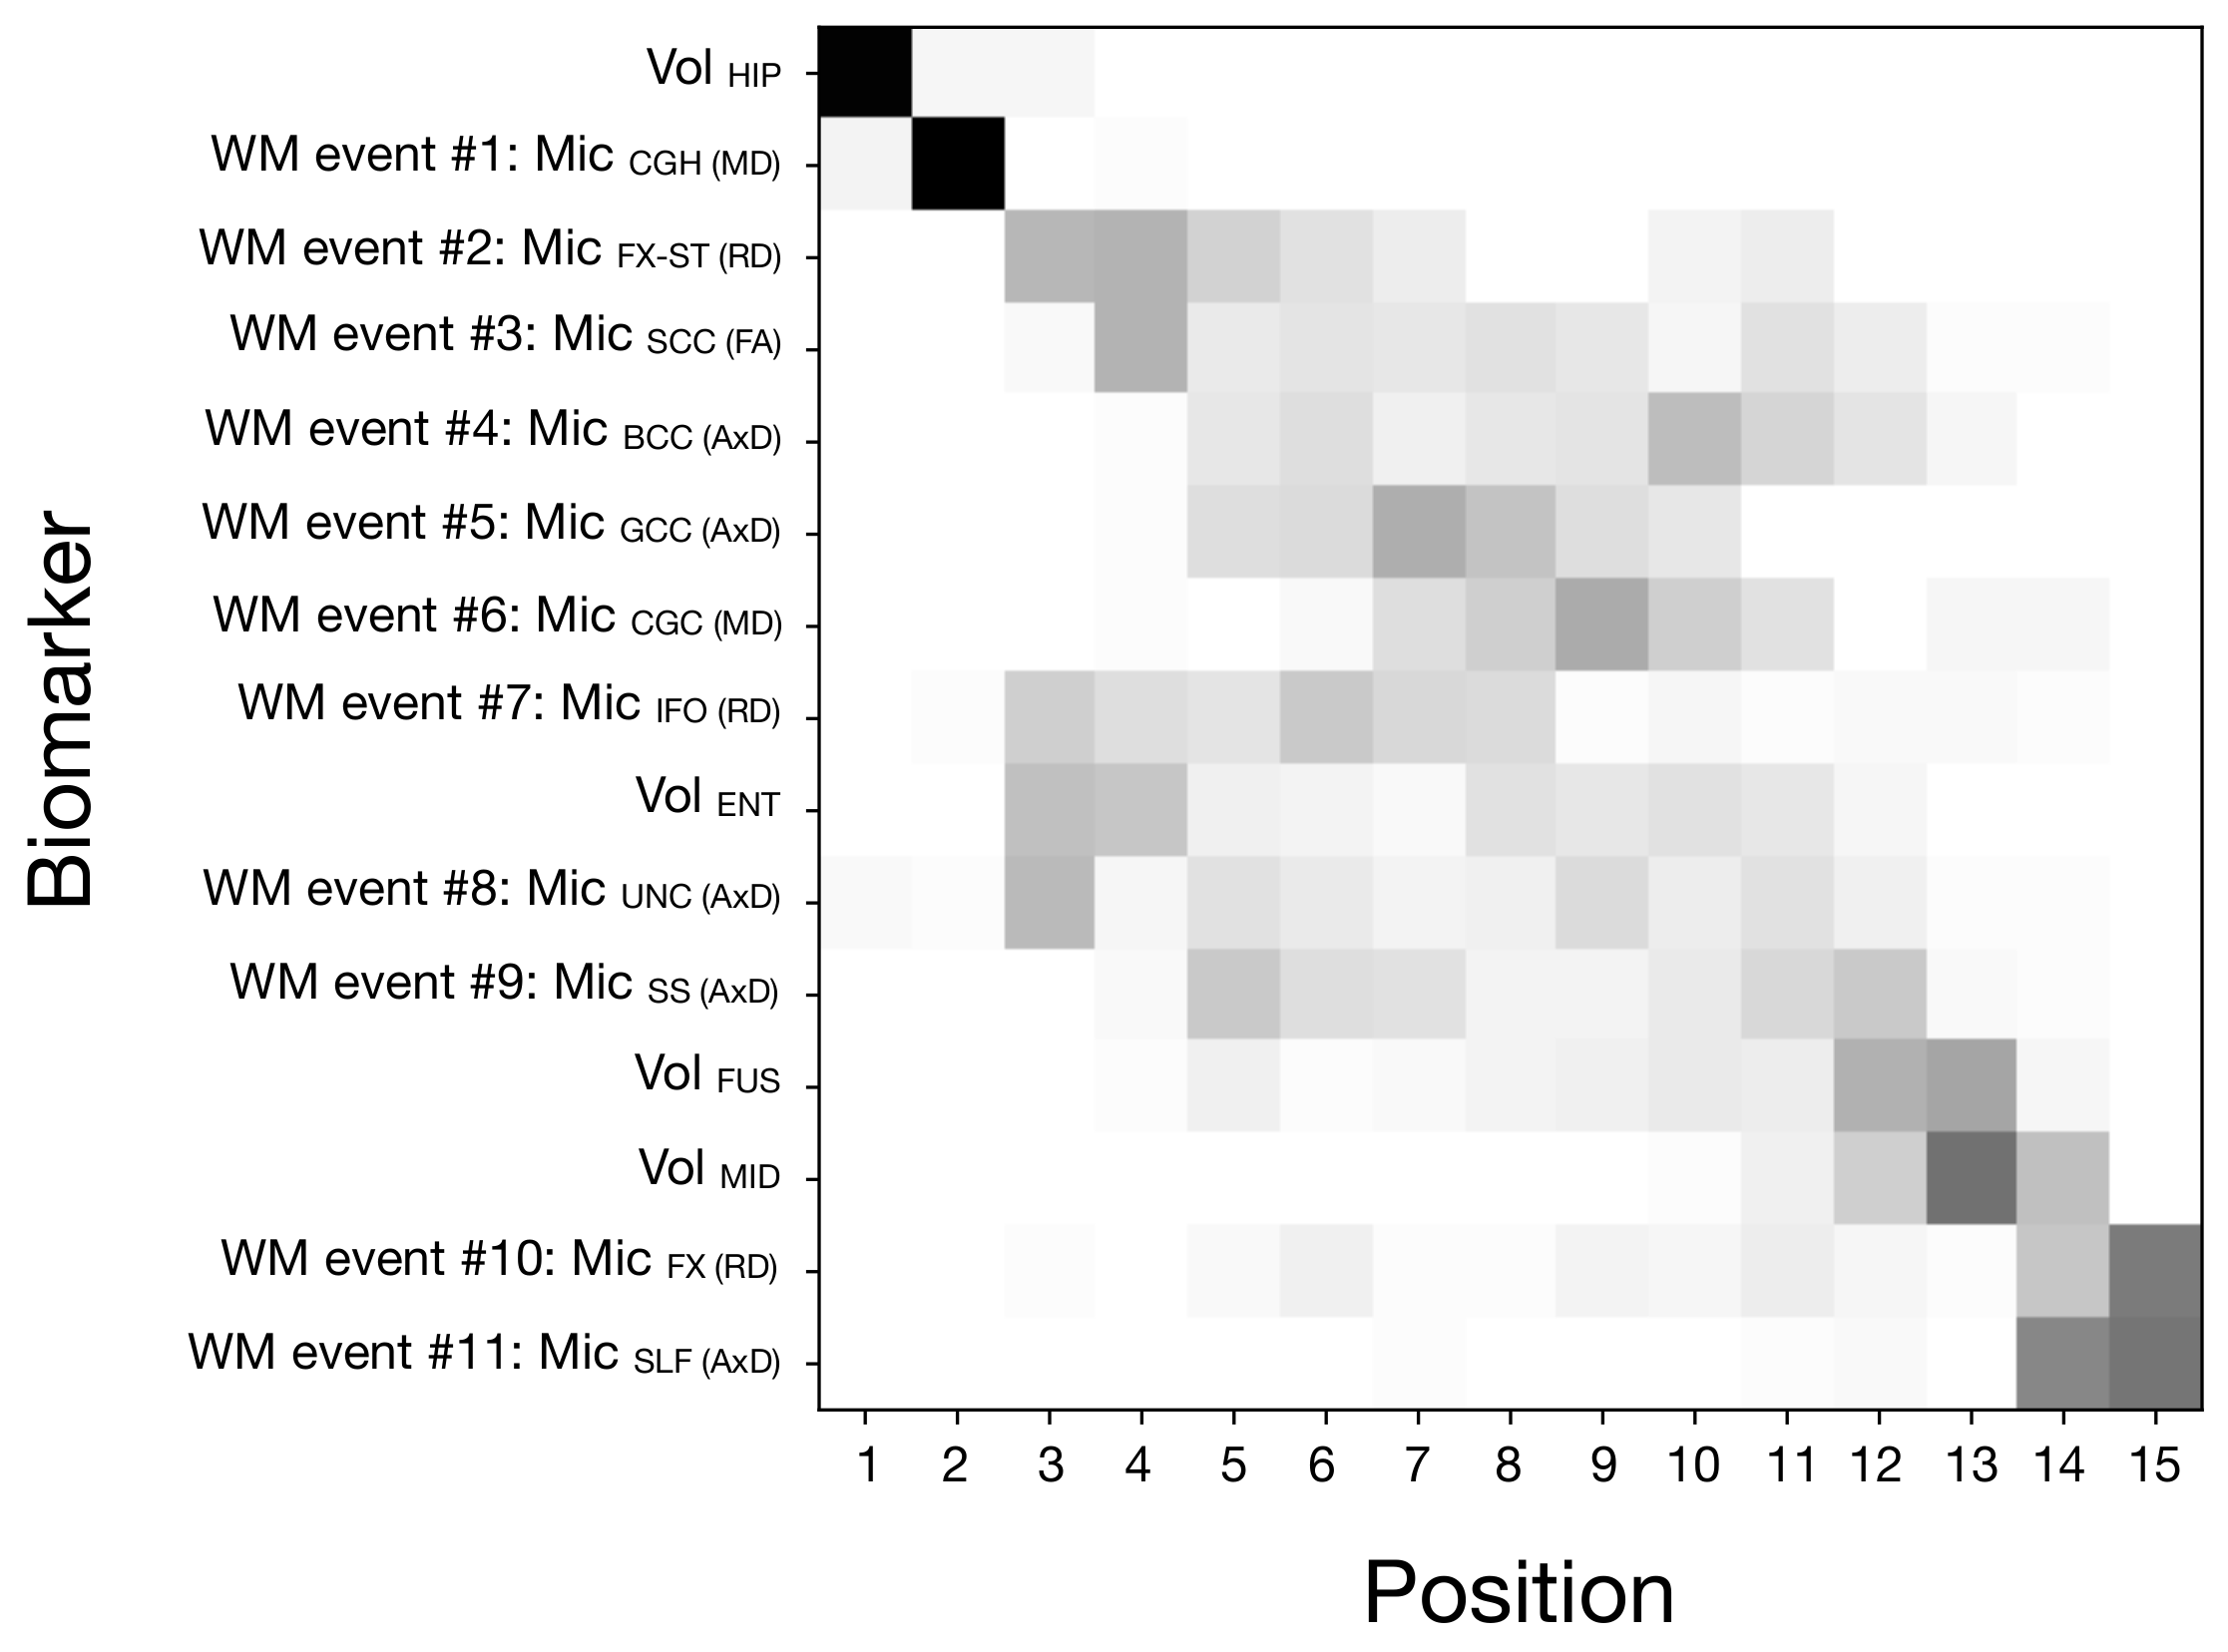
Figure 2. Positional variance diagrams of resampled subjects’ data. Each square indicates the proportion of times the event occurred at each sequence position from 90 resamples. Each resample re-estimated the sequence from 8/9ths of the data after splitting it into 9 disjoint sets. Each possible combination 8 folds was sampled, and the process repeated 10 times with a different reshuffling of the original data. ROI abbreviations are listed in Table 1.
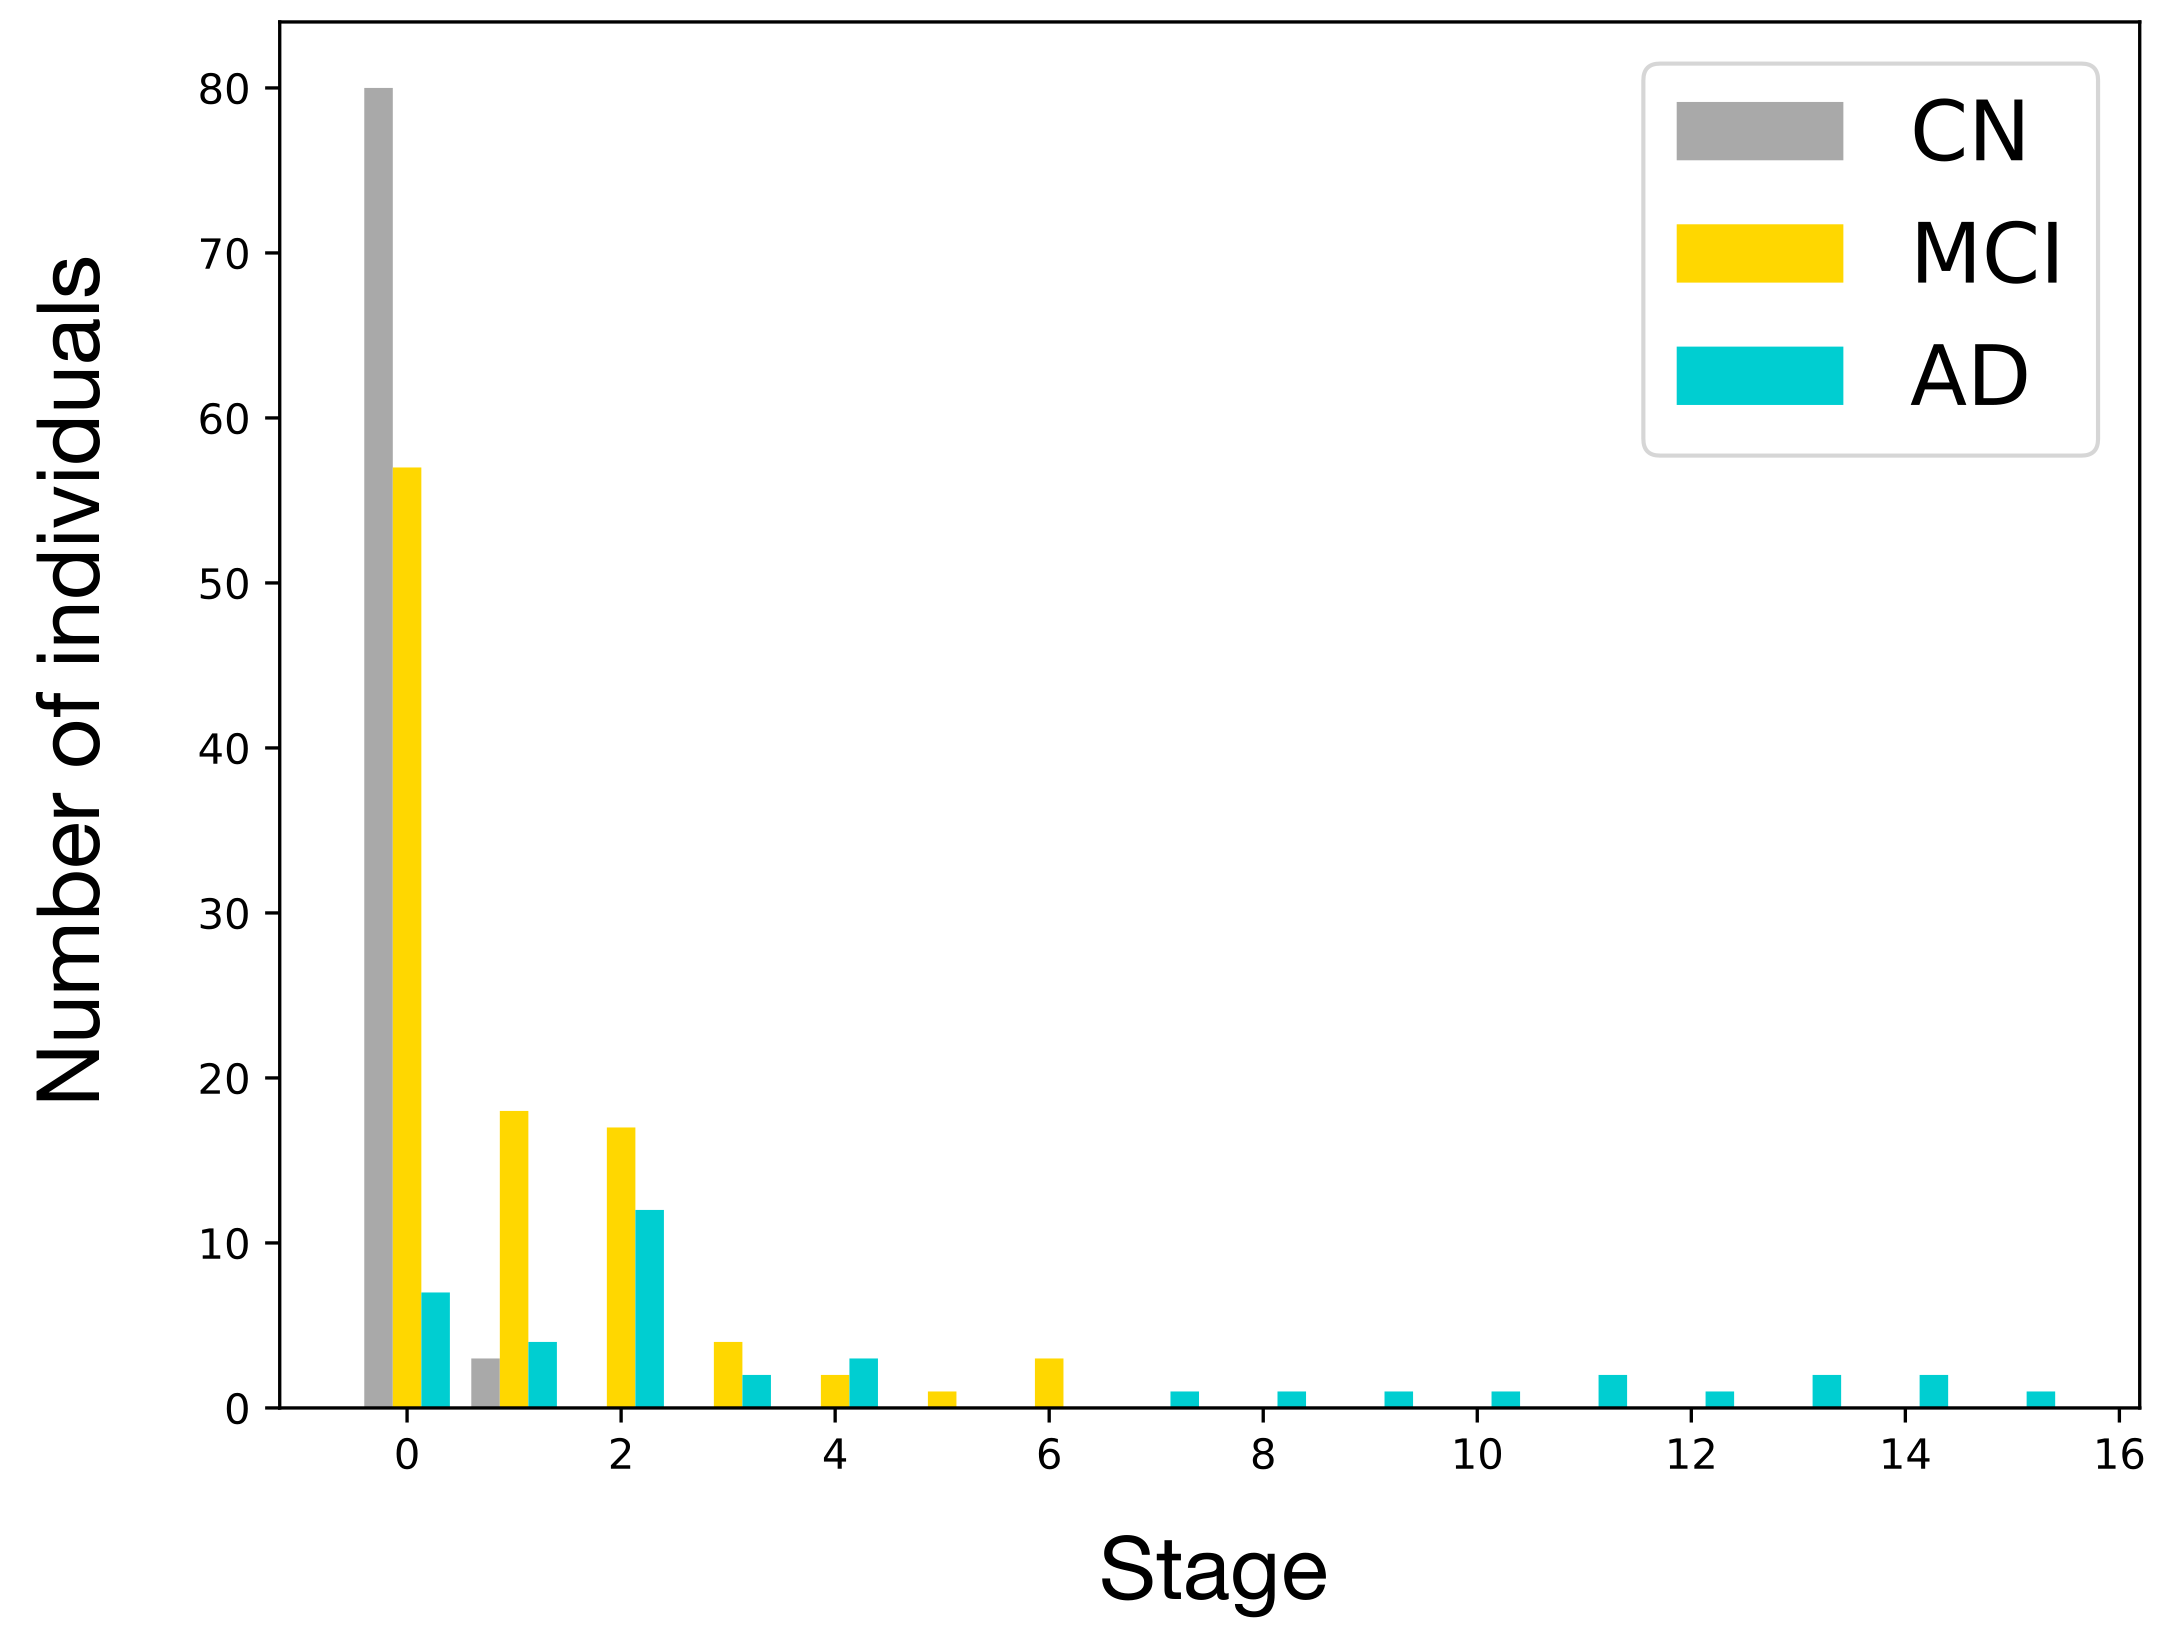
Figure 3. Histogram of disease stages in control (CN), mild cognitive impairment (MCI) and Alzheimer’s disease (AD) subjects. The disease stage most compatible with each subjects’ data was determined using maximum likelihood7.