2276
Assessment of white matter changes associated with neurodegeneration in Alzheimer’s disease and early Parkinson’s disease1Neuroimaging Division, Barrow Neurological Institute, Phoenix, AZ, United States, 2Muhammad Ali Parkinson Center, Barrow Neurological Institute, Phoenix, AZ, United States
Synopsis
The objective of this study was to assess white matter integrity in both Alzheimer’s disease (AD) and early Parkinson’s disease (PD) using diffusion tensor imaging (DTI) metrics and connectivity analysis. Single-shell DTI data were obtained from open-source databases for AD and PD.
Introduction
Alzheimer's disease (AD) and Parkinson's disease (PD) are characterized by distinct clinical and pathological hallmarks, where AD is associated with memory decline and amyloid-beta and tau pathology and PD is associated with motor symptoms, dopaminergic dysfunction, and Lewy body pathology. However, it is increasingly recognized that these neurodegenerative disorders exhibit significant overlap in both clinical and pathological aspects1. For example, Lewy body inclusions have been observed in the amygdala in sporadic AD2. Additionally, cognitive decline occurs in up to 80% of PD patients3, and AD may co-exist with PD4. In this study, diffusion tensor imaging (DTI) was used to analyze brain differences associated with neurodegeneration using open-access databases for AD and PD. We assessed structural connectivity and white matter (WM) integrity using fractional anisotropy (FA) and axial/radial diffusivities (AxD and RD, respectively) between groups of AD, early-PD, and corresponding healthy controls (HC).Methods
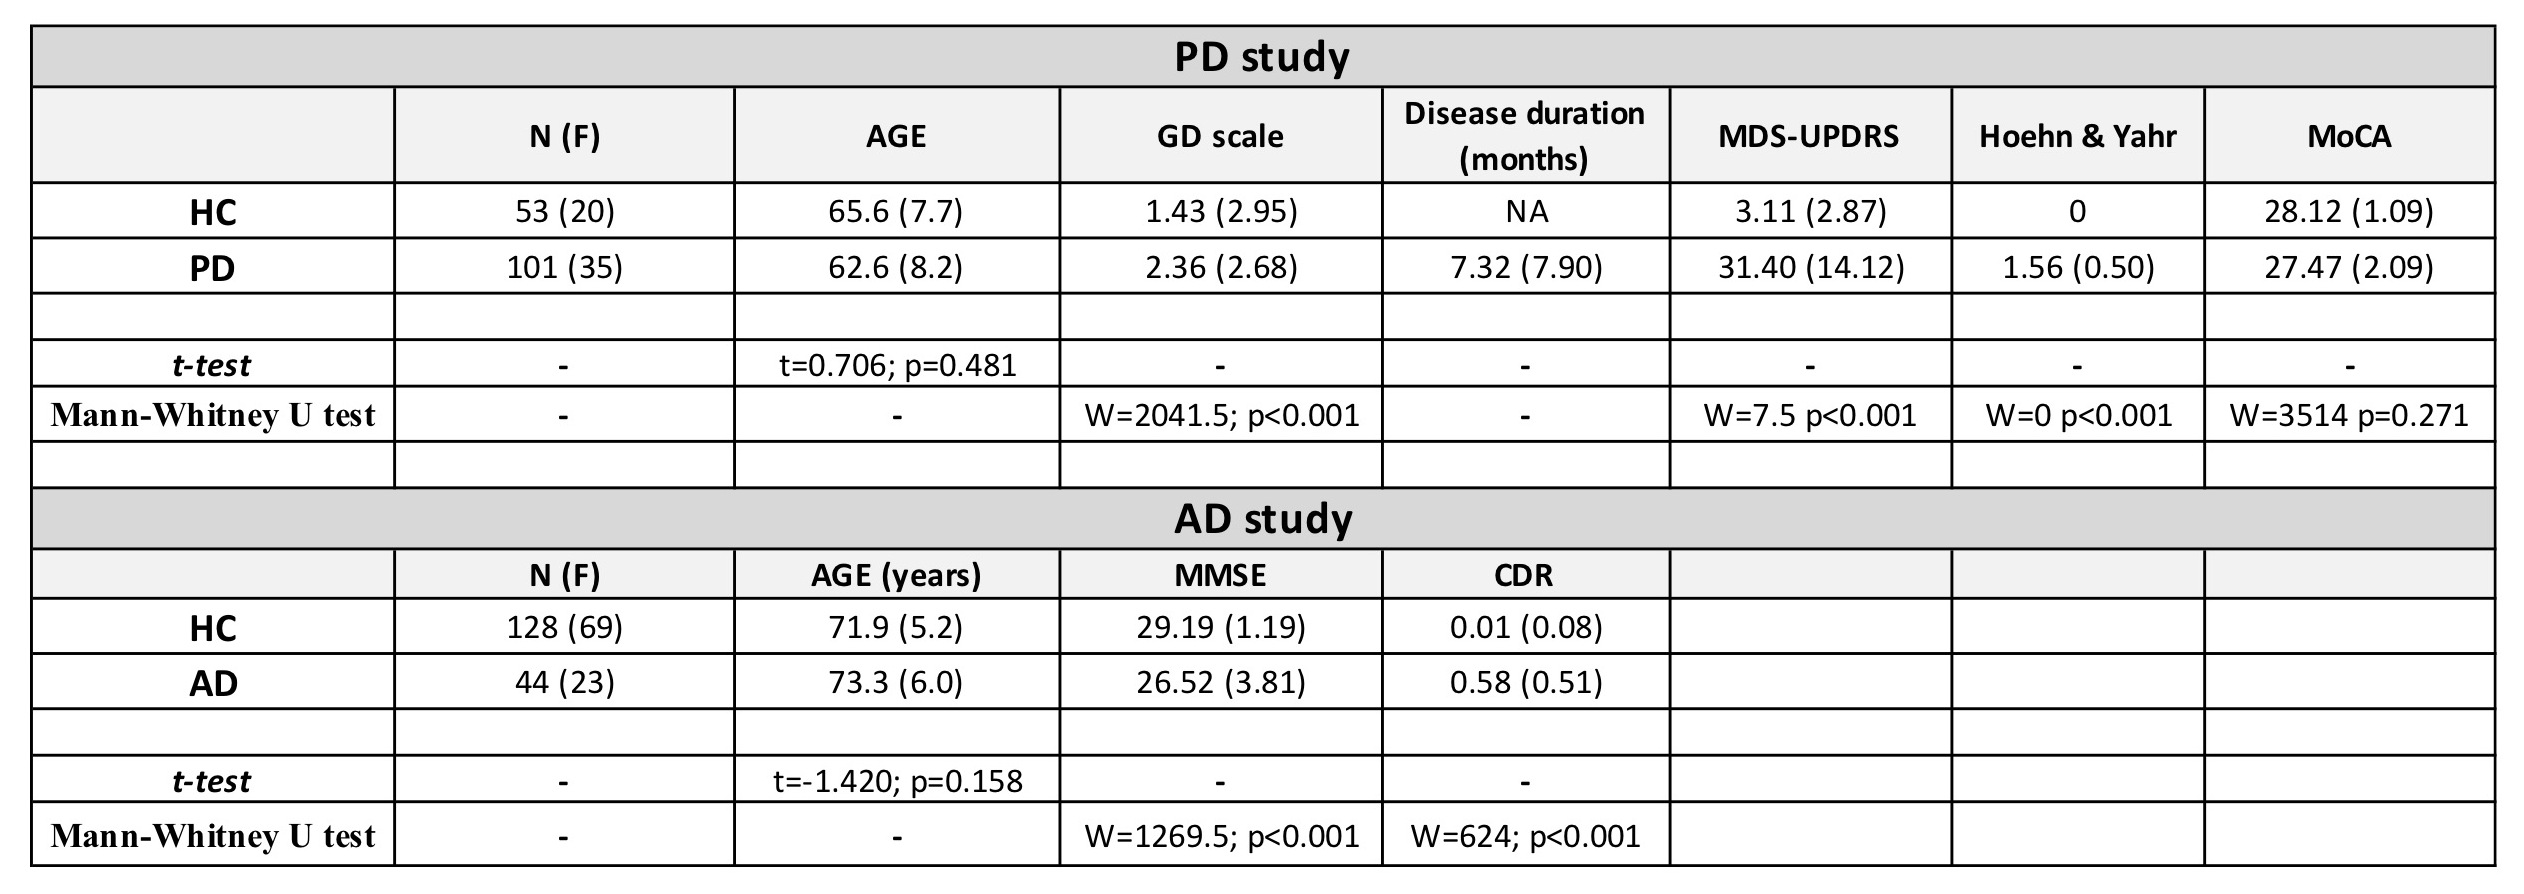
For the AD comparisons, we included 128 HCs and 44 AD subjects from the OASIS-3 database (https://www.oasis-brains.org/). For the PD comparisons, we included 53 HCs and 101 early-PD (all unmedicated) patients from the PPMI database (www.ppmi-info.org/data) (Figure 1). DTI for both acquisitions included 64 diffusion-encoding directions and two b-values: b=0 (one volume) and b=1000 s/mm². For both studies, identical DTI pre-processing was performed using Mrtrix35, FSL6, and ANTs (http://stnava.github.io/ANTs/) for denoising, eddy current, motion, and bias field corrections. FA maps were fit by a weighted-linear fit (dtifit). Tractography was performed with 5 million seeds using the iFOD2 algorithm7 and using the WM/grey-matter border as seed locations. The connectome was generated from the automated anatomical labelling (AAL) atlas8 and was subsequently filtered using the COMMIT algorithm9. Statistical analysis was performed by connectomestats (Mrtrix3) for structural connectivity and randomise (FSL, 5,000 permutations) for voxel-based analysis of DTI-derived metrics using ANCOVA with age and sex as covariates. Significant results are reported at a p-value<0.05 with family-wise error (FWE) rate corrections. The effect-size (Hedges’ g) was calculated using R and R-Studio.Results
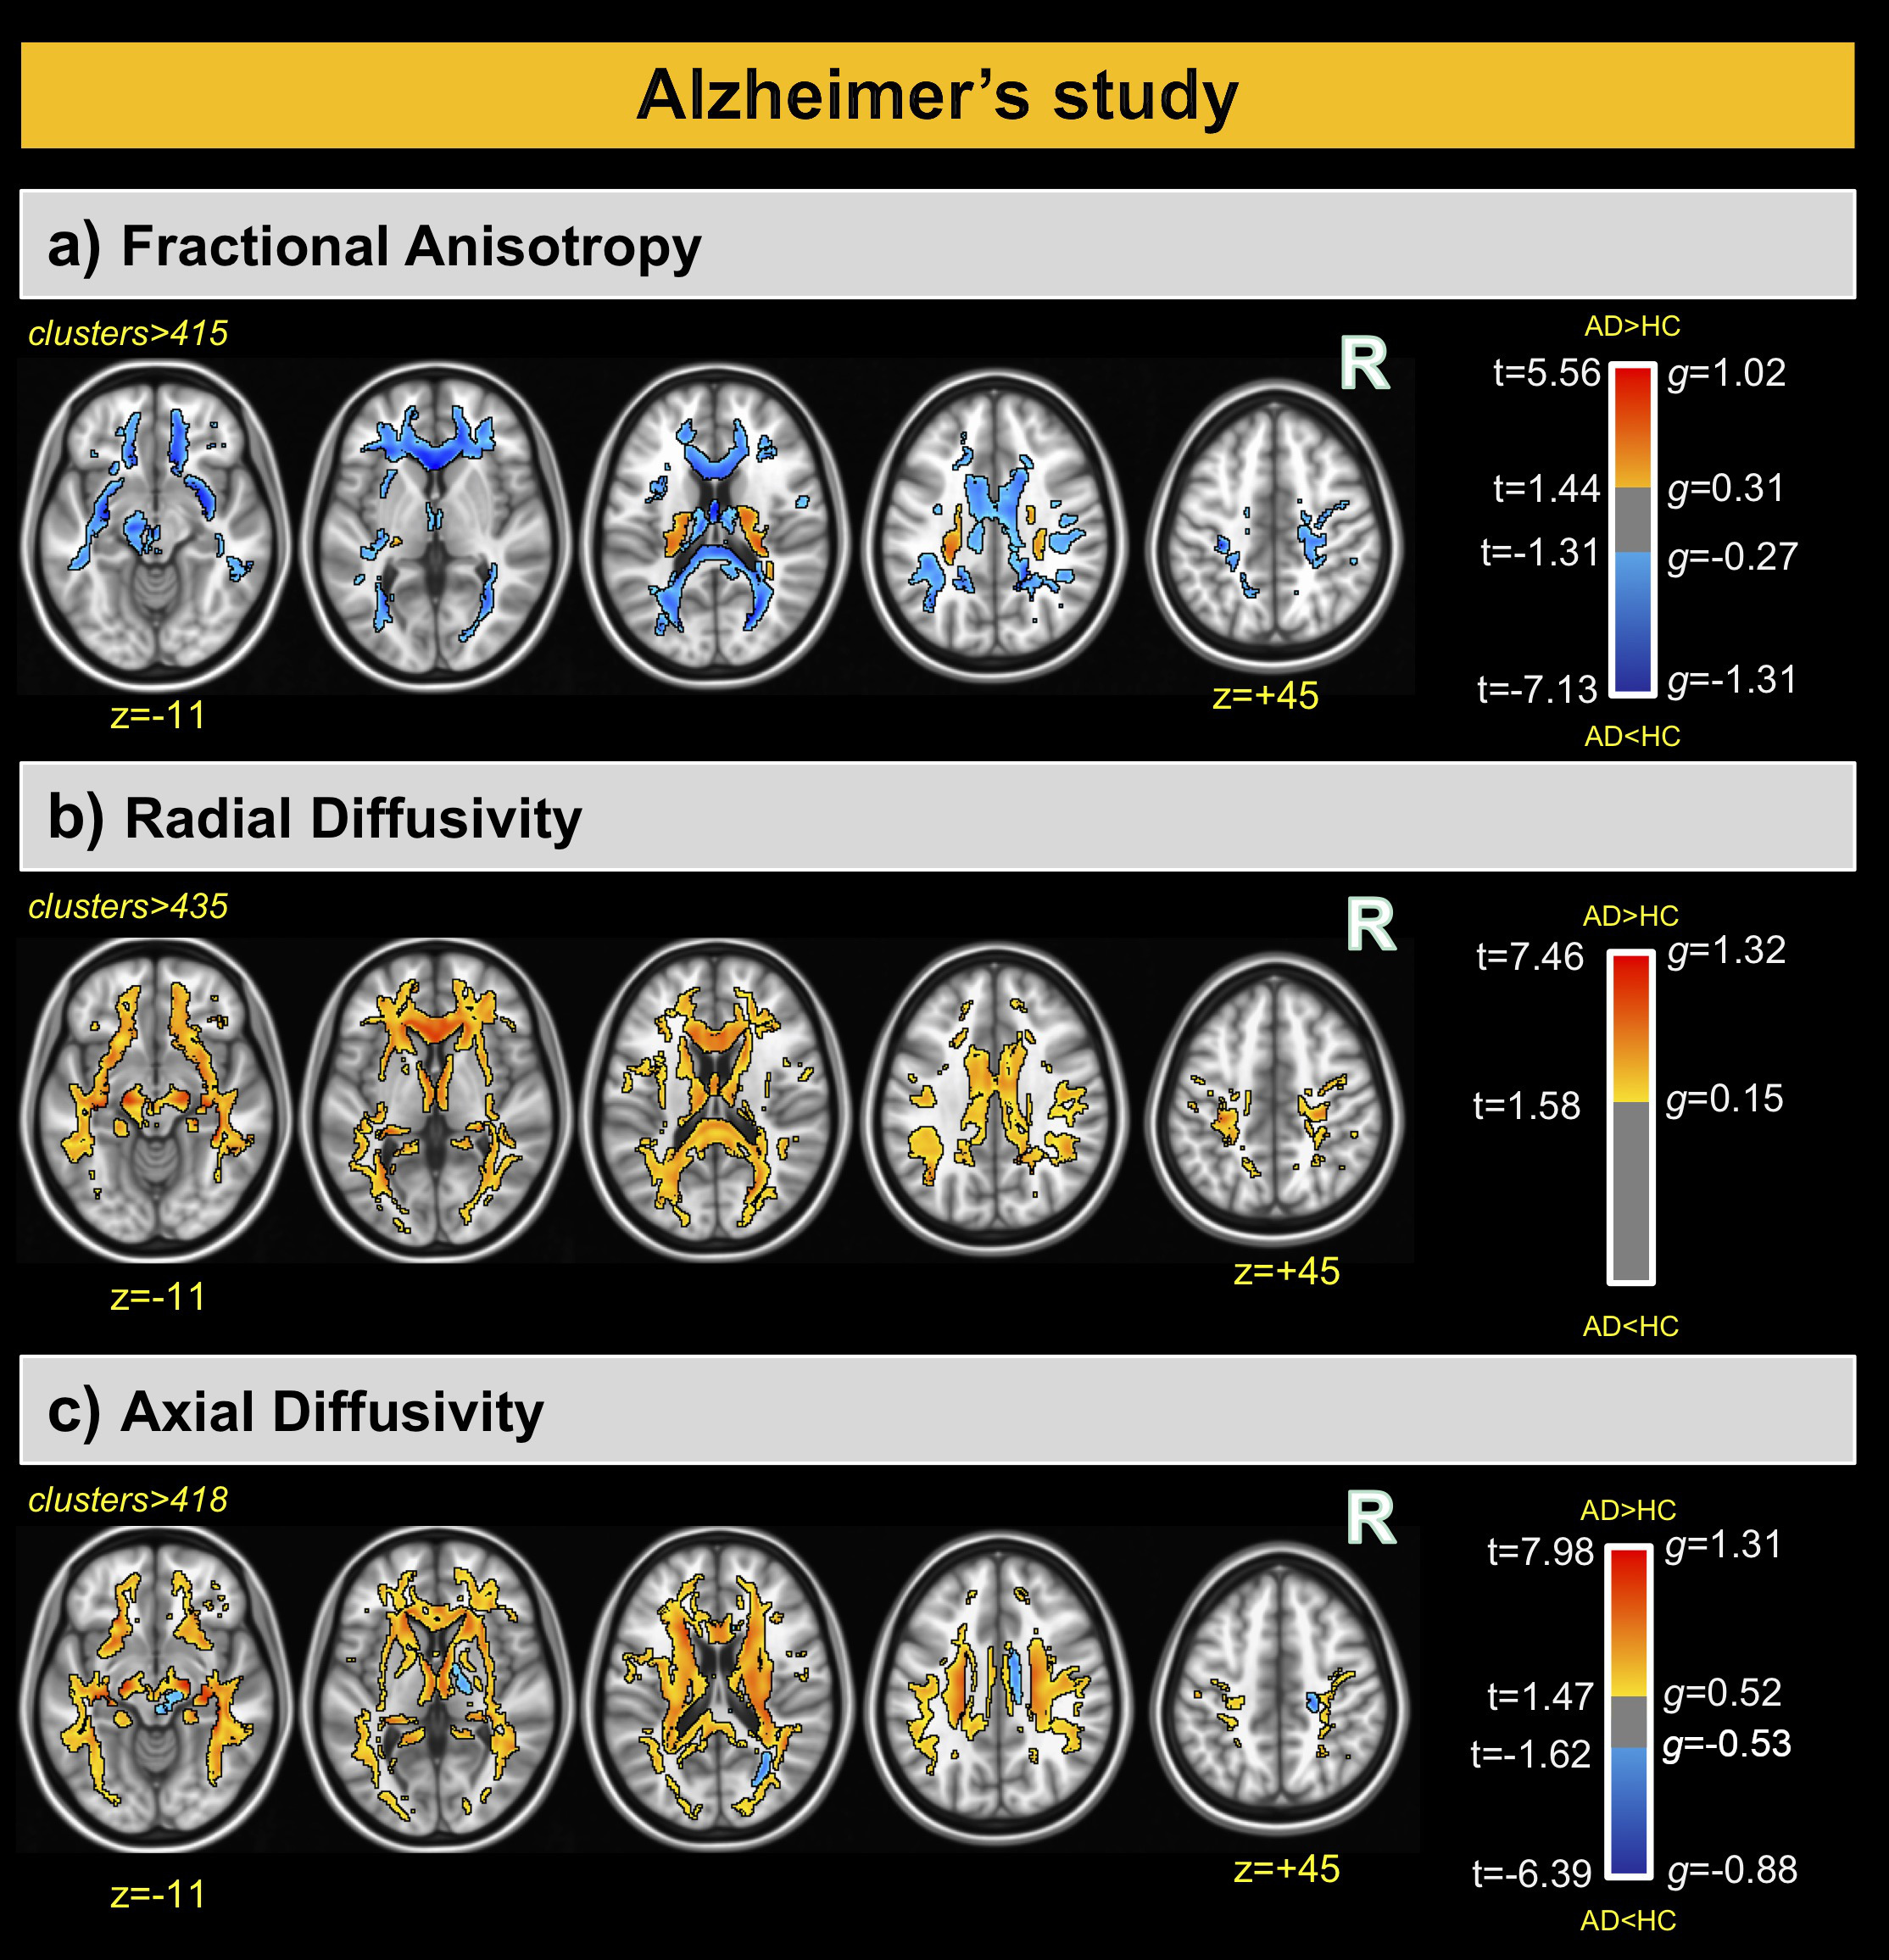
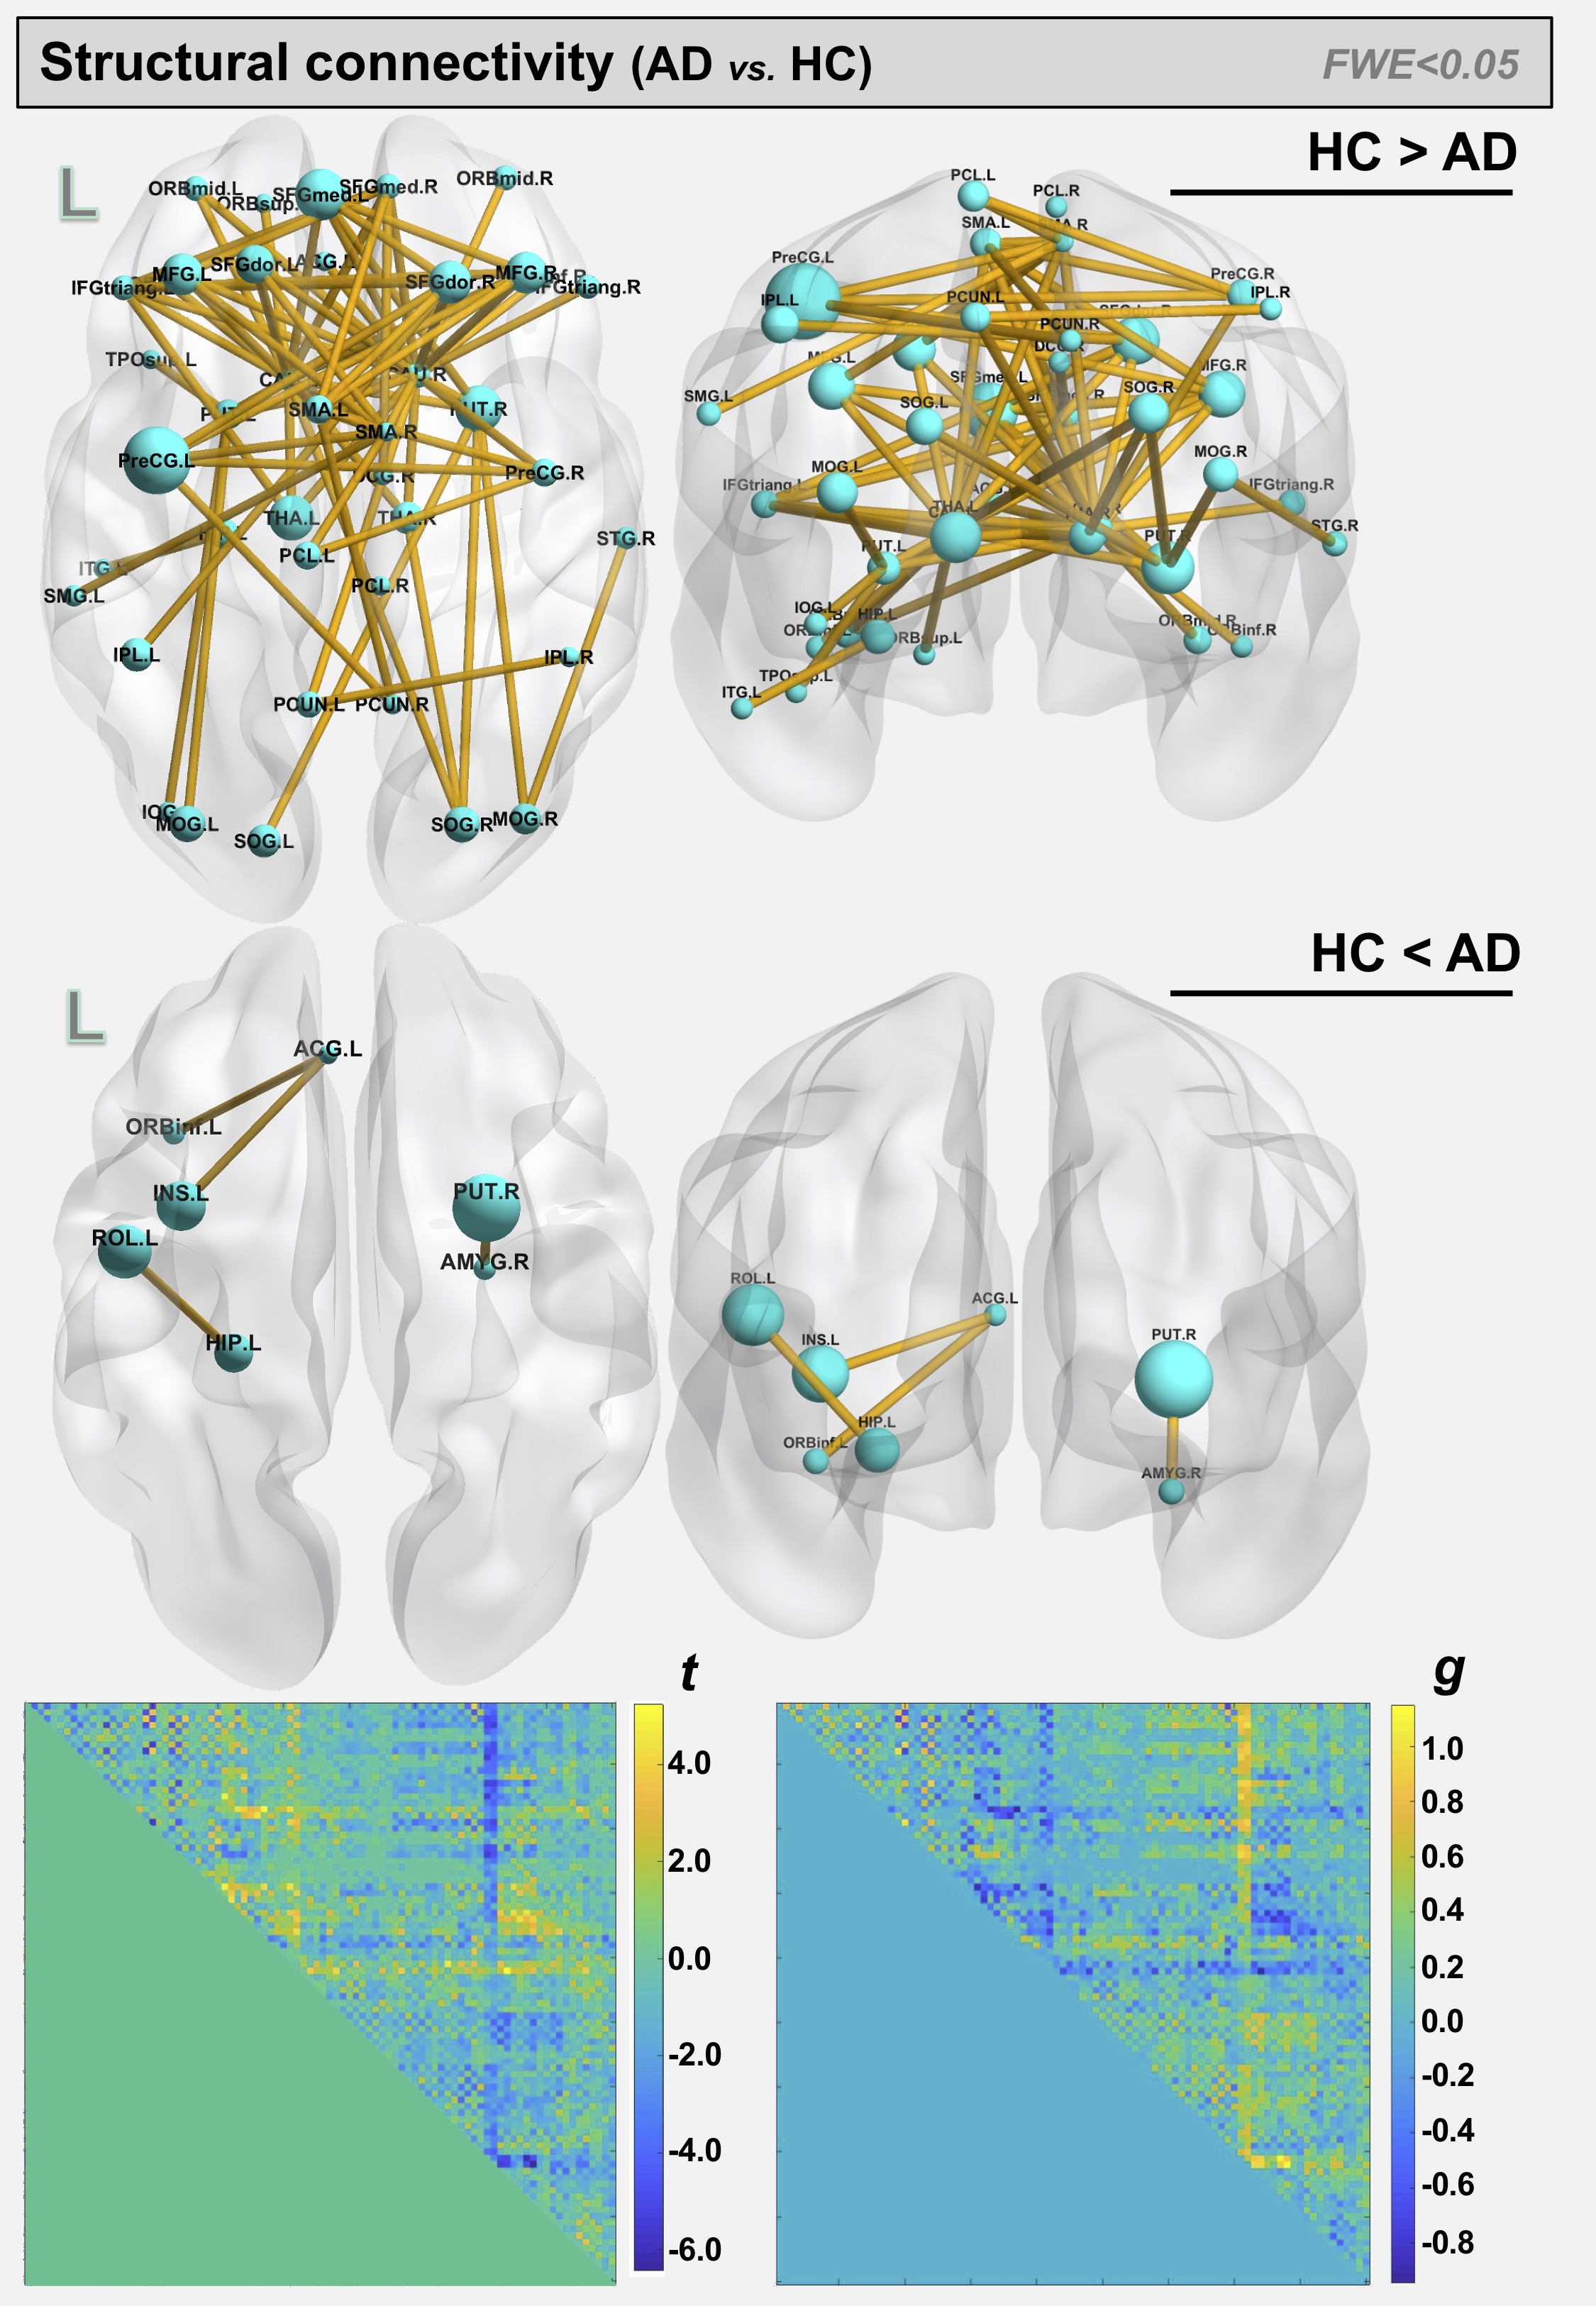
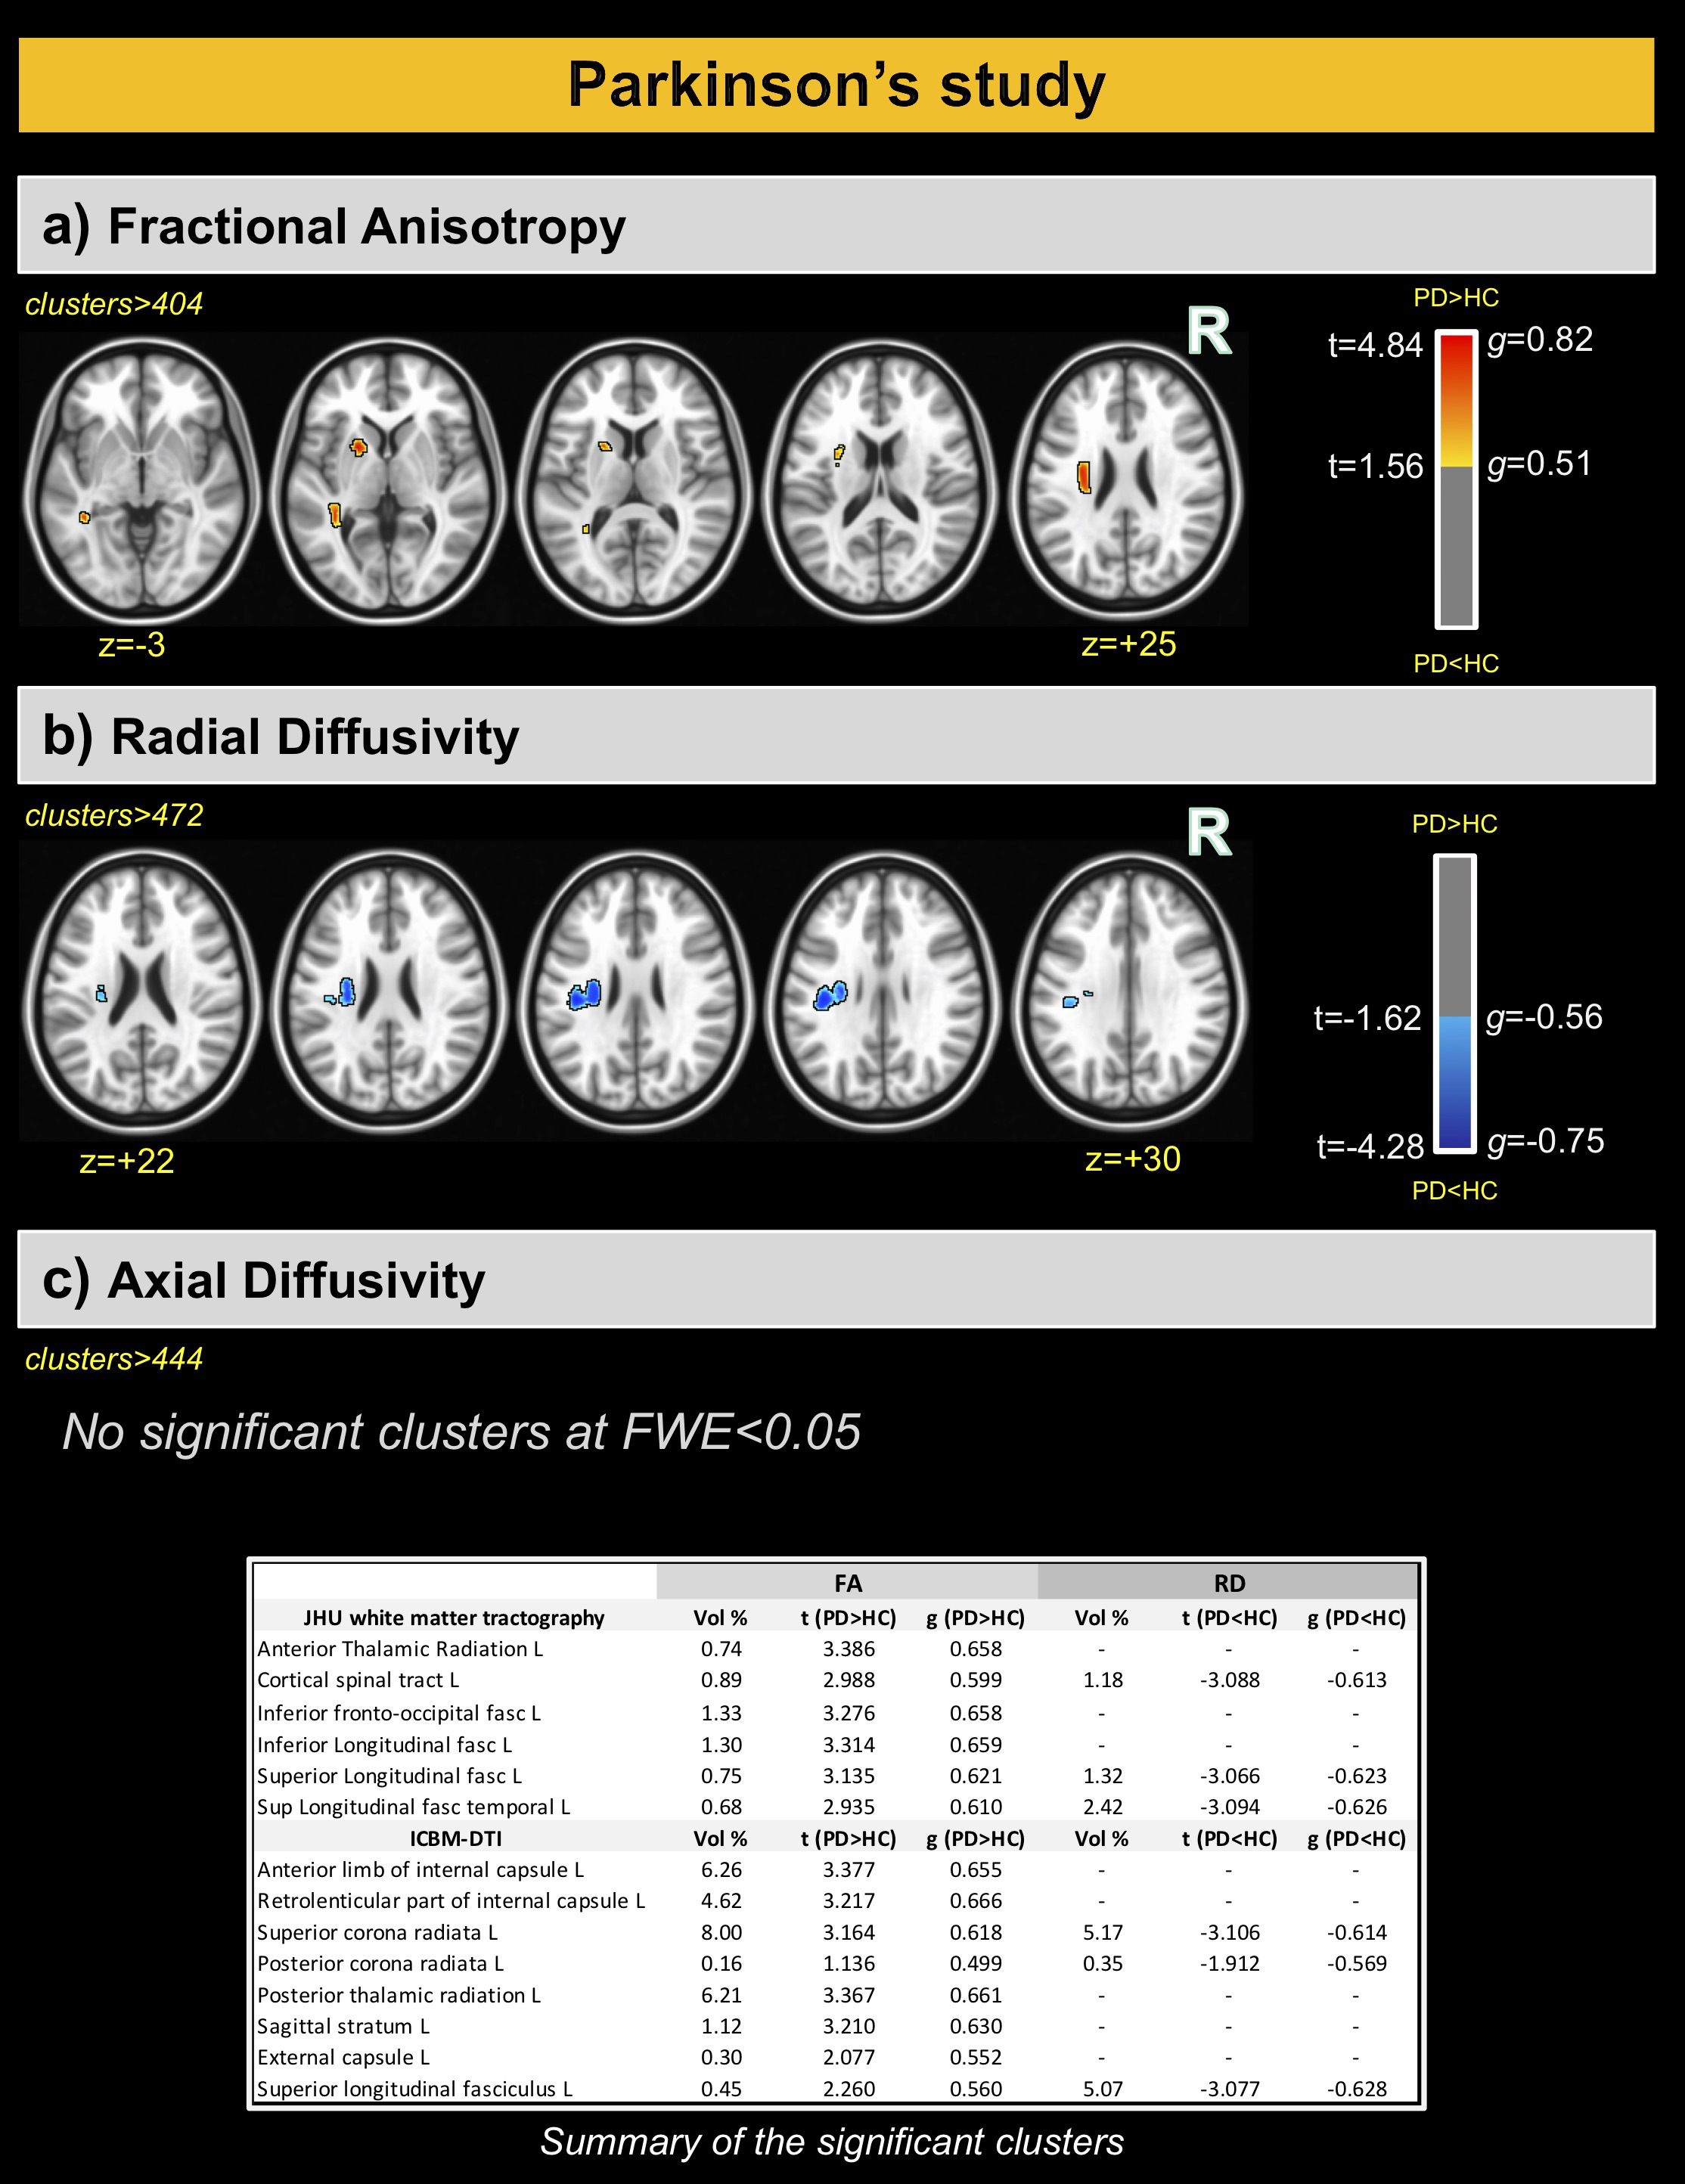
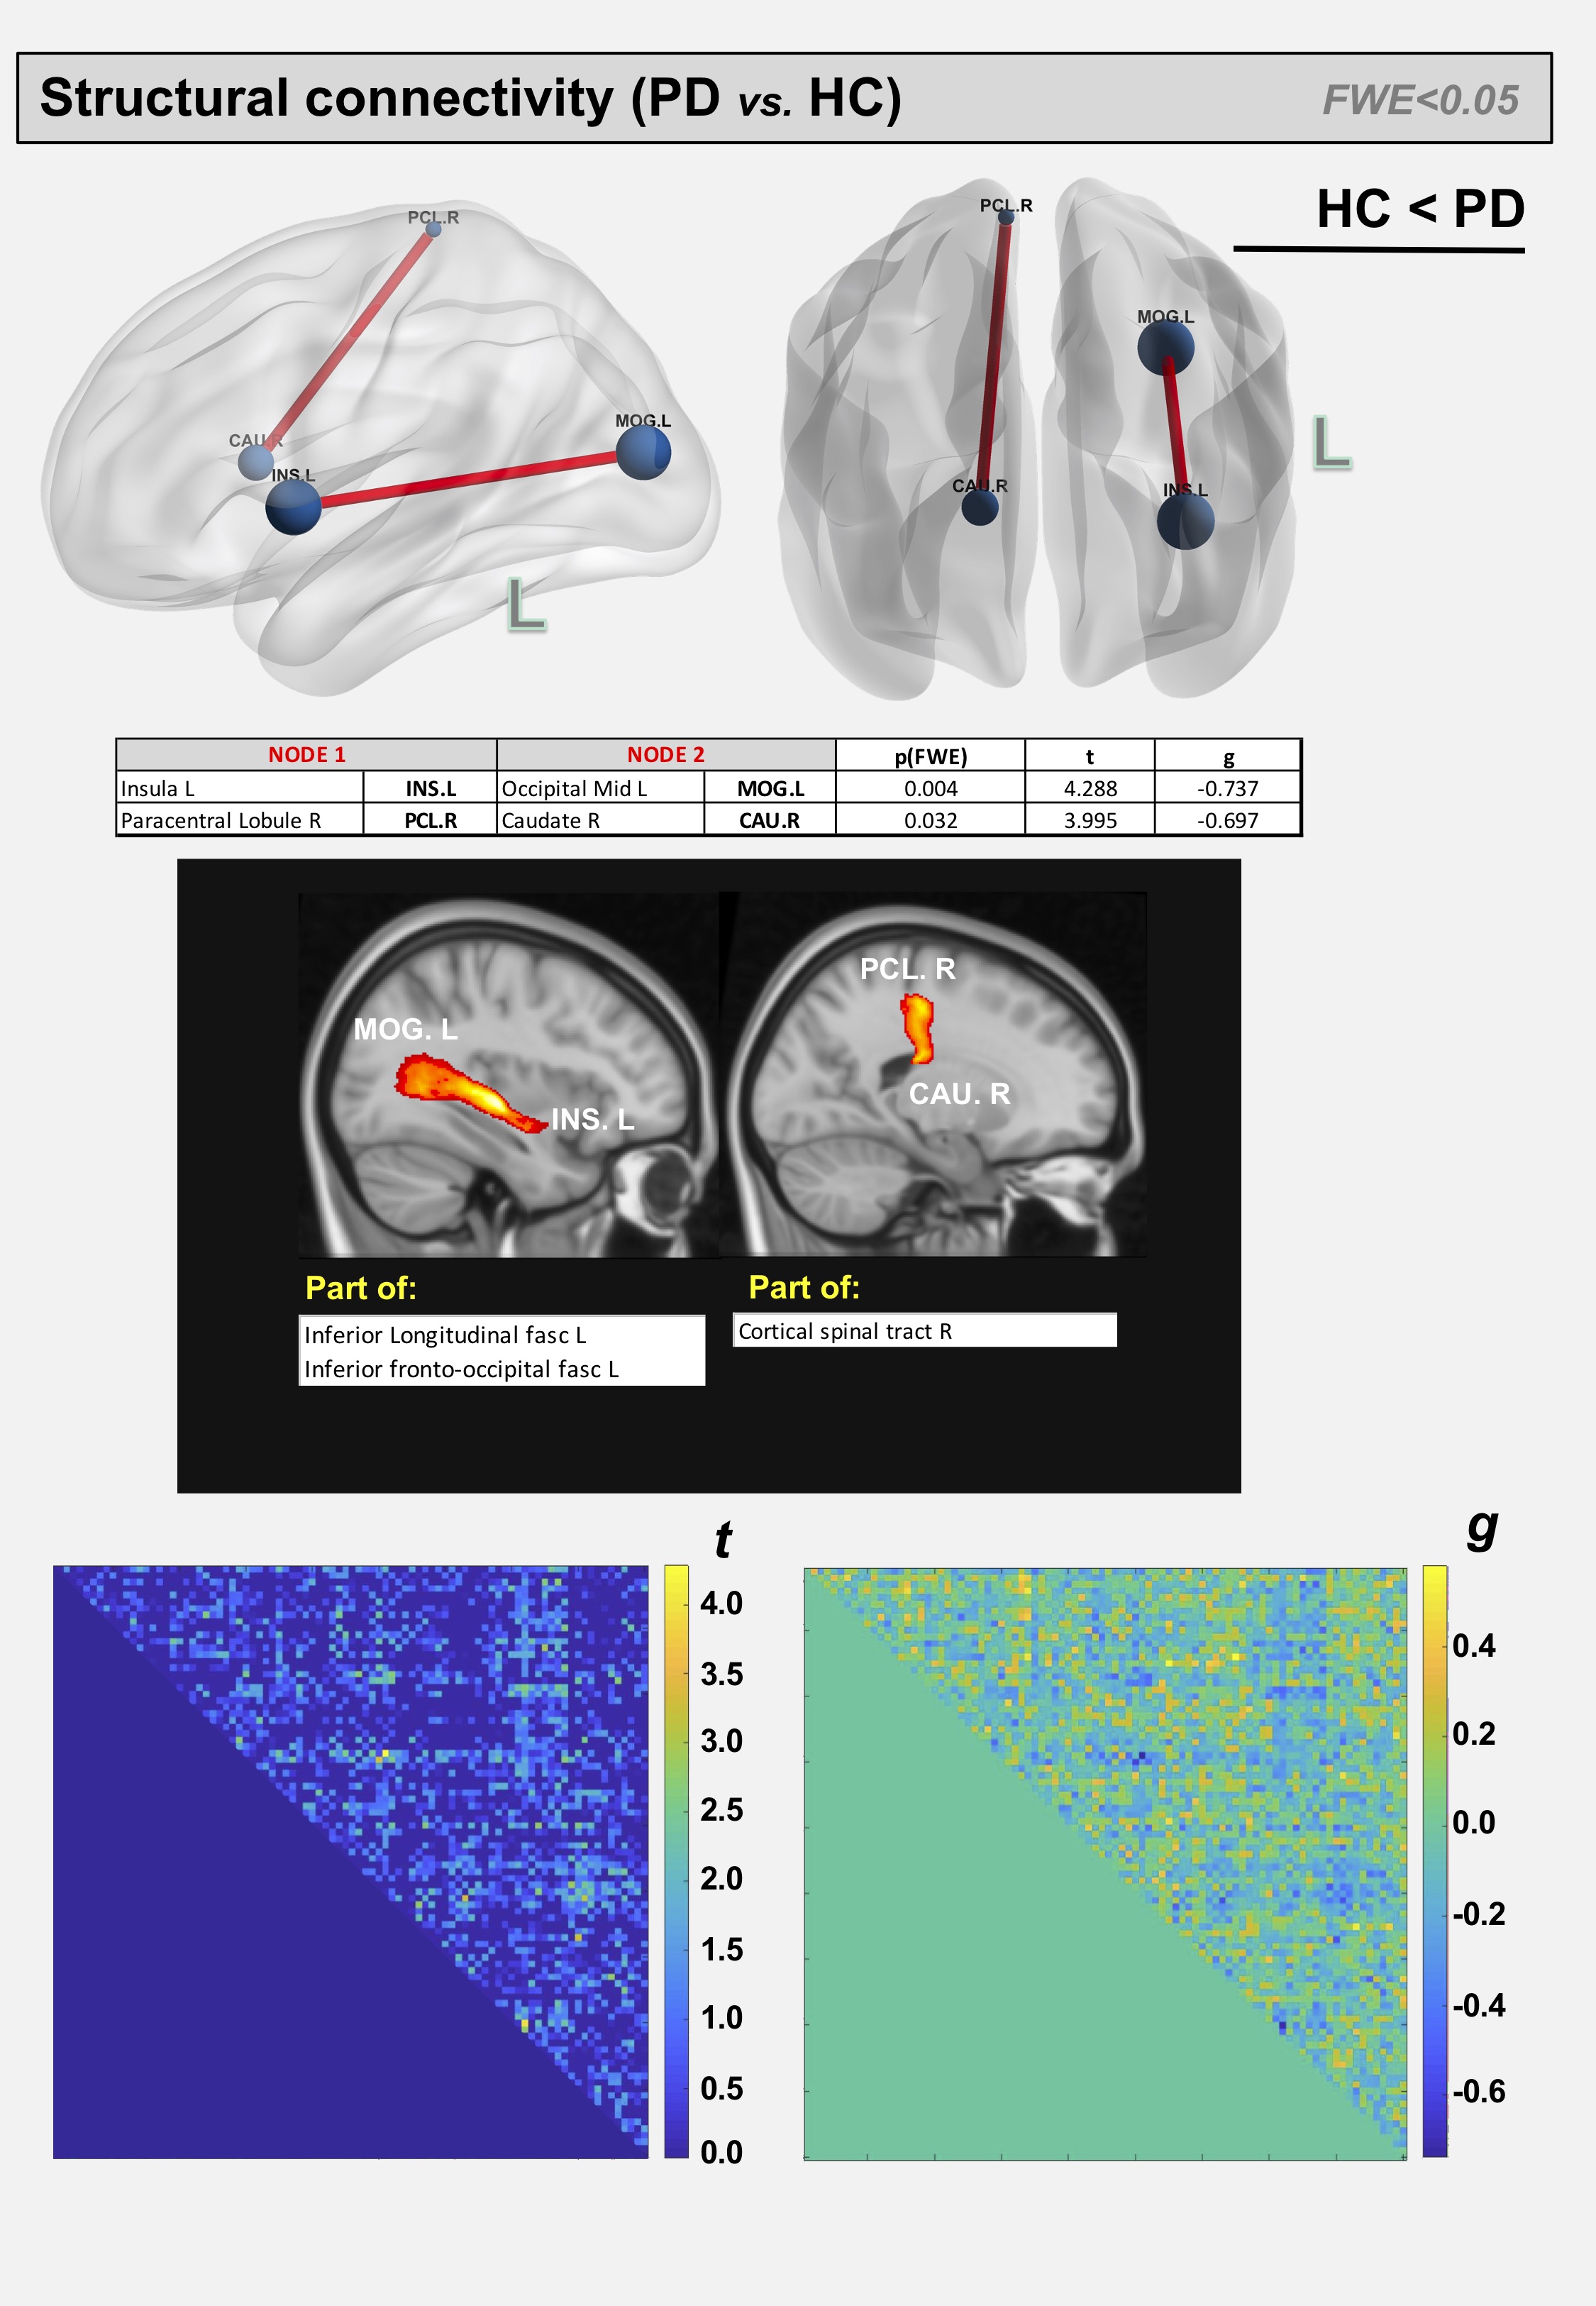
For the AD and corresponding HC cohort, the groups did not differ significantly in age (t=1.420; p=0.158), while significant differences were detected for the Mini-Mental State Exam (MMSE) and CDR scores (W=1269; p<0.001 and W=624; p<0.001). For the PD and corresponding HC cohort, the groups did not differ significantly in age (t=7.06; p=0.481); however, significant differences were detected for the MDS-Unified Parkinson's Disease Rating Scale (MDS-UPDRS) and Hoehn & Yahr (H&Y) scores (W=7.5; p<0.001 and W=0; p<0.001) (See Figure 1). For comparisons between AD and HCOASIS groups, voxel-based analysis of DTI-metrics detected large WM differences, with lower FA, higher RD, and higher AxD in AD than HCOASIS. Significant clusters in the anterior thalamic radiation (ATR), cortical spinal tract (CST), internal capsule, and corona radiata showed higher FA and lower AxD values in AD compared to HC (Figure 2). Connectivity analysis also showed a relative loss in WM connectivity in AD compared with HC (Figure 3). Interestingly, voxel-based analysis of DTI-metrics between PD and HCPPMI groups showed higher FA and lower RD in PD subjects (Figure 4). No group-wise differences were observed for AxD. Higher connectivity in PD compared to HCs was detected between left insula and left middle occipital gyrus, which included the left inferior longitudinal fasciculus (L-ILF) and left inferior fronto-occipital fasciculus (L-IFOF), and between the right paracentral lobule and right caudate, which included the right CST (Figure 5).Discussion
In this study, we used consistent methodology to assess WM changes in AD and PD using DTI metrics and connectivity analysis. As expected, AD subjects showed lower FA and higher RD and AxD in several WM areas, mainly in the corpus callosum and fornix, which is the major output tract of the hippocampus and contributes to episodic memory10. Decreased FA and increased RD in the fornix has been consistently found in AD10 and may correlate with cognitive decline11. Additionally, lower connectivity in these patients was observed in several WM tracts. Consistent with the literature, we also detected some WM locations with higher FA and lower AxD in AD than HC, which may be attributable to a loss of crossing fibers12. For PD, higher FA and increased connectivity was observed compared with the control group, mainly in the L-ILF, L-IFOF, and R-CST. Increased FA conflicts with expected trends due to neurodegeneration but has previously been reported using PPMI data13; however, the underlying pathophysiological relevance remains unknown. Additionally, increased structural connectivity has been previously observed14 and may be associated with compensatory mechanisms aimed at preserving function despite progressive levels of neurodegeneration. One limitation of this study is that direct comparisons between AD and PD are hindered by differing disease characteristics. That said, combined investigations of AD and PD brain changes may yield critical insight into similarities and differences between these devastating neurogenerative pathologies.Conclusions
In this study we demonstrated differences in WM integrity and structural connectivity in both AD and PD subjects. In general, lower FA and connectivity were detected in AD compared to HCs in several WM areas. On the other hand, increased FA and connectivity were found in early-PD compared with HCs.Acknowledgements
This work was supported by the Arizona Alzheimer’s Consortium and the Barrow Neurological Foundation.References
1. Perl DP, Olanow CW, Calne D. Alzheimer's disease and Parkinson's disease: distinct entities or extremes of a spectrum of neurodegeneration? Ann Neurol. Sep 1998;44(3 Suppl 1):S19-31. doi:10.1002/ana.410440705
2. Hamilton RL. Lewy bodies in Alzheimer's disease: a neuropathological review of 145 cases using alpha-synuclein immunohistochemistry. Brain Pathol. Jul 2000;10(3):378-84. doi:10.1111/j.1750-3639.2000.tb00269.x
3. Aarsland D, Andersen K, Larsen JP, Lolk A, Kragh-Sørensen P. Prevalence and characteristics of dementia in Parkinson disease: an 8-year prospective study. Arch Neurol. Mar 2003;60(3):387-92. doi:10.1001/archneur.60.3.387
4. Dugger BN, Serrano GE, Sue LI, et al. Presence of Striatal Amyloid Plaques in Parkinson's Disease Dementia Predicts Concomitant Alzheimer's Disease: Usefulness for Amyloid Imaging. J Parkinsons Dis. Jan 01 2012;2(1):57-65. doi:10.3233/JPD-2012-11073
5. Tournier JD, Smith R, Raffelt D, et al. MRtrix3: A fast, flexible and open software framework for medical image processing and visualisation. Neuroimage. 11 15 2019;202:116137. doi:10.1016/j.neuroimage.2019.116137
6. Jenkinson M, Beckmann CF, Behrens TE, Woolrich MW, Smith SM. FSL. Neuroimage. Aug 15 2012;62(2):782-90. doi:10.1016/j.neuroimage.2011.09.015
7. Willats L, Raffelt D, Smith RE, Tournier JD, Connelly A, Calamante F. Quantification of track-weighted imaging (TWI): characterisation of within-subject reproducibility and between-subject variability. Neuroimage. Feb 15 2014;87:18-31. doi:10.1016/j.neuroimage.2013.11.016
8. Tzourio-Mazoyer N, Landeau B, Papathanassiou D, et al. Automated anatomical labeling of activations in SPM using a macroscopic anatomical parcellation of the MNI MRI single-subject brain. Neuroimage. Jan 2002;15(1):273-89. doi:10.1006/nimg.2001.0978
9. Daducci A, Dal Palù A, Lemkaddem A, Thiran JP. COMMIT: Convex optimization modeling for microstructure informed tractography. IEEE Trans Med Imaging. Jan 2015;34(1):246-57. doi:10.1109/TMI.2014.2352414
10. Oishi K, Lyketsos CG. Alzheimer's disease and the fornix. Front Aging Neurosci. 2014;6:241. doi:10.3389/fnagi.2014.00241
11. Mielke MM, Kozauer NA, Chan KC, et al. Regionally-specific diffusion tensor imaging in mild cognitive impairment and Alzheimer's disease. Neuroimage. May 15 2009;46(1):47-55. doi:10.1016/j.neuroimage.2009.01.054
12. Bergamino M, Walsh RR, Stokes AM. Free-water diffusion tensor imaging improves the accuracy and sensitivity of white matter analysis in Alzheimer's disease. Sci Rep. 03 26 2021;11(1):6990. doi:10.1038/s41598-021-86505-7
13. Zhang Y, Burock MA. Diffusion Tensor Imaging in Parkinson's Disease and Parkinsonian Syndrome: A Systematic Review. Front Neurol. 2020;11:531993. doi:10.3389/fneur.2020.531993
14. Mishra VR, Sreenivasan KR, Yang Z, et al. Unique white matter structural connectivity in early-stage drug-naive Parkinson disease. Neurology. 02 25 2020;94(8):e774-e784. doi:10.1212/WNL.0000000000008867
Figures