2275
Cerebral oxygen extraction fraction (OEF) mapping in cognitively impaired and intact elderly1Radiology, Weill Cornell Medicine, New York, NY, United States, 2Biomedical Engineering, Cornell University, Ithaca, NY, United States, 3College of Osteopathic Medicine, New York Institute of Technology, Glen Head, NY, United States, 4Neurology, Weill Cornell Medicine, New York, NY, United States
Synopsis
Cerebral metabolic dysfunction is known to underlie cognitive impairment. This study using a novel challenge-free MRI-based oxygen extraction fraction (OEF) mapping method, namely “QQ”, demonstrated that lower OEF in white matter and hippocampus was associated with greater white matter hyperintensities in cognitively impaired, but not cognitively intact, elderly, whereas older age was association with decreased OEF in cortical gray matter in the cognitively intact. This study suggests that QQ-based OEF mapping may be a useful tool readily and widely available for investigating metabolic dysfunction underlying dementia.
Introduction
Cognitive impairment is widely prevalent among older individuals, affecting a reported 20% of adults over the age of 501. To investigate the cause and progression of cognitive impairment, tissue oxygen metabolism could provide insights. However, despite advances in PET and MRI, there is currently no clinically-utilized method to measure cerebral oxygen extraction fraction (OEF) with inconsistencies in the literature including some reporting decreased OEF with increasing age2, 3 and others finding no relationship between age and OEF4.Recently, a novel MRI-based OEF model has been developed by integrating quantitative susceptibility mapping and quantitative blood oxygen level-dependent magnitude (QQ)5-9. The QQ OEF shows high agreement with 15O-PET8 and is more easily implemented, since it utilizes a routine gradient echo sequence on widely available MR scanners without exogenous tracers. Clinical feasibility of QQ has been shown in patients with ischemic stroke10, 11, multiple sclerosis12, and brain cancer13.
Using QQ technique, we investigated the relationship of OEF with white matter hyperintensities (WMH) and older age, since WMH14 and age15 are strong predictors of dementia.
Methods
Data acquisition: 68 cognitively impaired (72 ± 8 years old, 41 females) and 32 age- and gender ratio-matched cognitively intact subjects (69 ± 10 years, p=0.062 using Wilcoxon rank sum ; 23 females, p =0.37 using Fisher’s exact test) underwent a 3T MRI protocol including 1) multi-echo gradient echo (mGRE) (TR 49 ms, TE1/ΔTE/TE10 6.7/4.1/43.2 ms flip angle 15 degrees, voxel size 0.72×0.72×3 mm3) for OEF reconstruction, 2) T2-weighted fluid-attenuated inversion recovery (T2-FLAIR) (TR/TE 6300-8500/394-446 ms, flip angle 120 degrees) for white matter hyperintensity (WMH) measurement, and 3) T1-weighted (TR/TE 600/11 ms, flip angle 120 degrees) for brain segmentation (Skyra, Biograph mMR, Siemens Healthcare).Data processing: OEF maps were estimated from QSM16 and mGRE magnitude using the QQ algorithm5-7 which combines two biophysics models of mGRE data: 1) QSM processing of phase data to estimate the susceptibility contribution of venous blood and neural tissue17-19, and 2) qBOLD modeling of magnitude signal decay by the intravoxel magnetic field variation caused by the susceptibility difference between cylindrical venous blood and surrounding tissue20-22. For robust OEF estimation against measurement noise, sparsity in space and time in the mGRE signal was used6, 7.
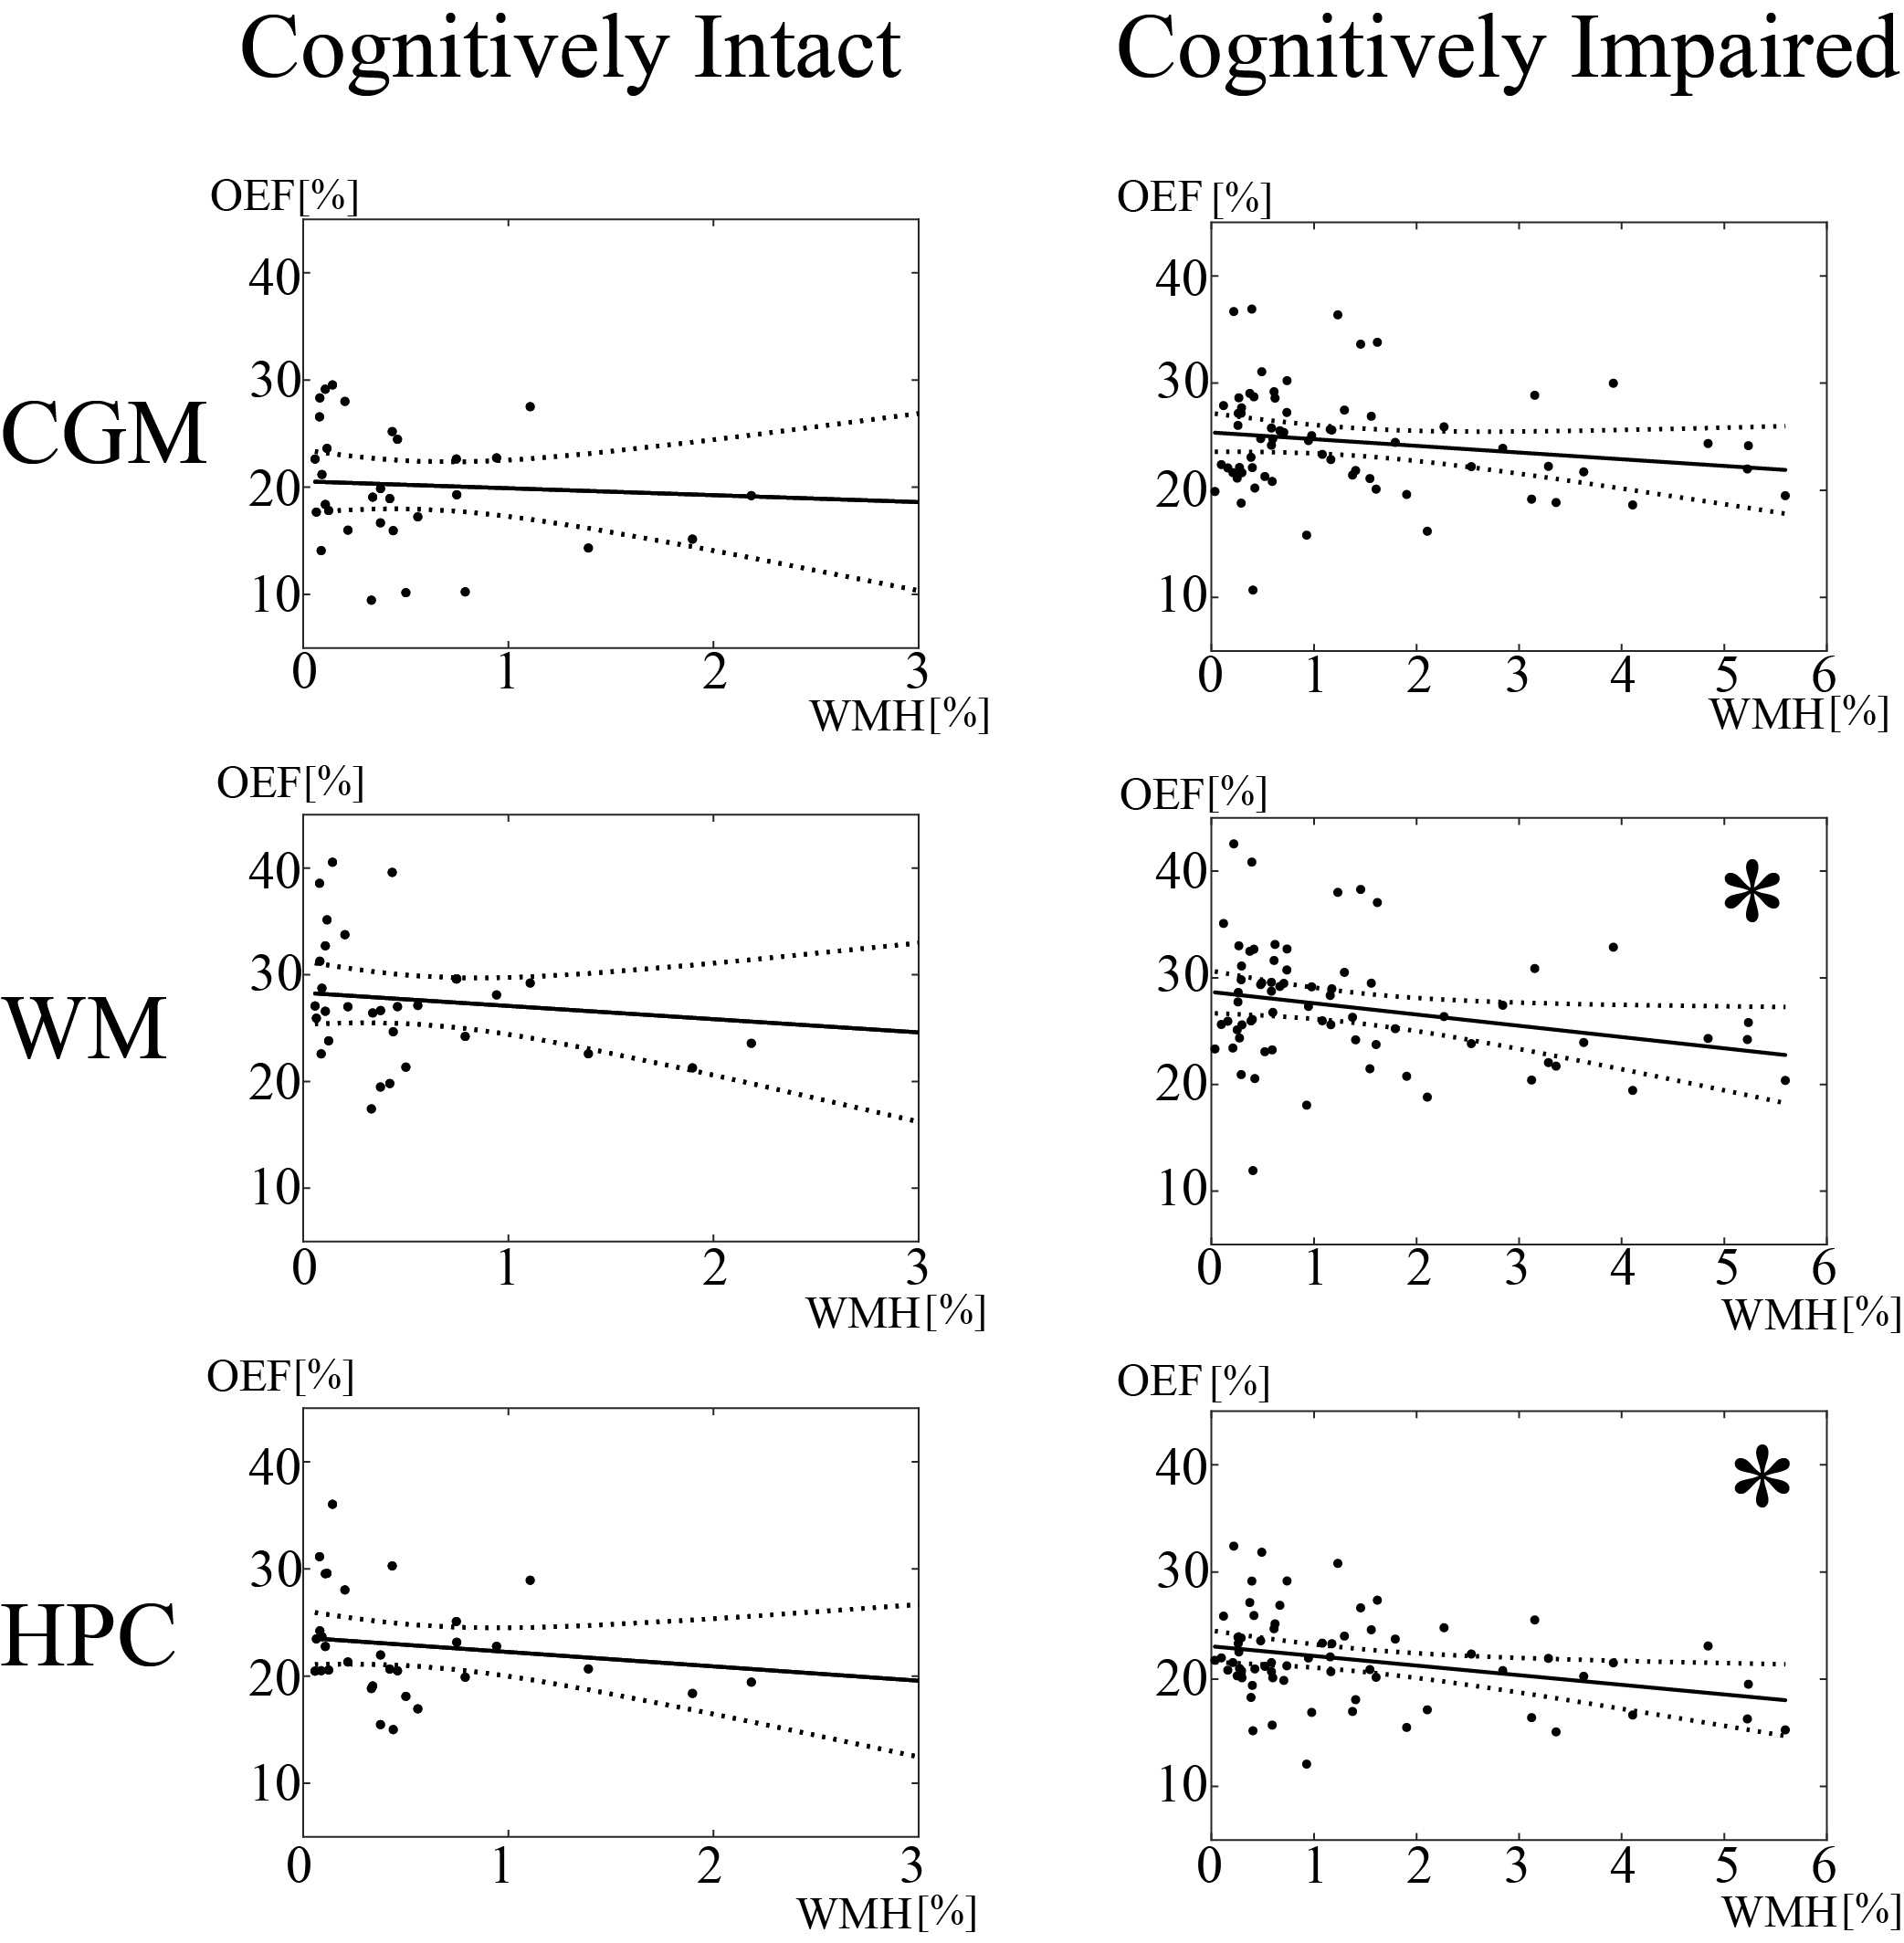
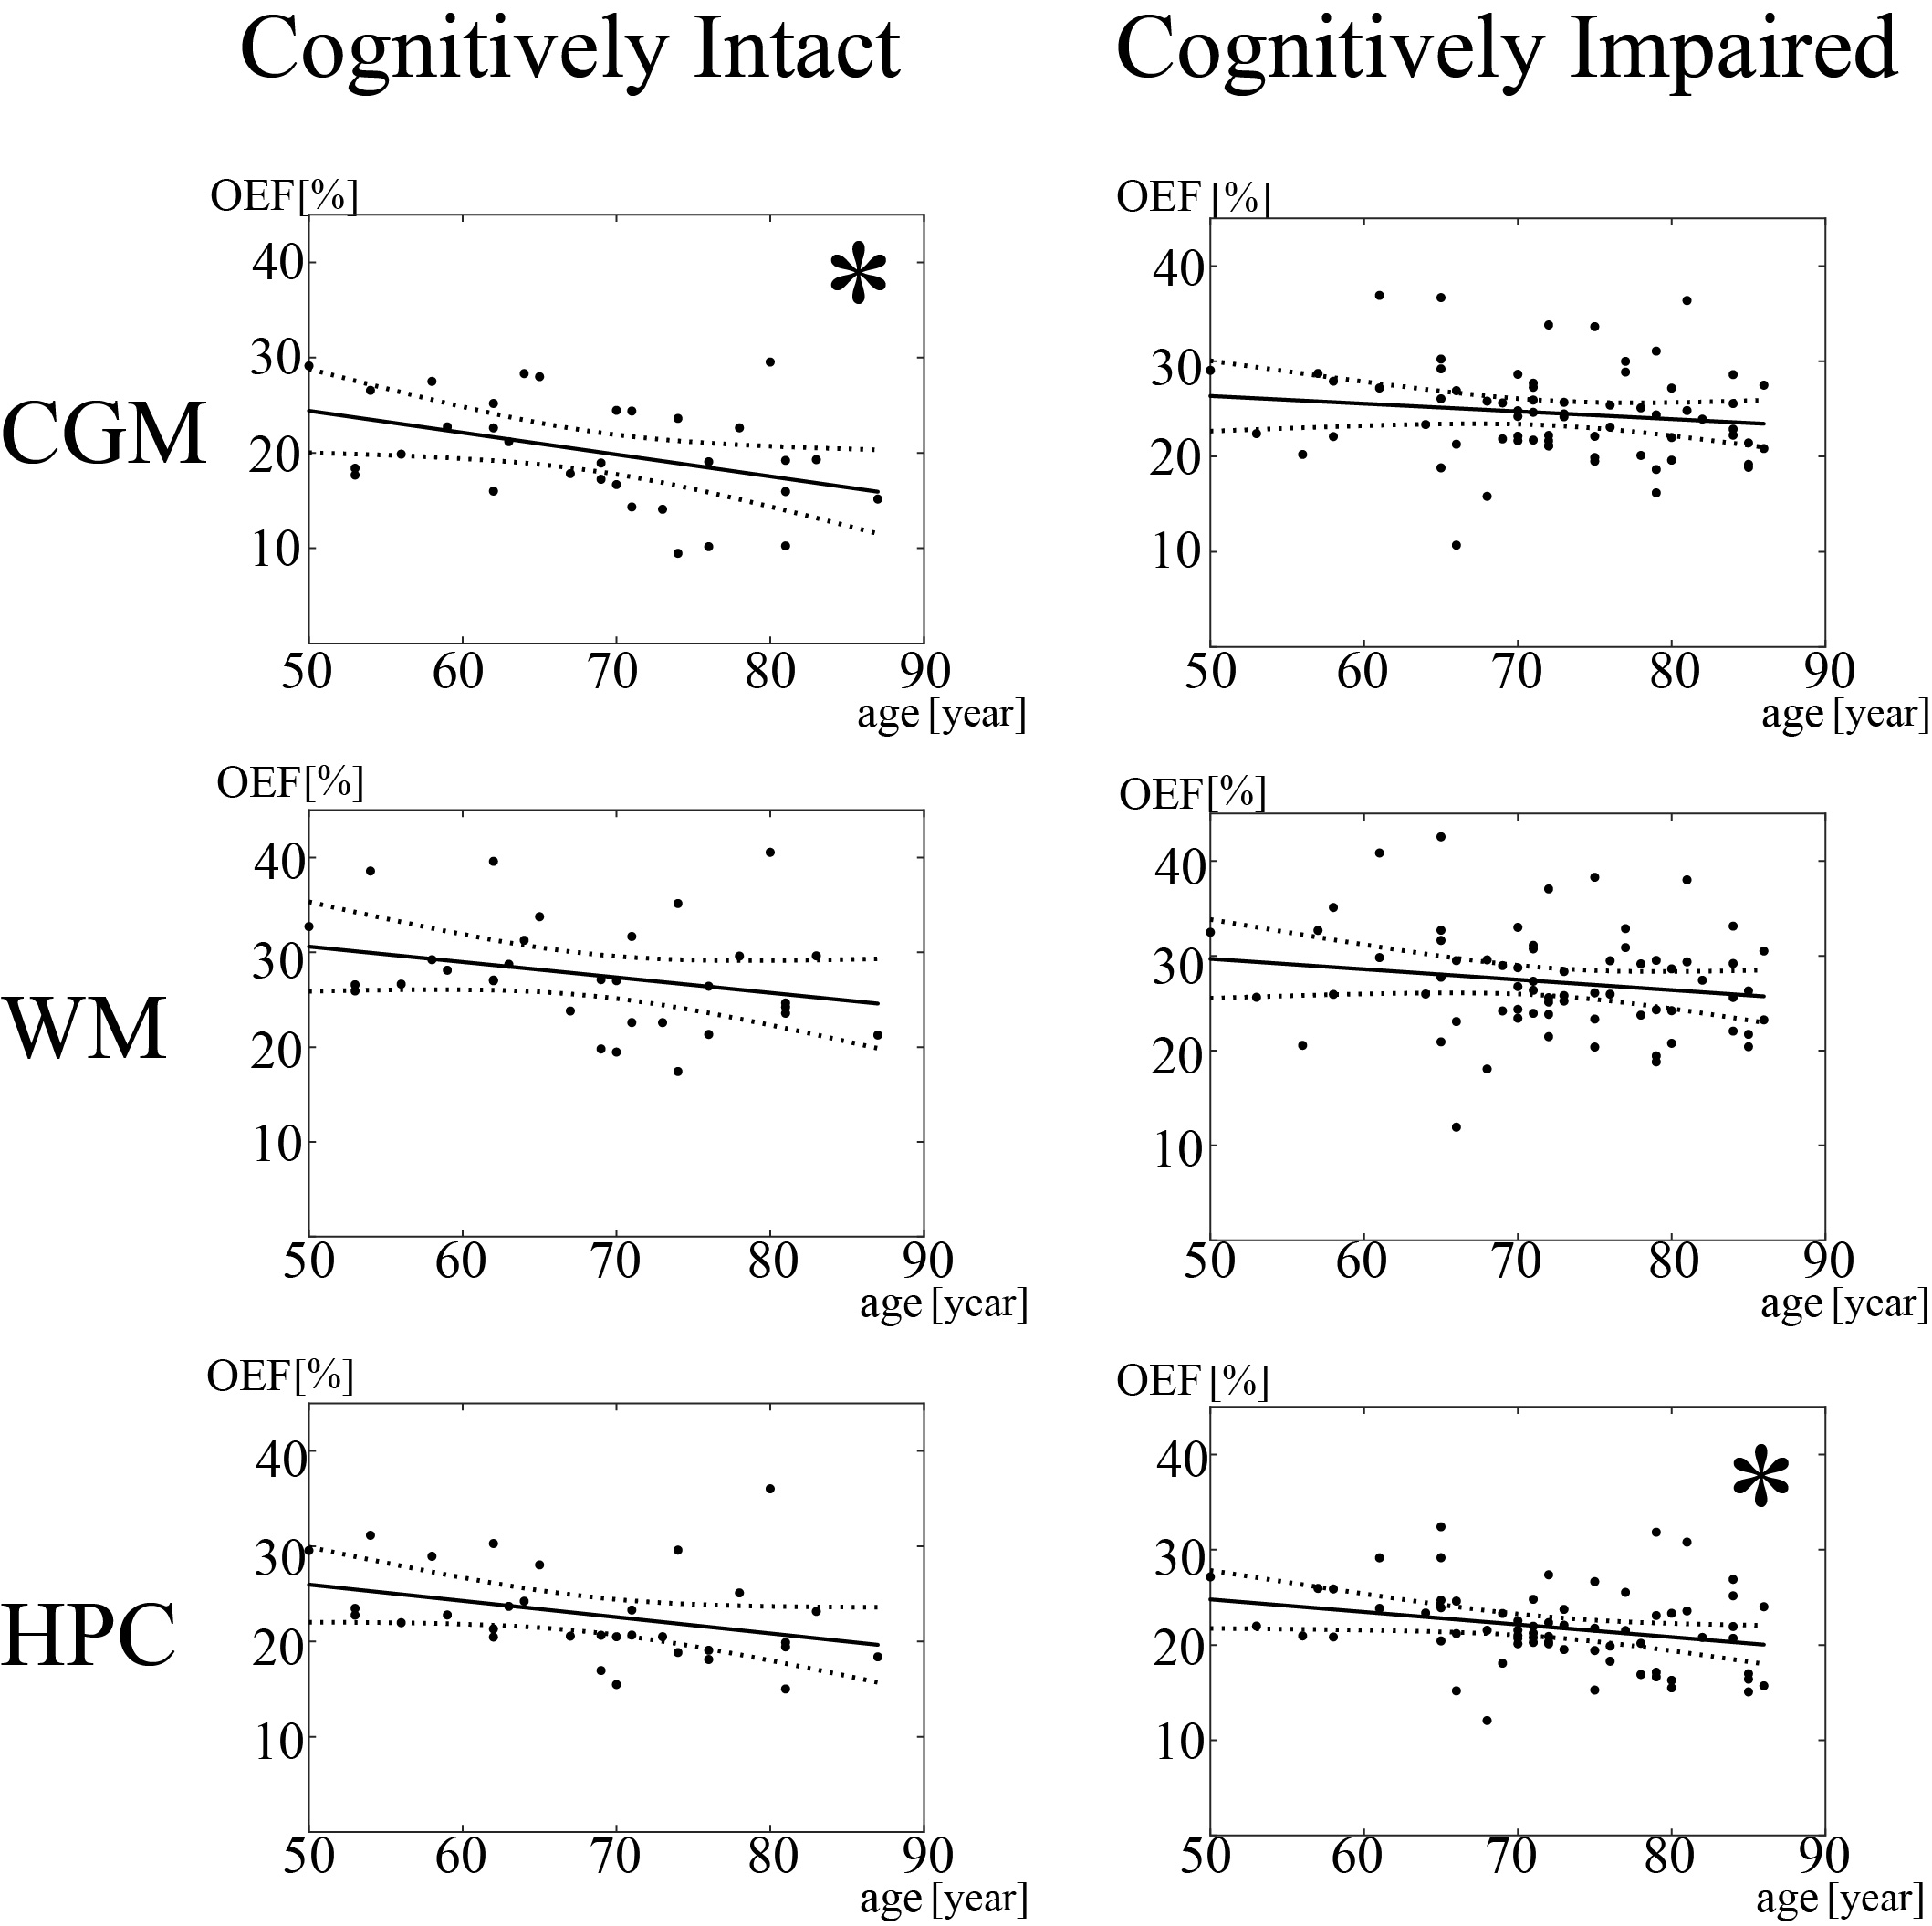
Statistical analysis: Freesurfer23 was used to segment cortical gray matter (CGM), white matter (WM), and hippocampus (HPC), which have been shown to be associated with cognitive impairment24, 25. WMH mask was constructed using a deep-learning approach26. The relationship between OEF and relative volume fraction of WMH to the whole brain (WMH burden) or age was assessed with ordinary least squares regression analyses (Figs. 2 and 3). Multivariate regression analysis was used to assess whether cognitive impairment was associated with OEF, with age and WMH burden as covariates. A p-value of less than 0.05 was considered statistically significant.
Results
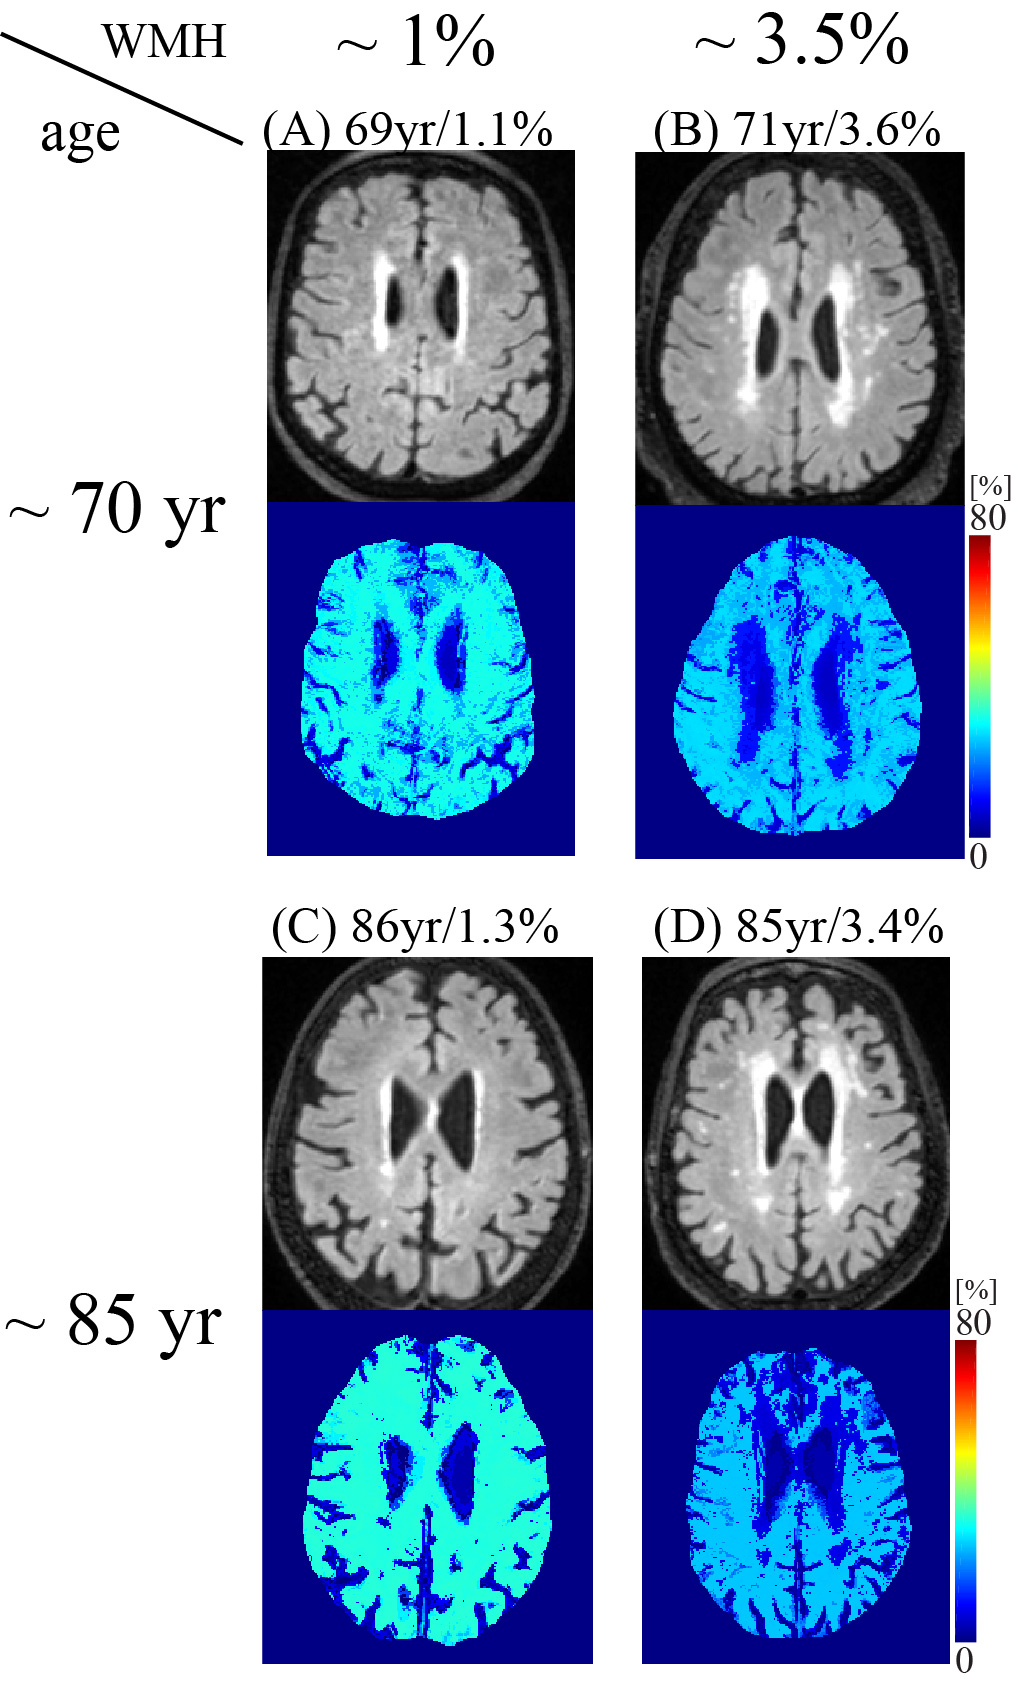
Increased WMH burden was associated with decreased OEF in cognitively impaired patients in WM (p = 0.026) and HPC (p=0.011), but not in cognitively intact (Fig. 1A and 1B and Fig. 2). Older age was associated with decreased OEF in cognitively intact in CGM (p=0.021) (Fig. 3). In addition, cognitively impaired elderly had higher OEF than cognitively intact elderly in CGM, 24.5±4.9% vs. 20.2±5.6% (p<0.001), not in WM, 27.2±5.5% vs. 27.6±5.7% (p=0.60) and HPC 21.8±4.1% vs. 22.8±4.9% (p=0.97).Discussion
Our study demonstrated the QQ-based OEF mapping can be used to investigate metabolic dysfunction underlying dementia. In cognitively impaired elderly, WMH burden was associated with decreased OEF in white matter and hippocampus, but not in cognitively intact elderly (Fig. 2), consistent with decreased tissue oxygenation with increasing WMH burden in WM27. Based on the WMH association with AD pathology in cognitive impaired subjects28, our cognitively impaired group likely already had underlying AD pathology. Negative associations between age and OEF in cognitively intact elderly (Fig. 3) agree with PET studies reporting decreased OEF in neocortices with increasing age2, 3. Lack of association of age with OEF in our cognitively impaired group may suggest that, once cognitive impairment is present, age-related effects are overshadowed by disease-related detrimental effects on brain oxygen utilization from beta-amyloid plaques and phosphorylated tau on mitochondria29, 30.Higher cortical gray matter OEF in cognitively impaired elderly than cognitively intact suggests that our cognitively impaired cohort may be early in their disease course, consistent with the compensatory increase in metabolism reported on FDG-PET in early AD31-35 related to decreased blood flow36-38. As AD progresses, OEF likely decrease, as compensatory mechanisms fail and neurodegeneration leads to impaired oxygen metabolism.
Conclusion
This study demonstrated the feasibility of QQ-based OEF mapping to study oxygen metabolism in cognitively impaired elderly. In cognitively impaired elderly, WMH burden is associated with decreased OEF in the presence of cognitive impairment. The challenge free OEF mapping may be readily used to study important metabolic changes over various stages of AD.Acknowledgements
1. Hale JM, Schneider DC, Gampe J, et al. Trends in the Risk of Cognitive Impairment in the United States, 1996-2014. Epidemiology 2020; 31: 745-754. 2020/08/03. DOI: 10.1097/EDE.0000000000001219.
2. Eustache F, Rioux P, Desgranges B, et al. Healthy aging, memory subsystems and regional cerebral oxygen consumption. Neuropsychologia 1995; 33: 867-887. 1995/07/01. DOI: 10.1016/0028-3932(95)00021-t.
3. Yamaguchi T, Kanno I, Uemura K, et al. Reduction in regional cerebral metabolic rate of oxygen during human aging. Stroke 1986; 17: 1220-1228. 1986/11/01. DOI: 10.1161/01.str.17.6.1220.
4. Marchal G, Rioux P, Petit-Taboue MC, et al. Regional cerebral oxygen consumption, blood flow, and blood volume in healthy human aging. Arch Neurol 1992; 49: 1013-1020. 1992/10/01. DOI: 10.1001/archneur.1992.00530340029014.
5. Cho J, Kee Y, Spincemaille P, et al. Cerebral metabolic rate of oxygen (CMRO2 ) mapping by combining quantitative susceptibility mapping (QSM) and quantitative blood oxygenation level-dependent imaging (qBOLD). Magn Reson Med 2018; 80: 1595-1604. 2018/03/09. DOI: 10.1002/mrm.27135.
6. Cho J, Zhang S, Kee Y, et al. Cluster analysis of time evolution (CAT) for quantitative susceptibility mapping (QSM) and quantitative blood oxygen level-dependent magnitude (qBOLD)-based oxygen extraction fraction (OEF) and cerebral metabolic rate of oxygen (CMRO2 ) mapping. Magn Reson Med 2020; 83: 844-857. 2019/09/11. DOI: 10.1002/mrm.27967.
7. Cho J, Spincemaille P, Nguyen TD, et al. Temporal clustering, tissue composition, and total variation for mapping oxygen extraction fraction using QSM and quantitative BOLD. Magn Reson Med 2021; 86: 2635-2646. 2021/06/11. DOI: 10.1002/mrm.28875.
8. Cho J, Lee J, An H, et al. Cerebral oxygen extraction fraction (OEF): Comparison of challenge-free gradient echo QSM+qBOLD (QQ) with (15)O PET in healthy adults. J Cereb Blood Flow Metab 2021; 41: 1658-1668. 2020/11/28. DOI: 10.1177/0271678X20973951.
9. Kudo K, Liu T, Murakami T, et al. Oxygen extraction fraction measurement using quantitative susceptibility mapping: Comparison with positron emission tomography. J Cereb Blood Flow Metab 2016; 36: 1424-1433. DOI:
10.1177/0271678X15606713. 10. Wu D, Zhou Y, Cho J, et al. The Spatiotemporal Evolution of MRI-Derived Oxygen Extraction Fraction and Perfusion in Ischemic Stroke. Front Neurosci 2021; 15: 716031. 2021/09/07. DOI: 10.3389/fnins.2021.716031.
11. Zhang S, Cho J, Nguyen TD, et al. Initial Experience of Challenge-Free MRI-Based Oxygen Extraction Fraction Mapping of Ischemic Stroke at Various Stages: Comparison With Perfusion and Diffusion Mapping. Front Neurosci 2020; 14: 535441. 2020/10/13. DOI: 10.3389/fnins.2020.535441.
12. Cho J, Nguyen TD, Huang W, et al. Brain oxygen extraction fraction mapping in patients with multiple sclerosis. J Cereb Blood Flow Metab 2021: 271678X211048031. 2021/09/25. DOI: 10.1177/0271678X211048031.
13. Shen N, Zhang S, Cho J, et al. Application of Cluster Analysis of Time Evolution for Magnetic Resonance Imaging -Derived Oxygen Extraction Fraction Mapping: A Promising Strategy for the Genetic Profile Prediction and Grading of Glioma. Frontiers in Neuroscience 2021; 15. Original Research. DOI: 10.3389/fnins.2021.736891.
14. van der Flier WM and Scheltens P. Epidemiology and risk factors of dementia. J Neurol Neurosurg Psychiatry 2005; 76 Suppl 5: v2-7. 2005/11/18. DOI: 10.1136/jnnp.2005.082867.
15. Prins ND, van Dijk EJ, den Heijer T, et al. Cerebral white matter lesions and the risk of dementia. Arch Neurol 2004; 61: 1531-1534. 2004/10/13. DOI: 10.1001/archneur.61.10.1531.
16. Liu Z, Spincemaille P, Yao Y, et al. MEDI+0: Morphology enabled dipole inversion with automatic uniform cerebrospinal fluid zero reference for quantitative susceptibility mapping. Magn Reson Med 2018; 79: 2795-2803. 2017/10/13. DOI: 10.1002/mrm.26946.
17. Zhang J, Cho J, Zhou D, et al. Quantitative susceptibility mapping-based cerebral metabolic rate of oxygen mapping with minimum local variance. Magn Reson Med 2018; 79: 172-179. 2017/03/16. DOI: 10.1002/mrm.26657.
18. Zhang J, Zhou D, Nguyen TD, et al. Cerebral metabolic rate of oxygen (CMRO2 ) mapping with hyperventilation challenge using quantitative susceptibility mapping (QSM). Magn Reson Med 2017; 77: 1762-1773. 2016/04/28. DOI: 10.1002/mrm.26253.
19. Zhang J, Liu T, Gupta A, et al. Quantitative mapping of cerebral metabolic rate of oxygen (CMRO2 ) using quantitative susceptibility mapping (QSM). Magn Reson Med 2015; 74: 945-952. 2014/09/30. DOI: 10.1002/mrm.25463.
20. Ulrich X and Yablonskiy DA. Separation of cellular and BOLD contributions to T2* signal relaxation. Magn Reson Med 2016; 75: 606-615. 2015/03/11. DOI: 10.1002/mrm.25610.
21. He X, Zhu M and Yablonskiy DA. Validation of oxygen extraction fraction measurement by qBOLD technique. Magn Reson Med 2008; 60: 882-888. 2008/09/26. DOI: 10.1002/mrm.21719.
22. Yablonskiy DA, Sukstanskii AL and He X. Blood oxygenation level-dependent (BOLD)-based techniques for the quantification of brain hemodynamic and metabolic properties - theoretical models and experimental approaches. NMR Biomed 2013; 26: 963-986. 2012/08/29. DOI: 10.1002/nbm.2839.
23. Fischl B, Salat DH, Busa E, et al. Whole brain segmentation: automated labeling of neuroanatomical structures in the human brain. Neuron 2002; 33: 341-355. 2002/02/08. DOI: 10.1016/s0896-6273(02)00569-x.
24. Ayton S, Fazlollahi A, Bourgeat P, et al. Cerebral quantitative susceptibility mapping predicts amyloid-beta-related cognitive decline. Brain 2017; 140: 2112-2119. 2017/09/14. DOI: 10.1093/brain/awx137.
25. Kim HG, Park S, Rhee HY, et al. Quantitative susceptibility mapping to evaluate the early stage of Alzheimer's disease. Neuroimage Clin 2017; 16: 429-438. 2017/09/08. DOI: 10.1016/j.nicl.2017.08.019.
26. Zhang H, Zhang, J., Wang, R., Zhang, Q., Spincemaille, P., Nguyen, T.D., Wang, Y. Efficient Folded Attention for Medical Image Reconstruction and Segmentation. Proceedings of the AAAI Conference on Artificial Intelligence 2021; 35: 10868-10876.
27. Dalby RB, Eskildsen SF, Videbech P, et al. Oxygenation differs among white matter hyperintensities, intersected fiber tracts and unaffected white matter. Brain Commun 2019; 1: fcz033. 2020/09/22. DOI: 10.1093/braincomms/fcz033.
28. Arfanakis K, Evia AM, Leurgans SE, et al. Neuropathologic Correlates of White Matter Hyperintensities in a Community-Based Cohort of Older Adults. J Alzheimers Dis 2020; 73: 333-345. 2019/11/28. DOI: 10.3233/JAD-190687.
29. Chen JX and Yan SD. Amyloid-beta-induced mitochondrial dysfunction. J Alzheimers Dis 2007; 12: 177-184. 2007/10/06. DOI: 10.3233/jad-2007-12208.
30. Kandimalla R, Manczak M, Fry D, et al. Reduced dynamin-related protein 1 protects against phosphorylated Tau-induced mitochondrial dysfunction and synaptic damage in Alzheimer's disease. Hum Mol Genet 2016; 25: 4881-4897. 2017/02/09. DOI: 10.1093/hmg/ddw312.
31. Rubinski A, Franzmeier N, Neitzel J, et al. FDG-PET hypermetabolism is associated with higher tau-PET in mild cognitive impairment at low amyloid-PET levels. Alzheimers Res Ther 2020; 12: 133. 2020/10/21. DOI: 10.1186/s13195-020-00702-6.
32. Oh H, Habeck C, Madison C, et al. Covarying alterations in Abeta deposition, glucose metabolism, and gray matter volume in cognitively normal elderly. Hum Brain Mapp 2014; 35: 297-308. 2012/09/12. DOI: 10.1002/hbm.22173.
33. Merlo S, Spampinato SF and Sortino MA. Early compensatory responses against neuronal injury: A new therapeutic window of opportunity for Alzheimer's Disease? CNS Neurosci Ther 2019; 25: 5-13. 2018/08/14. DOI: 10.1111/cns.13050.
34. Ashraf A, Fan Z, Brooks DJ, et al. Cortical hypermetabolism in MCI subjects: a compensatory mechanism? Eur J Nucl Med Mol Imaging 2015; 42: 447-458. 2014/10/01. DOI: 10.1007/s00259-014-2919-z.
35. Willette AA, Modanlo N, Kapogiannis D, et al. Insulin resistance predicts medial temporal hypermetabolism in mild cognitive impairment conversion to Alzheimer disease. Diabetes 2015; 64: 1933-1940. 2015/01/13. DOI: 10.2337/db14-1507.
36. Peng SL, Dumas JA, Park DC, et al. Age-related increase of resting metabolic rate in the human brain. Neuroimage 2014; 98: 176-183. 2014/05/13. DOI: 10.1016/j.neuroimage.2014.04.078.
37. Ostergaard L. Blood flow, capillary transit times, and tissue oxygenation: the centennial of capillary recruitment. J Appl Physiol (1985) 2020; 129: 1413-1421. 2020/10/09. DOI: 10.1152/japplphysiol.00537.2020.
38. Nielsen RB, Parbo P, Ismail R, et al. Impaired perfusion and capillary dysfunction in prodromal Alzheimer's disease. Alzheimers Dement (Amst) 2020; 12: e12032. 2020/06/04. DOI: 10.1002/dad2.12032.
References
No reference found.Figures