2270
Evaluating iron overload in Nigrosome 1 via Quantitative Susceptibility Mapping at 7T in prodromal stages of Parkinson’s disease1IRCCS Stella Maris, Pisa, Italy, 2Imago7 Research Foundation, Pisa, Italy, 3Neuroradiology Unit, Azienda Ospedaliero-Universitaria Pisana, Pisa, Italy, 4Neurology Unit, Department of Clinical and Experimental Medicine, University of Pisa, Pisa, Italy, 5Department of Neuroscience, Rehabilitation, Ophthalmology, Genetics, Maternal and Child Sciences (DINOGMI), University of Genoa, Genoa, Italy, 6Neuroradiology Unit, Department of Translational Research on New Technologies in Medicine and Surgery, University of Pisa, Pisa, Italy, 7Neurology Unit, Sant'Andrea Hospital, La Spezia, Italy, 8IRCCS Ospedale Policlinico San Martino, Genoa, Italy, 9Unit of Sleep Medicine and Epilepsy, IRCCS Mondino Foundation, Pavia, Italy, 10Department of Brain and Behavioral Sciences, University of Pavia, Pavia, Italy, 11Parkinson's Disease and Movement Disorders Unit, IRCCS Mondino Foundation, Pavia, Italy, 12Clinica Neurologica Rete Metropolitana, IRCCS Istituto Scienze Neurologiche Bologna, Bologna, Italy, 13Department of Biomedical and Neuromotor Sciences (DIBINEM), University of Bologna, Bologna, Italy
Synopsis
iRBD is a prodromal stage of α-synucleinopathies, like PD. Iron deposition is increased in the substantia nigra of PD patients, mainly in Nigrosome-1 (N1). Here, we estimated N1 iron content in PD, iRBD patients and healthy controls using QSM at 7T to investigate group differences and correlation with disease duration. PD patients showed increased N1 susceptibility compared to controls and iRBD patients but no correlation with disease duration. N1 susceptibility in iRBD patients was not different from controls but correlated with disease duration. Hence, in prodromal stages of α-synucleinopathies, QSM can reveal progressive N1 iron accumulation as the disease evolves.
Introduction
Idiopathic rapid eye movement (REM) behavioral disorder (iRBD) is a prodromal stage of α-synucleinopathies, such as Parkinson’s disease (PD), which are characterized by the loss of dopaminergic neurons in substantia nigra (SN), especially in the Nigrosome 1 (N1), associated with abnormal iron load. Iron deposition in SN has been suggested to contribute to the degeneration of dopaminergic neurons and its assessment in iRBD patients may provide further insight into the relationship between iron accumulation and disease development. Iron-related signal changes in SN have been reported in most PD patients1,2 and Quantitative Susceptibility Mapping (QSM) revealed altered susceptibility (𝜒) in PD patients in the whole SN3–7, in its pars compacta (SNc)8–10 and reticulata (SNr)8,9. In iRBD patients, instead, QSM studies on the whole SN7,11,12 or in its functional subregions13 showed conflicting results. In this work, we directly targeted N1 and estimated iron content in PD, iRBD patients and healthy controls (HC) using QSM performed at 7T in order to investigate differences between groups and the correlation with disease duration.Methods
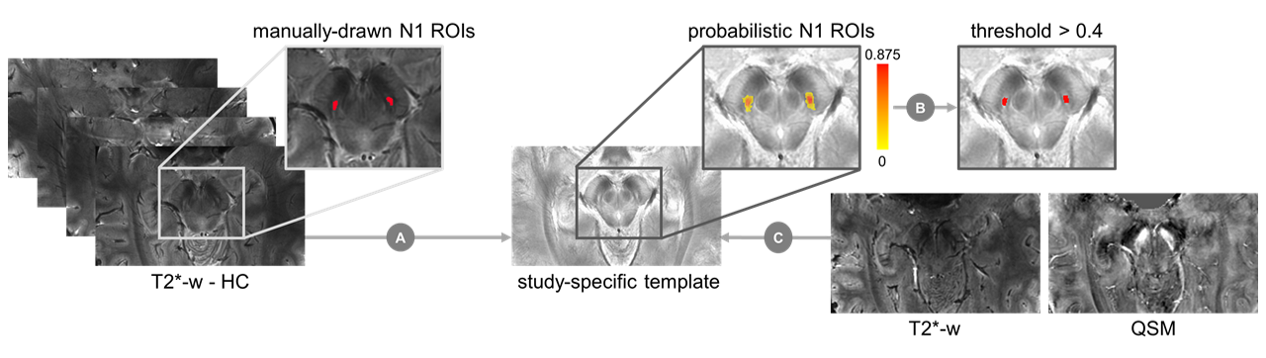
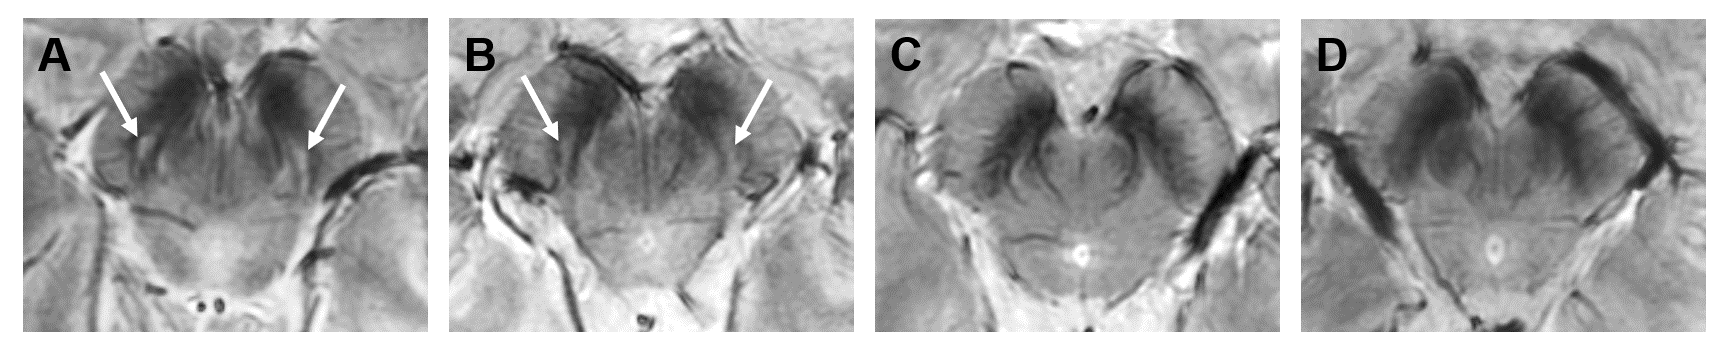
We included 43 PD patients in early stages (ePD; disease duration<4 years), 30 iRBD patients and 14 HCs. A 3D Gradient-Recalled Multi-Echo sequence was acquired on a 7T MRI scanner (GE-MR950) with the following parameters: TR=54.1ms; TE1:ΔTE:TE7=5.6:6.0:41.8ms; voxel size=0.6×0.6×0.6mm3. Susceptibility maps were computed from the phase signal of each echo using a Laplacian-based phase unwrapping algorithm14, V-SHARP background field removal15 and iLSQR algorithm for dipole deconvolution16 (available in STI Suite), and then averaged across TEs. A study-specific template was created via ANTs using the magnitude image averaged across TEs of HCs. As N1 may not be clearly visible in patients, N1 ROIs were manually drawn on the magnitude images of HCs, warped onto the template and averaged together to obtain probabilistic N1 ROIs, then thresholded to a probability of 0.4 (Figure 1). Susceptibility maps of patients and HCs were then warped to the template space. For each subject, we considered the N1 (left or right) showing the highest mean 𝜒 for statistical analysis, according to radiological criteria2. Magnitude images were examined by a radiologist to assess the appearance of the trilaminar organization of SN2 and the presence of an oval-shaped hyperintensity located dorsolaterally in the SN between two hypointense layers, corresponding to N1. Sex distribution of the populations (ePD, iRBD and HC) were compared using chi-square test. Age and QSM data were analyzed via Kruskal-Wallis omnibus tests, post-hoc Dunn’s test and Dunn-Sidak correction. Diagnostic accuracy was assessed via the area under the curve (AUC) of the receiver operating characteristic (ROC). The correlation between 𝜒 and disease duration since the onset of symptoms was evaluated with the Spearman rank correlation test.Results
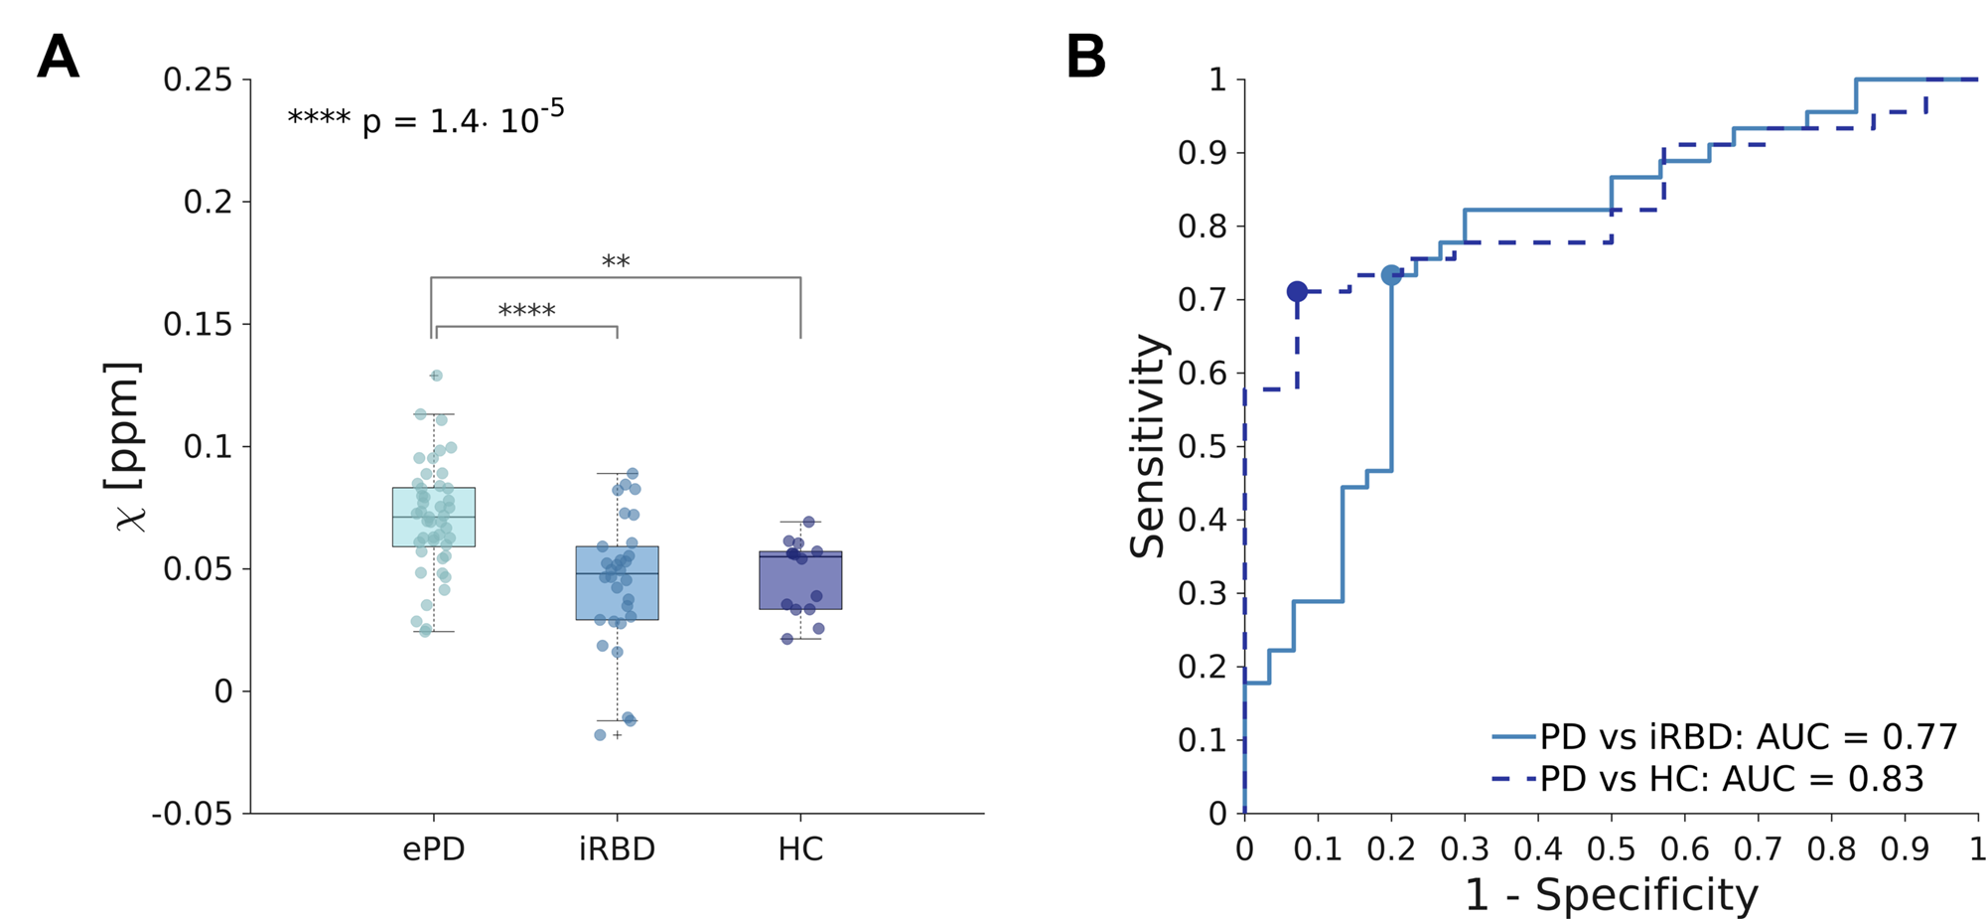
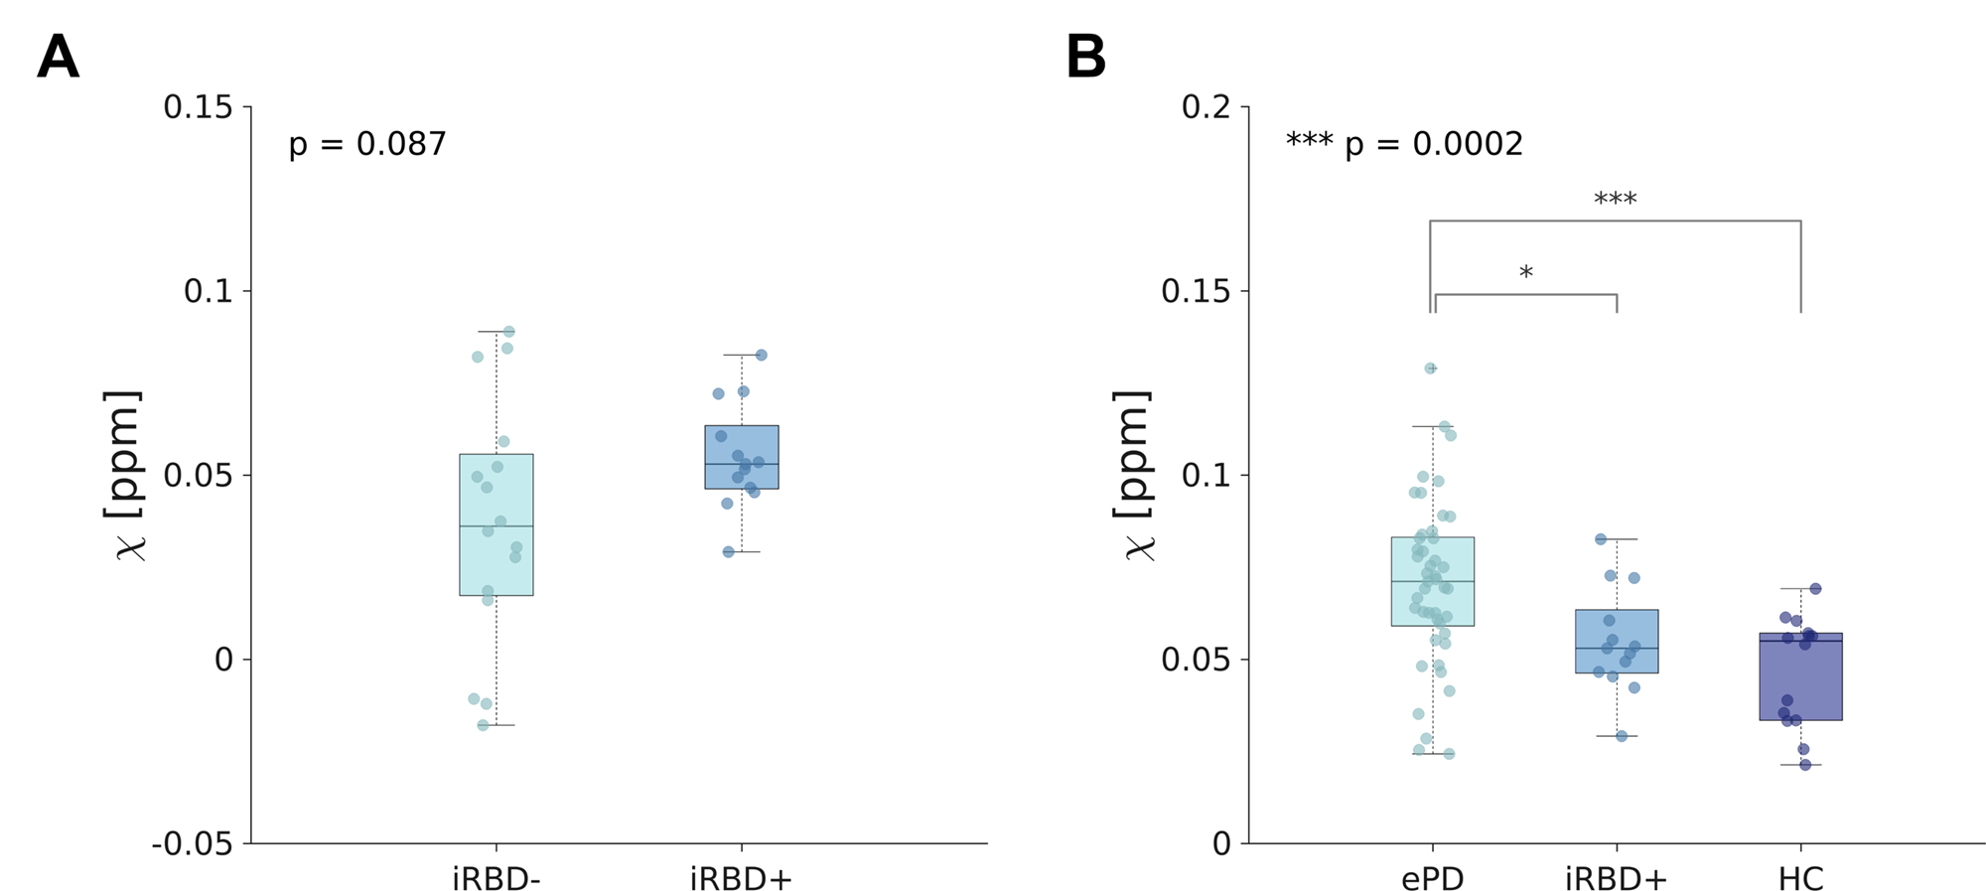
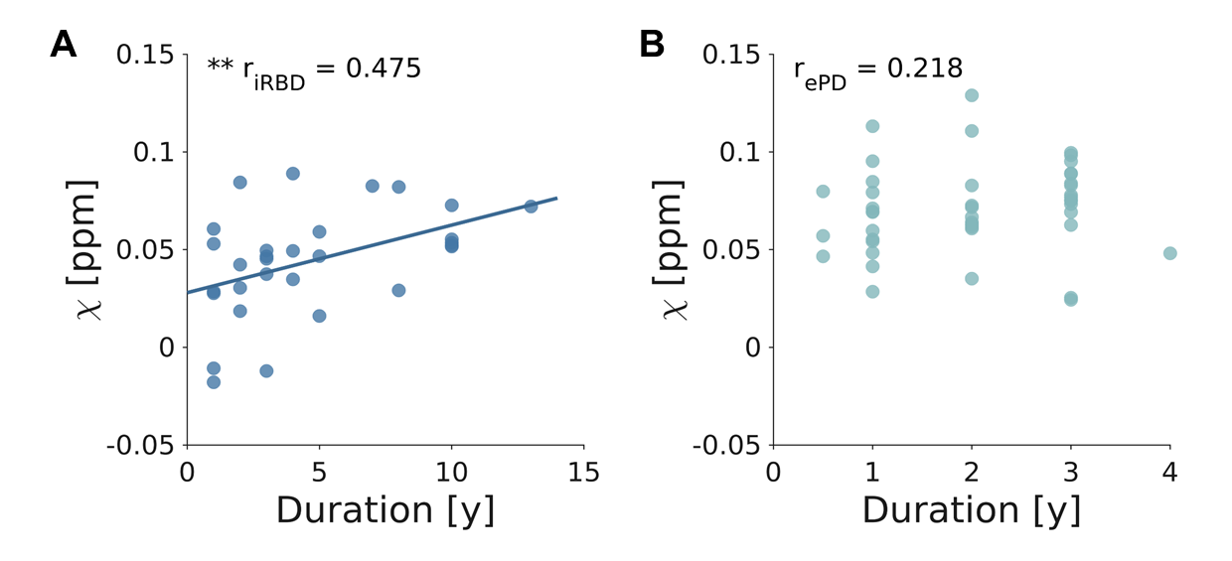
We found no significant differences in sex distribution between groups. Age differences were significant (p<0.05) but no significant correlation was found between age and N1 susceptibility. The appearance of N1 was labeled as pathological in 86% and 45% of ePD and iRBD patients, respectively (Figure 2). The omnibus test revealed significant differences in N1 𝜒 between ePD, iRBD and HC (p<0.0001): ePD patients showed increased 𝜒 with respect to both HC (p<0.01) and iRBD patients (p<0.0001) (Figure 3A). The AUC obtained in discriminating ePD from iRBD patients was 0.77 (specificity=0.80, sensitivity=0.73). Moreover, PD and HC could be discriminated with an AUC of 0.83, (specificity=0.93, sensitivity=0.71) (Figure 3B). Though not significantly, iRBD patients with abnormal N1 appearance (iRBD+) had slightly higher QSM values than others (iRBD-), leading to a smaller difference with the ePD group (p<0.05) (Figure 4). Positive correlation (r=0.475; p<0.01) emerged between susceptibility in N1 and disease duration in iRBD patients, but no significant correlation was found for ePD patients (Figure 5).Discussion
Iron concentration in N1 was higher for ePD patients than for HC, in agreement with previous studies investigating susceptibility in SNc3,8–10,17. The accumulation of iron in N1 in the iRBD group is comparable to that in HC, in accordance with previous studies that considered average QSM values in the whole SN7,11,12 or in its functional subregions13. However, another study reported higher SN 𝜒 in iRBD patients compared to HC, but lower than ePD7. These slightly inconsistent results could be accounted for by the different degree of nigral pathology in iRBD patients enrolled in each study and the different portion of SN considered. The correlation between N1 𝜒 and duration of iRBD indicates that iron accumulation increases along with disease evolution. No correlation was found between ePD duration and N1 susceptibility, so it can be assumed that further iron accumulation is not significant once motor symptoms appear, at least in the first stages of the disease.Conclusion
Our work suggests the potential of N1 iron load detection via QSM as a biomarker for the assessment of PD and of ongoing neurodegeneration in its prodromal stages, such as iRBD.Acknowledgements
This study was supported by Ricerca Finalizzata RF-2013-02354829 “Seven Tesla MR imaging as a preclinical biomarker in populations at risk for Parkinson’s disease” funded by the Italian Ministry of Health and the Tuscany Region. This work has been partially supported also by grants “RC 2018-2020” and “5 per mille” to IRCCS Fondazione Stella Maris, funded by the Italian Ministry of Health.References
1. Blazejewska AI, Schwarz ST, Pitiot A, et al. Visualization of nigrosome 1 and its loss in PD: Pathoanatomical correlation and in vivo 7 T MRI. Neurology. 2013;81(6):534-540. doi:10.1212/WNL.0b013e31829e6fd2
2. Cosottini M, Frosini D, Pesaresi I, et al. MR imaging of the substantia nigra at 7 T enables diagnosis of parkinson disease. Radiology. 2014;271(3):831-838. doi:10.1148/radiol.14131448
3. Barbosa JHO, Santos AC, Tumas V, et al. Quantifying brain iron deposition in patients with Parkinson’s disease using quantitative susceptibility mapping, R2 and R2*. Magn Reson Imaging. 2015;33(5):559-565. doi:10.1016/j.mri.2015.02.021
4. Langkammer C, Pirpamer L, Seiler S, et al. Quantitative Susceptibility Mapping in Parkinson’s Disease. Kassubek J, ed. PLoS One. 2016;11(9):e0162460. doi:10.1371/journal.pone.0162460
5. Murakami Y, Kakeda S, Watanabe K, et al. Usefulness of quantitative susceptibility mapping for the diagnosis of Parkinson disease. Am J Neuroradiol. 2015;36(6):1102-1108. doi:10.3174/ajnr.A4260
6. An H, Zeng X, Niu T, et al. Quantifying iron deposition within the substantia nigra of Parkinson’s disease by quantitative susceptibility mapping. J Neurol Sci. 2018;386:46-52. doi:10.1016/j.jns.2018.01.008
7. Sun J, Lai Z, Ma J, et al. Quantitative Evaluation of Iron Content in Idiopathic Rapid Eye Movement Sleep Behavior Disorder. Mov Disord. 2020;35(3):478-485. doi:10.1002/mds.27929
8. Xuan M, Guan X, Gu Q, et al. Different iron deposition patterns in early- and middle-late-onset Parkinson’s disease. Park Relat Disord. 2017;44:23-27. doi:10.1016/j.parkreldis.2017.08.013
9. Du G, Lewis MM, Sica C, et al. Distinct progression pattern of susceptibility MRI in the substantia nigra of Parkinson’s patients. Mov Disord. 2018;33(9):1423-1431. doi:10.1002/mds.27318
10. Takahashi H, Watanabe Y, Tanaka H, et al. Comprehensive MRI quantification of the substantia nigra pars compacta in Parkinson’s disease. Eur J Radiol. 2018;109:48-56. doi:10.1016/j.ejrad.2018.06.024
11. Zhang X, Chai C, Ghassaban K, et al. Assessing brain iron and volume of subcortical nuclei in idiopathic rapid eye movement sleep behavior disorder. Sleep. Published online May 20, 2021. doi:10.1093/sleep/zsab131
12. Chen Q, Boeve BF, Forghanian‐Arani A, et al. MRI quantitative susceptibility mapping of the substantia nigra as an early biomarker for Lewy body disease. J Neuroimaging. Published online May 25, 2021:jon.12878. doi:10.1111/jon.12878
13. Biondetti E, Santin MD, Valabrègue R, et al. The spatiotemporal changes in dopamine, neuromelanin and iron characterizing Parkinson’s disease. Brain. 2021;144. doi:10.1093/brain/awab191/6274641
14. Li W, Avram A V, Wu B, Xiao X, Liu C. Integrated Laplacian-based phase unwrapping and background phase removal for quantitative susceptibility mapping. NMR Biomed. 2014;27(2):219-227. doi:10.1002/nbm.3056
15. Schweser F, Deistung A, Lehr BW, Reichenbach JR. Quantitative imaging of intrinsic magnetic tissue properties using MRI signal phase: an approach to in vivo brain iron metabolism? Neuroimage. 2011;54(4):2789-2807. doi:10.1016/j.neuroimage.2010.10.070
16. Li W, Wang N, Yu F, et al. A method for estimating and removing streaking artifacts in quantitative susceptibility mapping. Neuroimage. 2015;108:111-122. doi:10.1016/j.neuroimage.2014.12.043
17. Chen Q, Chen Y, Zhang Y, et al. Iron deposition in Parkinson’s disease by quantitative susceptibility mapping. BMC Neurosci. 2019;20(1):23. doi:10.1186/s12868-019-0505-9
Figures