2269
Thalamic volume and lateralization on Parkinson Disease associated with cognitive and motor deficits1Signal processing in neuroimaging, Basque Center on Cognition Brain and language, San Sebastian, Spain, 2Language and memory control, Basque Center on Cognition Brain and language, San Sebastian, Spain
Synopsis
This study sheds light on the relationship between the thalamic nuclei volume and their lateralization with cognitive and motor scores in PD. Two partial least squares analyses were performed between the volume or laterality indexes of all nuclei and clinical and cognitive scores. Cognitive deficits in semantic fluency and symbols and digits tests in PD are related to ventral, central and medial thalamic nuclei rather than to specific nuclei differences, except for the right-AV. Motor deterioration seems to be reflected in specific lateralization of the medial and pulvinar areas.
Introduction
Parkinson disease (PD) originates from the loss of dopaminergic neurons in the substantia nigra. The thalamus has vast dopamine neuromodulation with uneven distribution, calling for nuclei-specific information1. The classical model of the basal ganglia-cortical motor circuit in PD indicates that activity is relayed directly to the motor thalamus and then onto the cortex, assuming no significant thalamic modulation2. However, evidence on motor thalamic neurons dynamically altering information sent to cortical regions and the intralaminar parafascicular complex attention-related regulation to the whole striatum clearly supports an active role of the thalamus in PD3. This study sheds light on the relationship between the thalamic nuclei volume and their lateralization with cognitive and motor scores in PD.Methods
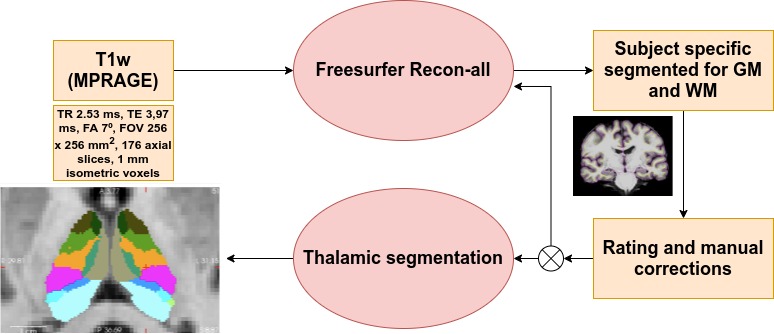
Participants were screened from the Parkinson Progressive Markers initiative4 based on the availability of a T1-weighted image obtained in a Siemens-Trio 3T MRI. PD patients with dementia or from specific genetic groups were disregarded. The initial study sample included 82 healthy controls (HC), 150 PD cognitively normal patients (PD-CN) and 34 PD patients with MCI (PD-MCI). T1-weighted images were segmented using FreeSurfer5. Two independent raters graded each subject’s segmentation and disagreement on ratings was discussed for each case. If necessary, images were manually corrected to minimize segmentation imperfections. Subjects with extreme motion, abnormal intracranial structures or signal dropout images were removed. 82 HC, 136 PD-CN and 29 PD-MCI subjects remained. Thalamic nuclei volumes were obtained using a probabilistic atlas of the human thalamus6 (20 nuclei per hemisphere) (Figure 1). The laterality index was computed as:LI=200(Volleft-VolRight)/(Volleft+Volright)
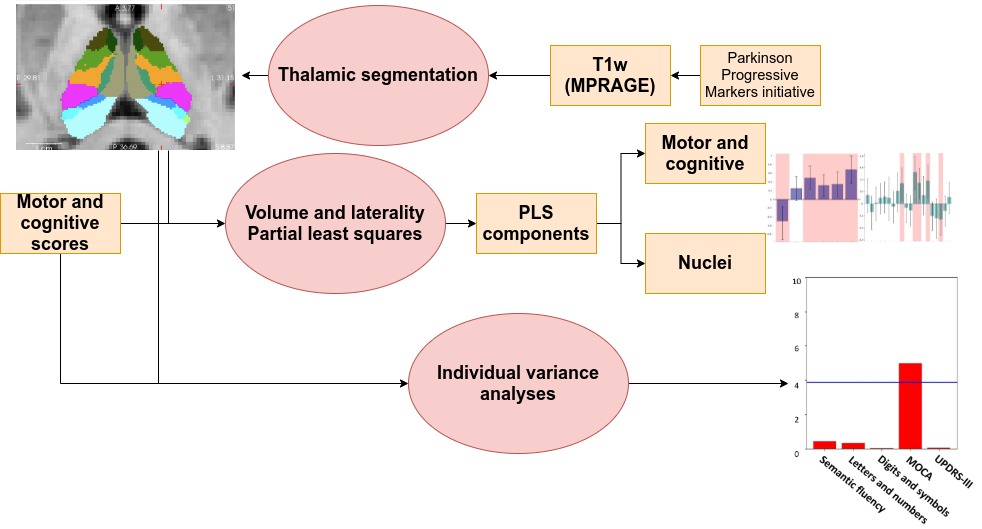
In Figure 2, Two partial least squares (PLS) analyses were performed between the volume (Volume-PLS) or laterality indexes (LI-PLS) of all nuclei and the following clinical and cognitive scores: disease duration, semantic fluency7, letters-numbers sequencing8, digit and symbols modalities (SDMT)9, Montreal Cognitive Assessment (MOCA) and Unified Parkinson Disease Rating Scale (UPDRS)-III motor tests. Age, total gray matter (TGM) and total intracranial volume (TIV) were regressed out from the scores prior to PLS10. In brief, PLS involves the singular value decomposition of the covariance matrix between the behavioral variables and the thalamic nuclei, resulting in latent components (LC). Each LC has a set of behavior and brain saliences, indicating how strongly each variable contributes to the brain-behavior covariance. Significance of each LC was determined by permutation testing (50000 iterations). Stability of saliences was obtained using bootstrapping (50000 iterations), selecting as stable those saliences whose 95% confidence interval did not include 0. Additionally, the relationship between each statistically-significant nuclei or LI and behavioural scores was interrogated via regression analysis considering age, TGM, TIV, and disease duration as nuisance covariates (p<0.05).
Results and discussion
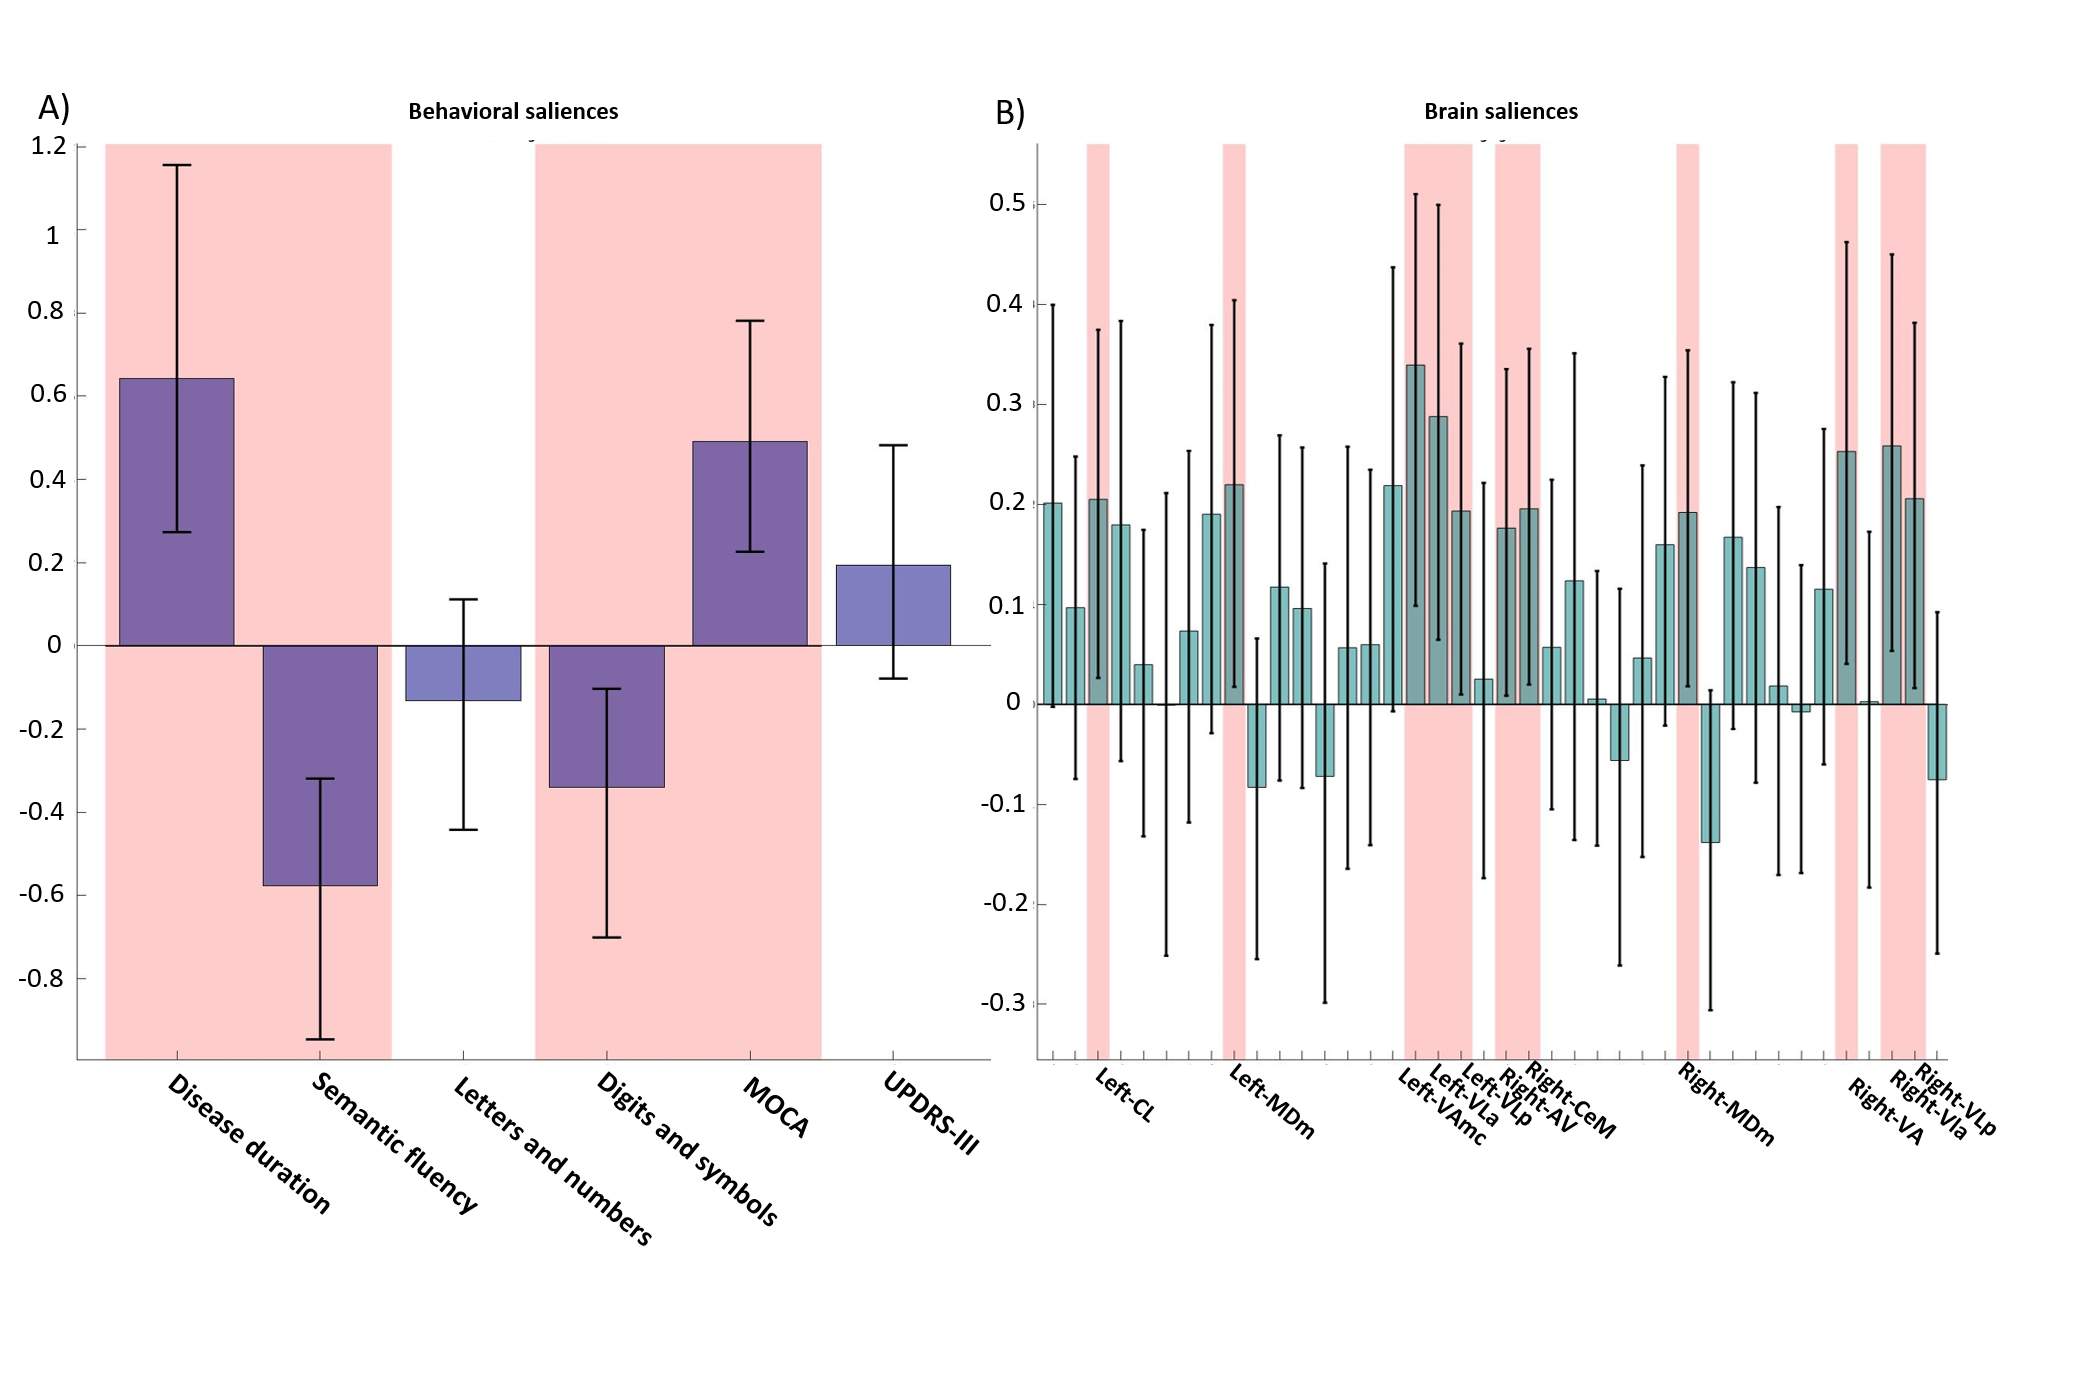
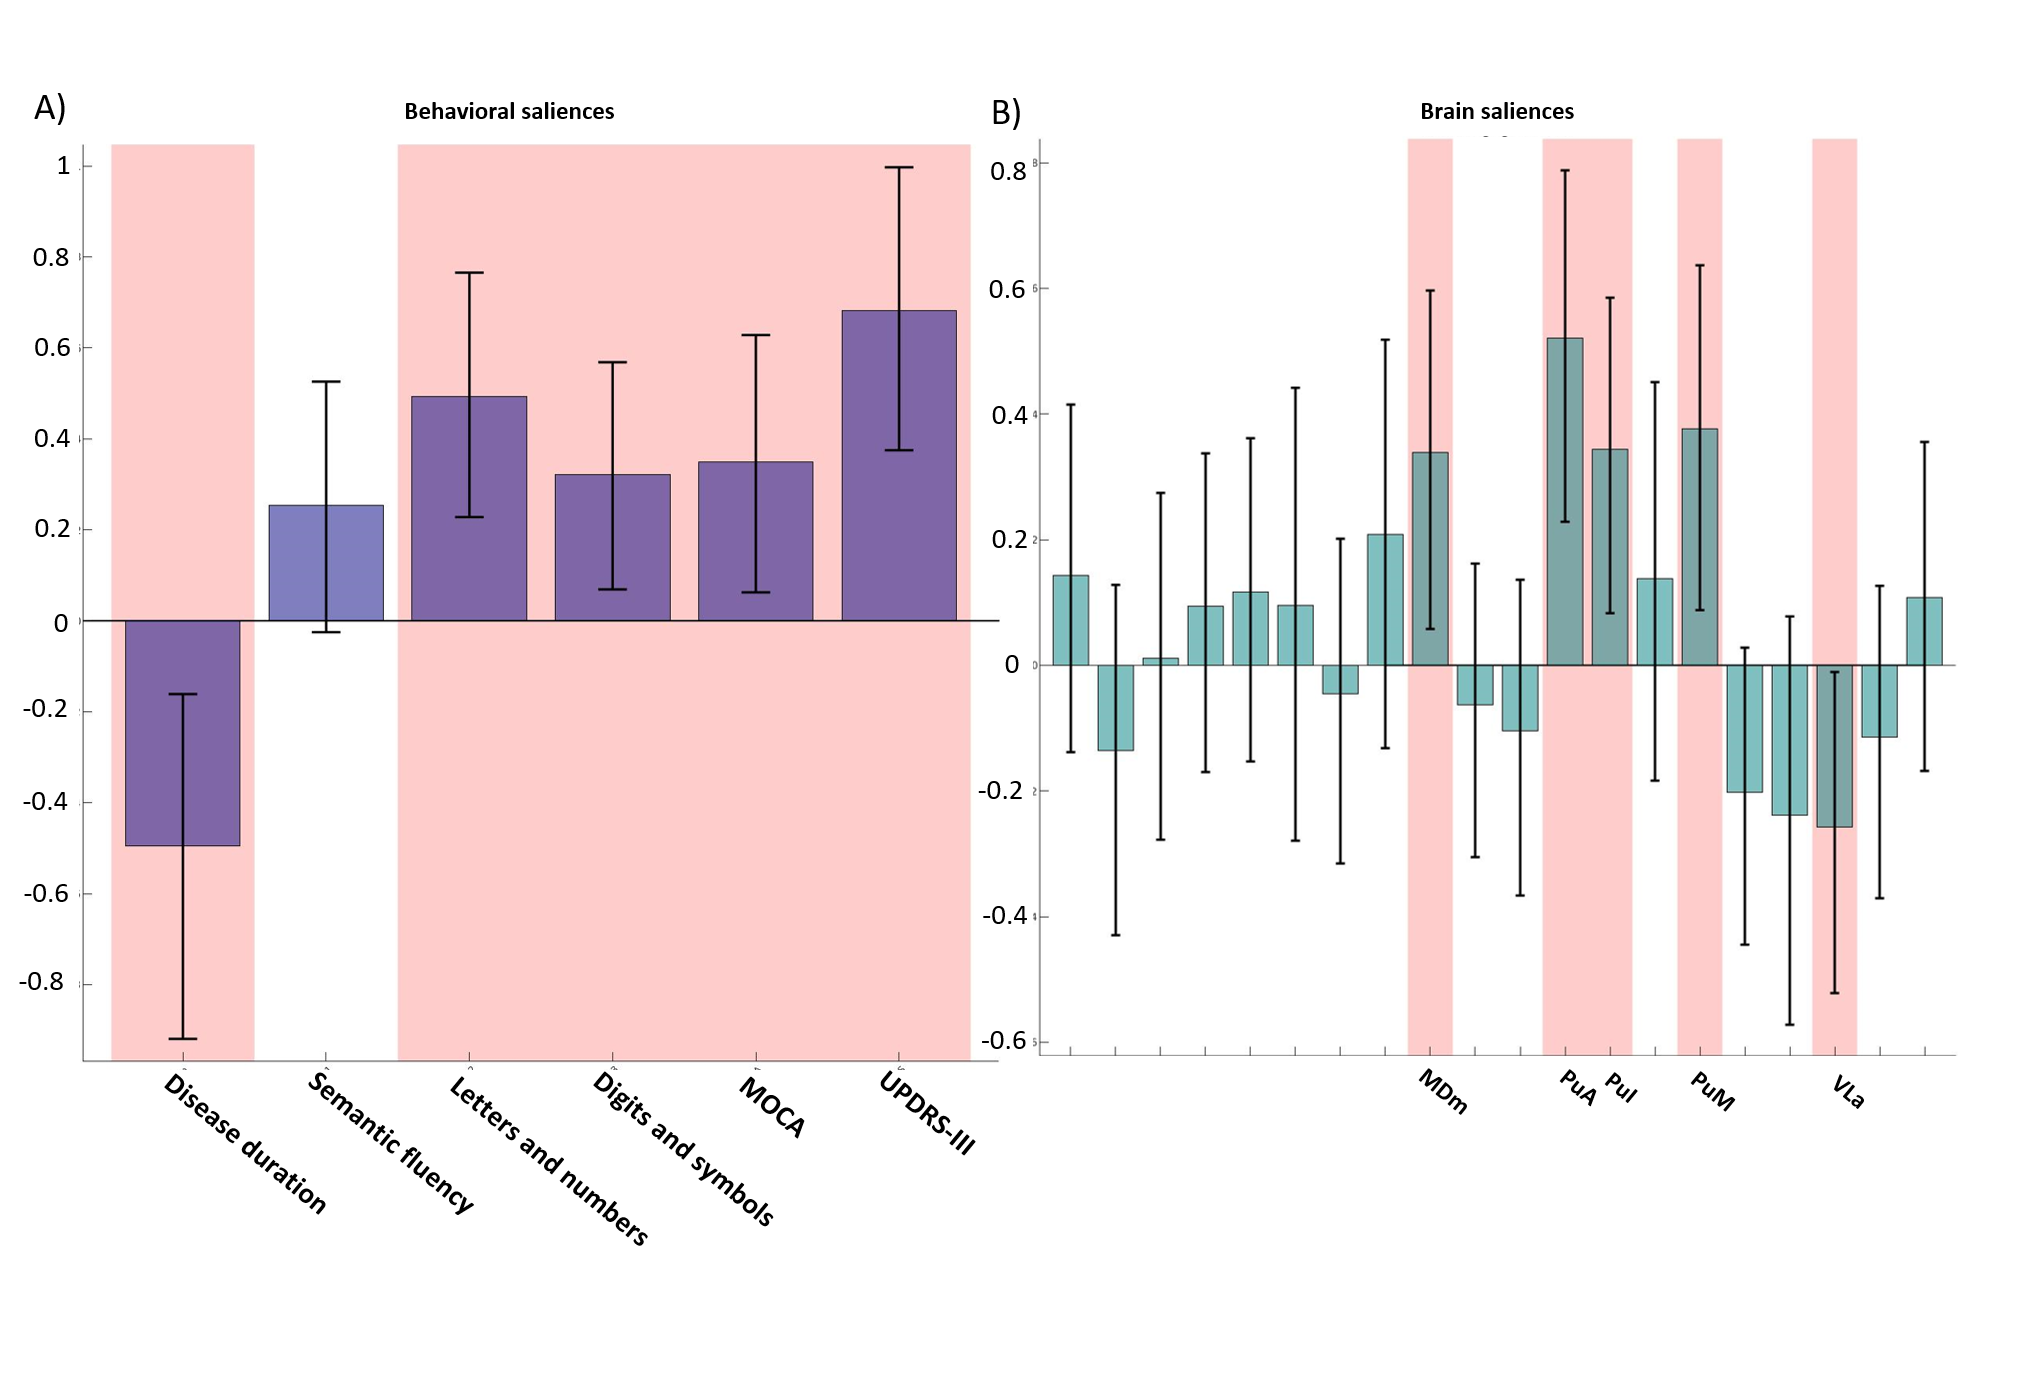
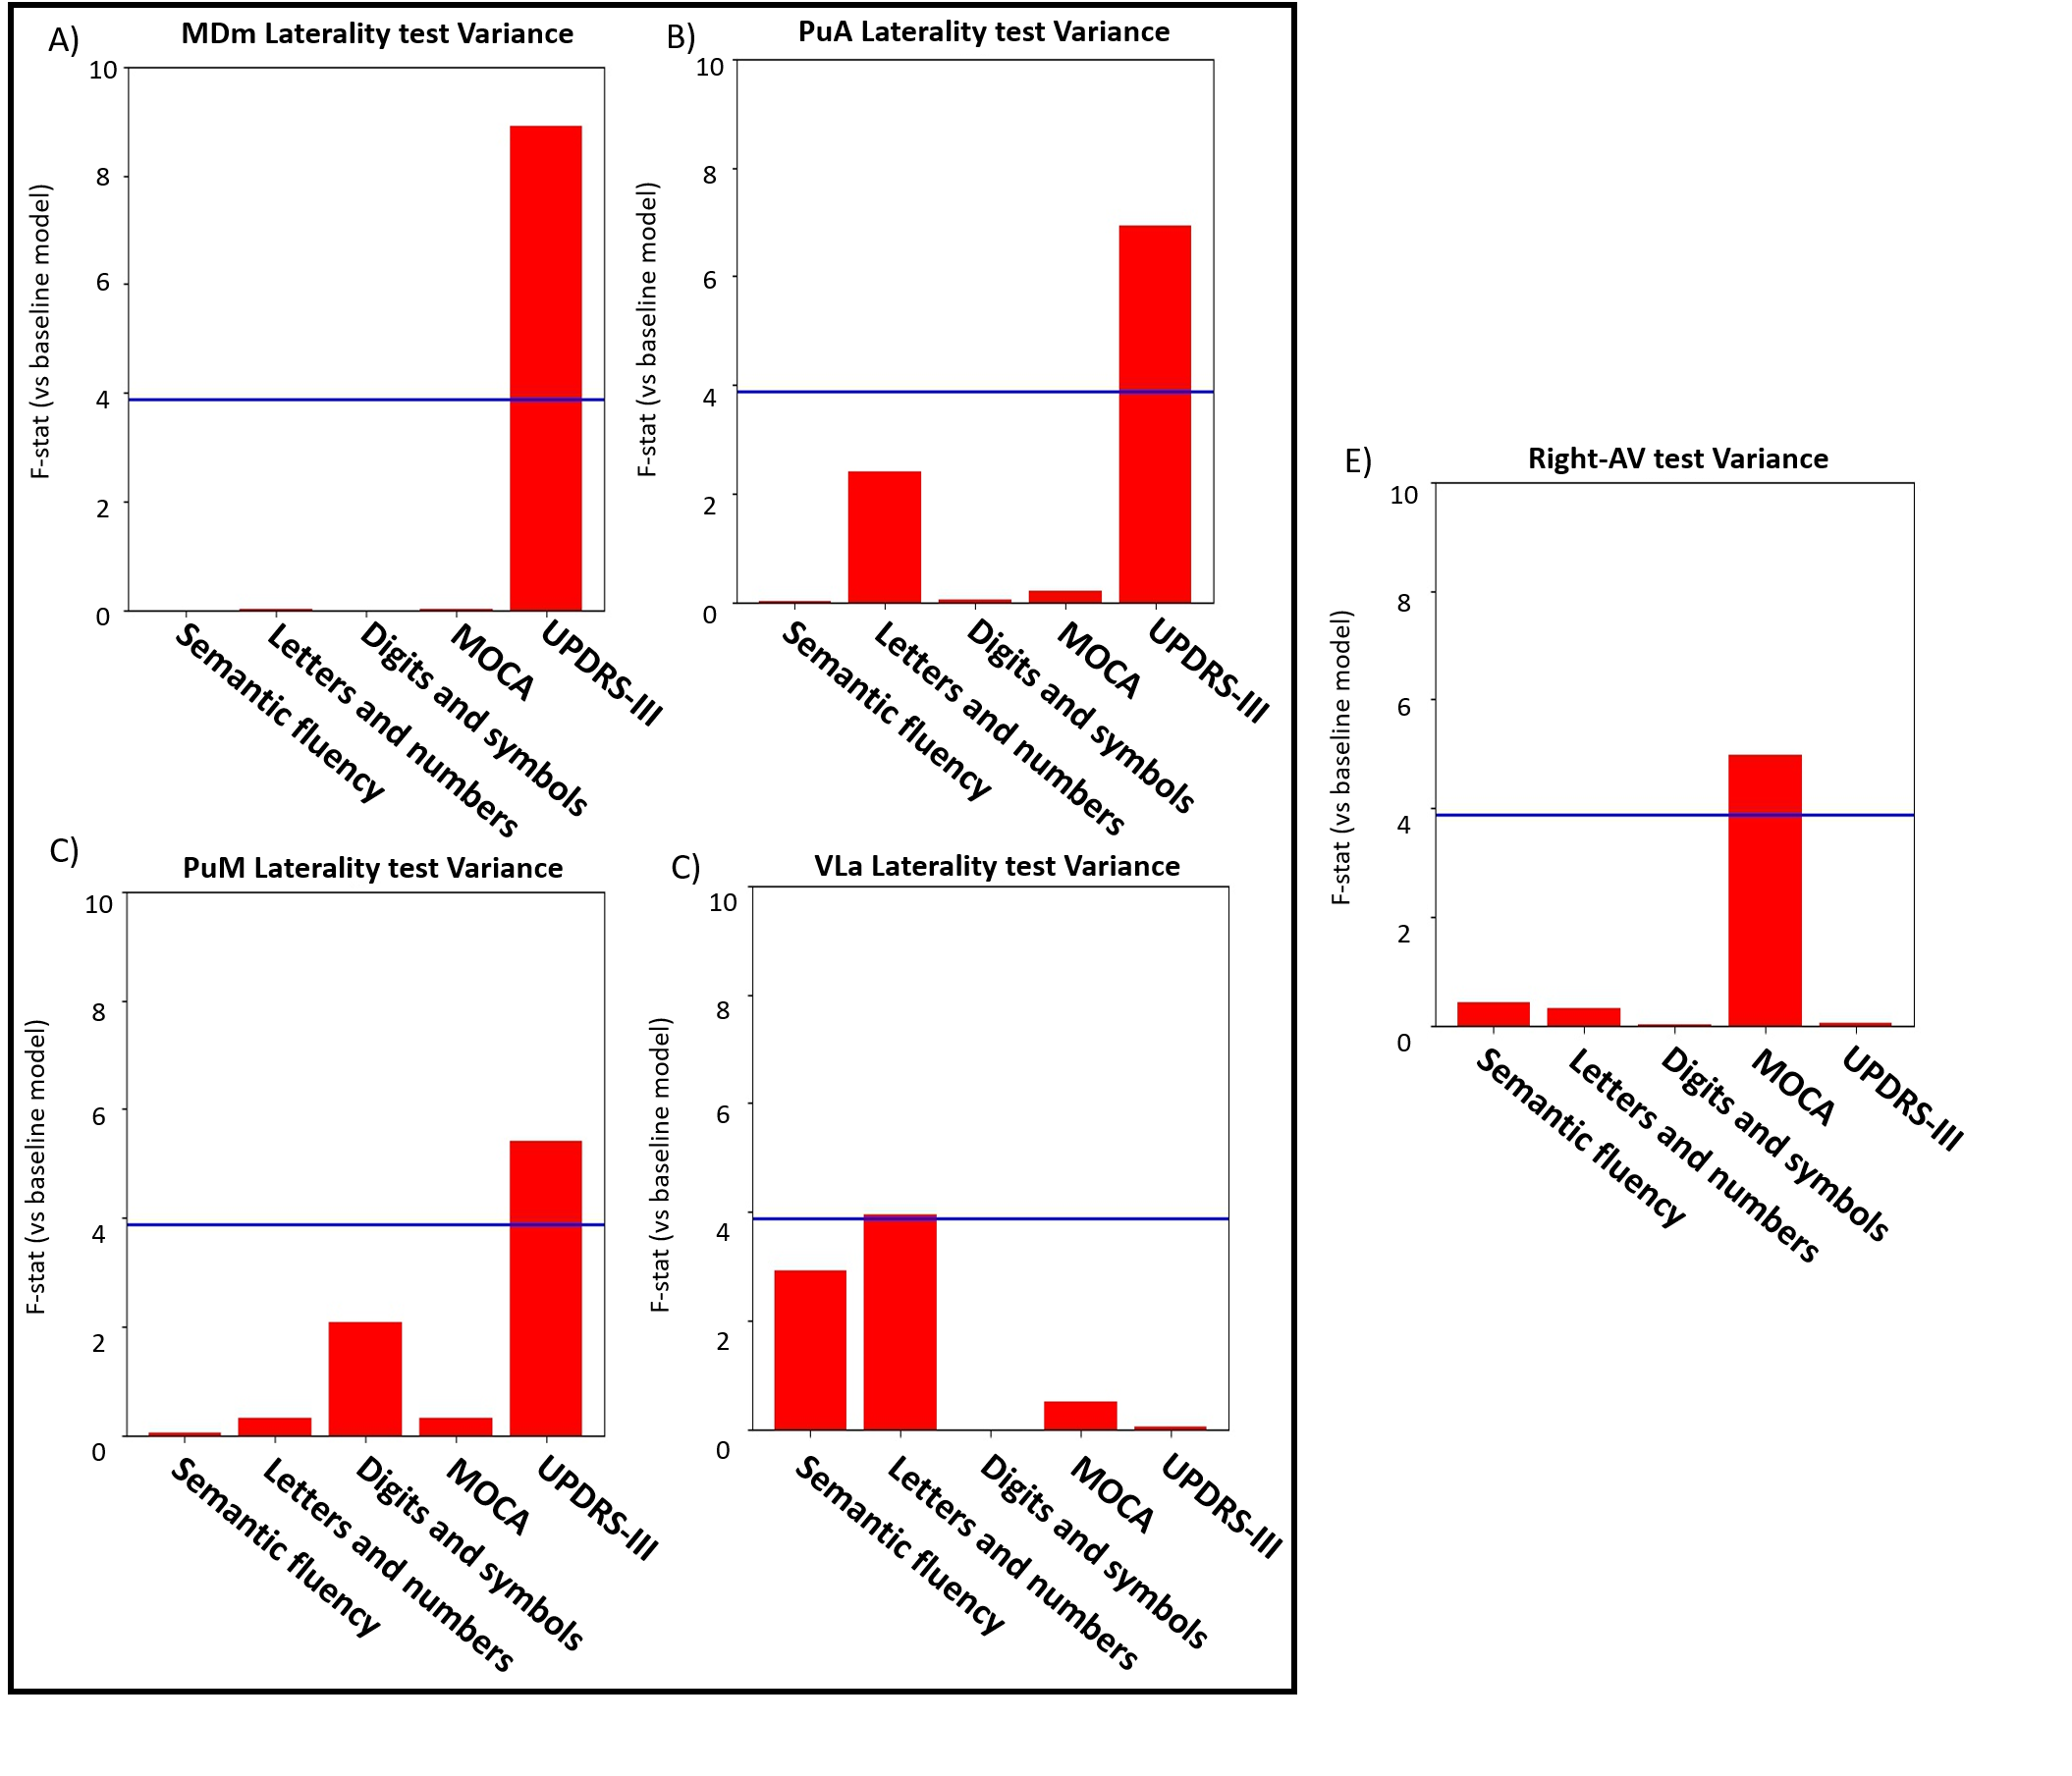
Both PLS analyses yielded one significant LC (Volume-PLS p-value: 0.008, LI-PLS p-value: 0.01). As shown in Figure 2, the Volume-PLS LC was driven by disease duration, semantic fluency, SDMT and MOCA test and by the left hemisphere central lateral (CL), mediodorsal medial magnocellular (MDm), ventral anterior magnocellular (VAmc), ventral lateral anterior (VLa) and posterior (VLp) nuclei and by the right hemisphere anteroventral (AV), central medial (CeM), Mdm, ventral anterior (VA), ventral lateral anterior (VLa) and posterior (VLp). Figure 3 shows that the LI-PLS LC was driven by disease duration, letters-numbers, SDMT, MOCA and UPDRS-motor behavioral variables and by the LI of the MDm, pulvinar anterior (PuA), pulvinar medial (PuM) and VLa. The individual regression analyses (Figure 4) revealed that only the MOCA test significantly contributed to the right-AV nucleus volume. As for the LI, the UPDRS-III motor test significantly explained the variance of the MDm, PuA and PuM nuclei, whereas the letters-numbers test explained the variance of the VLa nucleus. In sum, the Volume-PLS analysis underscored the multivariate nature of the covariance with multiple cognitive tests explaining a relatively low portion of the variance of the significant thalamic nuclei considering volume individually. In contrast, the LI-PLS analysis tended to show the significant contribution of either the letters-number test and, especially, of the UPDRS-motor test in explaining the variance of most of the laterality differences in thalamic nuclei volumes. The right-AV and MOCA relationship is supported by neuropathological studies indicating that the primary site of PD degeneration in the thalamus is the anterodorsal nucleus, included in the AV nucleus11. These anterior thalamic nuclei, which show severe neuronal loss and tangle formation in MCI, are densely and directly connected to medial temporal lobe structures important for memory12. Our findings showing the relations between MDm/PuA/PuM laterality and the UPDRS-motor test point out to: I) the potential atrophy in MDm, which typically alters connectivity with the substantia nigra13; II) the somatosensorial nature of the PuA, which projects to hand representation cortex areas14,15; III) the involvement of the PuM in visual motor planning regarding spatial choices when decision and action are temporarily close, via its projections to the frontal and parietal eye fields16,17. Finally, the VLa nucleus laterality, which can be strongly related to psychomotor functions, was associated with the letters-numbers test18.Conclusions
Cognitive deficits in semantic fluency and SDMT tests in PD are related to a set of nuclei volume changes (CL/CeM/MDm/VA/VAmc/VLa/VLp) rather than to specific nuclei differences, except for the right-AV. Motor deterioration seems to be reflected in specific lateralization of the MDm and pulvinar areas.Acknowledgements
This research was possible thanks to the support of the Basque Government predoctoral fellowship PRE_2019_1_0085, grant PGC2018-093408-B-I00 from the Spanish Ministry of Science and Innovation, neuroscience research projects grant from the Fundación Tatiana Pérez de Guzmán el Bueno, the BERC 2018-2021 program of the Basque Government, and the Ramon y Cajal Fellowship RYC-2017-21845 from the Spanish Ministry of Economy and CompetitivenessReferences
1. García-Cabezas MÁ, Rico B, Sánchez-González MÁ, Cavada C. Distribution of the dopamine innervation in the macaque and human thalamus. Neuroimage. 2007;34(3):965-984.
2. Alexander GE, DeLong MR, Strick PL. Parallel organization of functionally segregated circuits linking basal ganglia and cortex. Annual Review of Neuroscience. 1986;9(1):357-381.
3. Halliday GM. Thalamic changes in parkinson's disease. Parkinsonism Relat Disord. 2009;15:S152-S155.4. Marek K, Jennings D, Lasch S, et al. The parkinson progression marker initiative (PPMI). Prog Neurobiol. 2011;95(4):629-635.
5. Destrieux C, Fischl B, Dale A, Halgren E. Automatic parcellation of human cortical gyri and sulci using standard anatomical nomenclature. Neuroimage. 2010;53(1):1-15.
6. Iglesias JE, Insausti R, Lerma-Usabiaga G, et al. A probabilistic atlas of the human thalamic nuclei combining ex vivo MRI and histology. Neuroimage. 2018;183:314-326.
7. Spreen O, Strauss E. A compendium of neuropsychological tests: Administration, norms and commentary. 1991. new york. .
8. Mielicki MK, Koppel RH, Valencia G, Wiley J. Measuring working memory capacity with the letter–number sequencing task: Advantages of visual administration. Appl Cognit Psychol. 2018;32(6):805-814.
9. Smith A. Symbol digit modalities test. Western Psychological Services Los Angeles; 1973.
10. Garrett DD, Kovacevic N, McIntosh AR, Grady CL. The modulation of BOLD variability between cognitive states varies by age and processing speed. Cerebral cortex (New York, N.Y. 1991). 2013;23(3):684-693.
11. Xuereb JH, Perry RH, Candy JM, Perry EK, Marshall E, Bonham JR. Nerve cell loss in the thalamus in alzeheimer's disease and parkinson's disease. Brain. 1991;114(3):1363-1379.
12. van Groen T, Kadish I, Michael Wyss J. Role of the anterodorsal and anteroventral nuclei of the thalamus in spatial memory in the rat. Behav Brain Res. 2002;132(1):19-28.
13. Ilinsky IA, Jouandet ML, Goldman-Rakic P. Organization of the nigrothalamocortical system in the rhesus monkey. J Comp Neurol. 1985;236(3):315-330.
14. Cerkevich CM, Qi H, Kaas JH. Thalamic input to representations of the teeth, tongue, and face in somatosensory area 3b of macaque monkeys. J Comp Neurol. 2013;521(17):3954-3971.
15. Darian-Smith C, Darian-Smith I, Cheema SS. Thalamic projections to sensorimotor cortex in the macaque monkey: Use of multiple retrograde fluorescent tracers. J Comp Neurol. 1990;299(1):17-46.
16. Wilke M, Turchi J, Smith K, Mishkin M, Leopold DA. Pulvinar inactivation disrupts selection of movement plans. The Journal of neuroscience. 2010;30(25):8650-8659.
17. Dominguez-Vargas A, Schneider L, Wilke M, Kagan I. Electrical microstimulation of the pulvinar biases saccade choices and reaction times in a time-dependent manner. J Neurosci. 2017;37(8):2234.
18. Hacker, D., Jones, C. A., Clowes, Z., Belli, A., Su, Z., Sitaraman, M., ... & Pettigrew, Y. The Development and Psychometric Evaluation of a Supplementary Index Score of the neuropsychological assessment battery screening module that is sensitive to traumatic brain injury. Arch Clinical Neuropsychol. 2017; 32(2):215-227.
Figures