2266
High reproducibility of sandwich spatial saturation neuromelanin imaging (sandwichNM): multicenter and test-retest results1Seoul National University, Seoul, Korea, Republic of, 2Severance Hospital, Seoul, Korea, Republic of, 3Department Radiology, Samsung Medical Center, Seoul, Korea, Republic of, 4Department Radiology, Catholic University of Korea, Seoul, Korea, Republic of, 5Department of Radiology, Konkuk University Medical Center, Seoul, Korea, Republic of, 6Heuron Co. Ltd., Incheon, Korea, Republic of, 7Department of Neurology, Severance Hospital, Seoul, Korea, Republic of
Synopsis
The reproducibility of the recently proposed sandwich spatial saturation neuromelanin (sandwichNM) imaging, which uses product sequences, is evaluated by a multi-center/multi-vendor traveling-subject study. Additionally, test-retest scans acquiring data in two different days are performed and evaluated. When compared to a conventional MT-weighted GRE NM imaging method, sandwichNM demonstrates higher contrast ratios and smaller variations across scanners, and higher intra-class coefficient and lower coefficient of variation in the test and retest scans, revealing higher reproducibility over the conventional method.
Introduction
Neuromelanin (NM)-sensitive MRI is a promising method for Parkinson’s disease.1–4 Several MT-prepared GRE and SE protocols were proposed, reporting reasonable NM contrast.5–7 While MT pulse prepared sequences are available in all vendors, the MT parameters (e.g., on-/off-resonance pulse, offset-frequency) differ substantially by vendors and sequences, limiting comparisons between images. Recently, a new NM imaging method, sandwichNM, was developed using spatial saturation pulses for MT weighting.8 The saturation pulse, which is available in the product sequences of all vendors, has flexibility in the number of pulses deployed and offset-frequency (via the location/thickness of the pulse). In sandwichNM, the saturation bands are located both inferior and superior to the imaging volume, like a sandwich, balancing the MT weighting (Figure 1a). In this study, the reproducibility of the sandwichNM method is evaluated by a multicenter study of traveling-subjects (Figure 1b), and also by a test-retest study (Figure 1c). To emphasize the advantages of the sandwichNM method, the results are compared with that of a conventional MT-weighted GRE (conventional NM).Methods
[Sequence parameters] The sandwichNM images were acquired using four sandwiched spatial saturation pulses (two pulses inferior, and two superior to the imaging volume; Figure 1a). Conventional NM images were acquired using a vendor-supplied MT pulse (Philips: on-resonance, Siemens/GE: off-resonance) instead of the saturation pulses. All the other sequence parameters were the same between the two methods (Table 1). In different scanners, a few parameters (e.g., TE, TA) were unable to match exactly due to differences in vendor-determined parameters (e.g., partial echo or elliptical scanning; Table 1).[Multicenter study] Three healthy subjects traveled three centers and images were acquired using three 3T scanners (IRB approved; Site 1: Trio, Siemens; Site 2: Ingenia CX, Philips; Site 3: Discovery750, GE). The imaging slab was placed parallel to the optic chiasm - posterior commissure (OC-PC) line. Spatial saturation thickness and gap for sandwichNM were 50 mm and 10 mm respectively. After acquisition, the images were registered. Then, substantia nigra (SN) and crus cerebri (CC) regions of interests (ROIs) were drawn on two slices (Figure 2) for analysis using the contrast ratio (CR):1
$$ CR(\%) = \frac{(I_{SN}-I_{CC})}{I_{CC}}\ \times100 $$
where $$$I_{SN}$$$ and $$$I_{CC}$$$ are the ROI-averaged signal intensities.
[Test-retest study] Five healthy subjects were scanned twice in two different days using a 3T scanner (IRB approved; Trio, Siemens). The imaging volume was placed perpendicular to the 4th ventricle. Spatial saturation thickness and gap for sandwichNM were 80 mm and 10 mm respectively. SandwichNM and conventional NM images were acquired for all subjects.
All images acquired from each subject were registered to the sandwichNM image from day 1. Then, SN and CC ROIs were drawn (Figure 3) and CR was calculated. The intra-class coefficient (ICC) and coefficient of variation (CoV) of CR were calculated across subjects.
Results
The results of the multi-center/multi-vendoer study are displayed in Figure 2. The conventional NM images are degraded by flow artifacts in all three scanners. SandwichNM images appear robust to flow artifacts while providing high and consistent contrasts across the scanners. When calculated across subjects, the mean CR of sandwichNM images are higher than that of conventional NM images in case of the Siemens and GE scanners (21.6% vs. 18.8% and 22.4% vs. 11.9% for Siemens and GE, respectively), and comparable to that of conventional NM images when the Philips scanner is used (27.5% vs. 27.7%). When mean and std are calculated across vendors, the sandwichNM images display higher mean and lower std compared to the conventional NM images (22.3 ± 3.3% vs. 19.5 ± 7.8%, 23.7 ± 2.9% vs. 18.1 ± 7.7%, and 25.5 ± 3.5% vs. 20.8 ± 8.4%, for subject 1, 2, and 3, respectively), where the lower std suggests lower variability across vendors (see Discussion and Conclusion).When analyzed for the test-retest study, the results suggest higher reliability of sandwichNM compared to that of conventional NM, reporting higher ICC (0.81, 95% confidence interval 0.13-0.98 vs. 0.71, 95% confidence interval -0.39-0.97) and lower CoV (5.85% vs. 9.10%).
Discussion and Conclusion
In this study, the reproducibility of sandwichNM imaging method was evaluated by a multicenter traveling-subject study and a test-retest study. Both results demonstrated high reproducibility of the sandwichNM compared to the conventional NM method. The CR of conventional NM images had large deviation across scanners. This deviation may come from the MT pulse differences across vendors. In particular, Philips conventional NM images, which utilized an on-resonance MT pulse, displayed comparable CR with the sandwichNM images while conventional NM images from Siemens and GE, which utilized off-resonance MT pulses, displayed lower CR values. In contrast, sandwichNM displayed homogeneous contrast across scanners with smaller CR variability across vendors despite the slight difference in scan parameters (e.g., TE) and possible differences of the saturaion pulse shape. The low ICC and large CoV value of conventional NM may partially come from the CR errors due to flow artifacts as visible in the images (red arrows Figure 3)In conclusion, sandwichNM provides consistent high-quality NM imaging results across scanners and time, and is easy to apply in clinics because product sequences are used. The method may be beneficial for cross-vendor and longitudinal studies.
Acknowledgements
This work was supported by Heuron. Co. Ltd., and NRF-2021R1A2B5B03002783References
1. Sasaki, M. et al. Neuromelanin magnetic resonance imaging of locus ceruleus and substantia nigra in Parkinson’s disease. Neuroreport 17, 1215–1218 (2006).
2. Cassidy, C. M. et al. Neuromelanin-sensitive MRI as a noninvasive proxy measure of dopamine function in the human brain. Proc National Acad Sci 116, 201807983 (2019).
3. Trujillo, P. et al. Pool size ratio of the substantia nigra in Parkinson’s disease derived from two different quantitative magnetization transfer approaches. Neuroradiology 59, 1251–1263 (2017).
4. Sulzer, D. et al. Neuromelanin detection by magnetic resonance imaging (MRI) and its promise as a biomarker for Parkinson’s disease. Npj Park Dis 4, 11 (2018).
5. Liu, Y. et al. Optimizing neuromelanin contrast in the substantia nigra and locus coeruleus using a magnetization transfer contrast prepared 3D gradient recalled echo sequence. Neuroimage 218, 116935 (2020).
6. Trujillo, P. et al. Quantitative magnetization transfer imaging of the human locus coeruleus. Neuroimage 200, 191–198 (2019).
7. Xing, Y., Sapuan, A., Dineen, R. A. & Auer, D. P. Life span pigmentation changes of the substantia nigra detected by neuromelanin‐sensitive MRI. Movement Disord 33, 1792–1799 (2018).
8. Ji, S. et al. High neuromelanin contrast achieved using sandwiched flow saturation RF pulses: sandwich-fsNM imaging. in Proceedings 2021 Annual Meeting, International Society for Magnetic Resonance in Medicine 1253 (2021).Figures
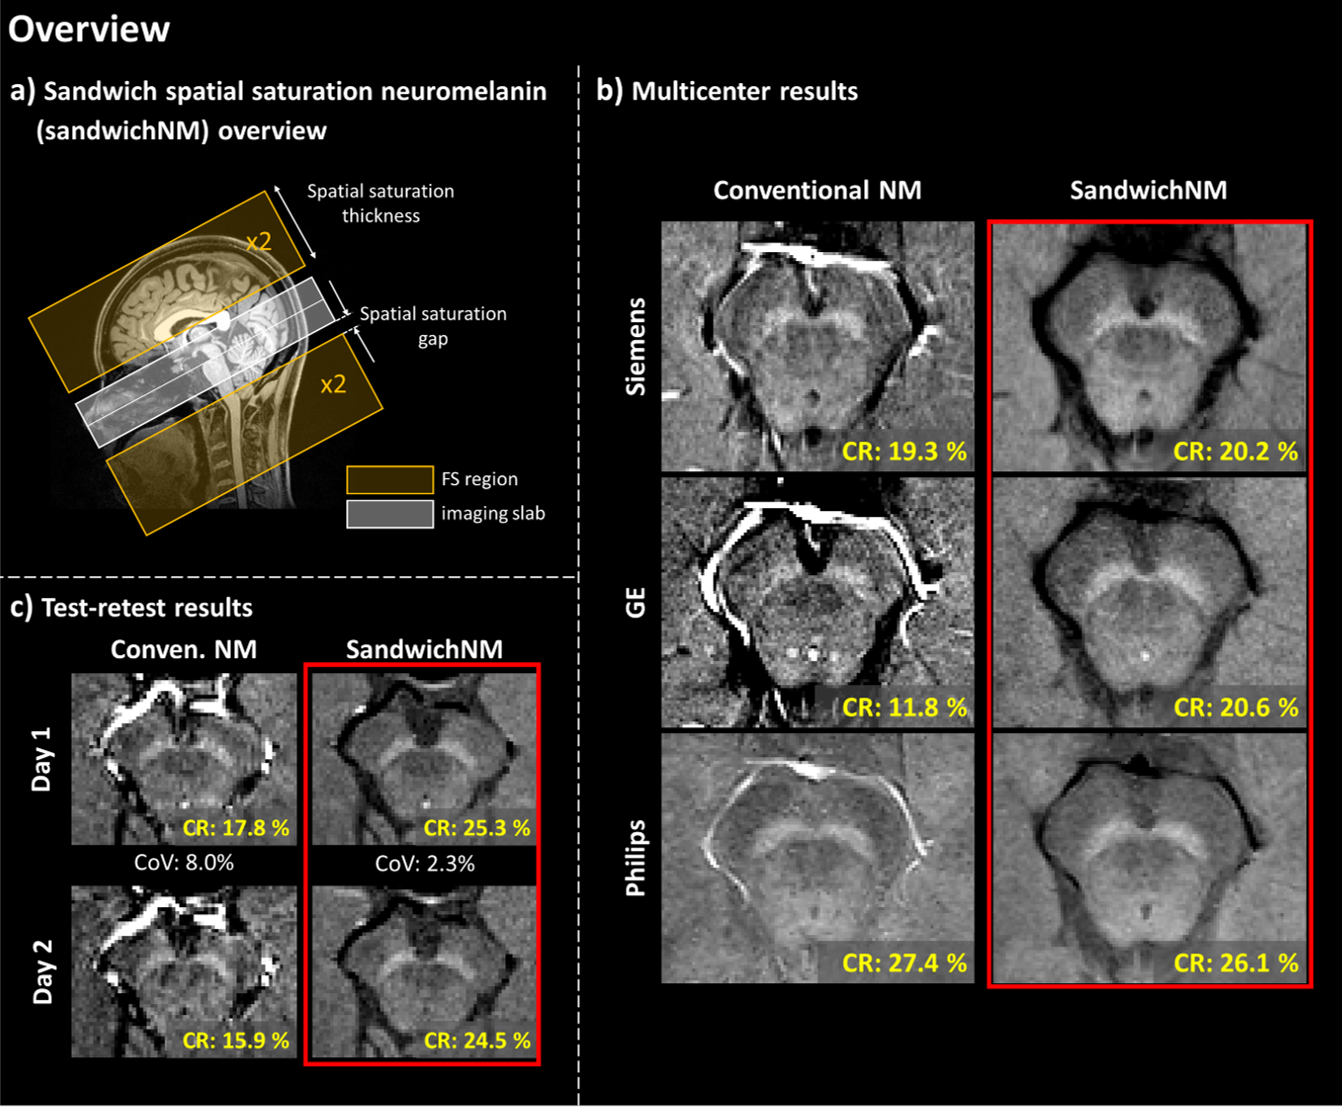
Figure 1. Overview of the reproducibility study of sandwich neuromelanin imaging
(sandwichNM). a) SandwichNM imaging uses spatial saturation pulses for MT
weighting; Even number of saturation pulses are alternately applied inferior
and superior to the imaging volume for symmetric MT effect across slices. b)
Multicenter results reveal higher and more consistent contrast ratio (CR)
across vendors compared to the conventional NM using MT-GRE. c) Test-retest
results display lower coefficient of variance (CoV) of CR in sandwichNM than
conventional NM imaging.
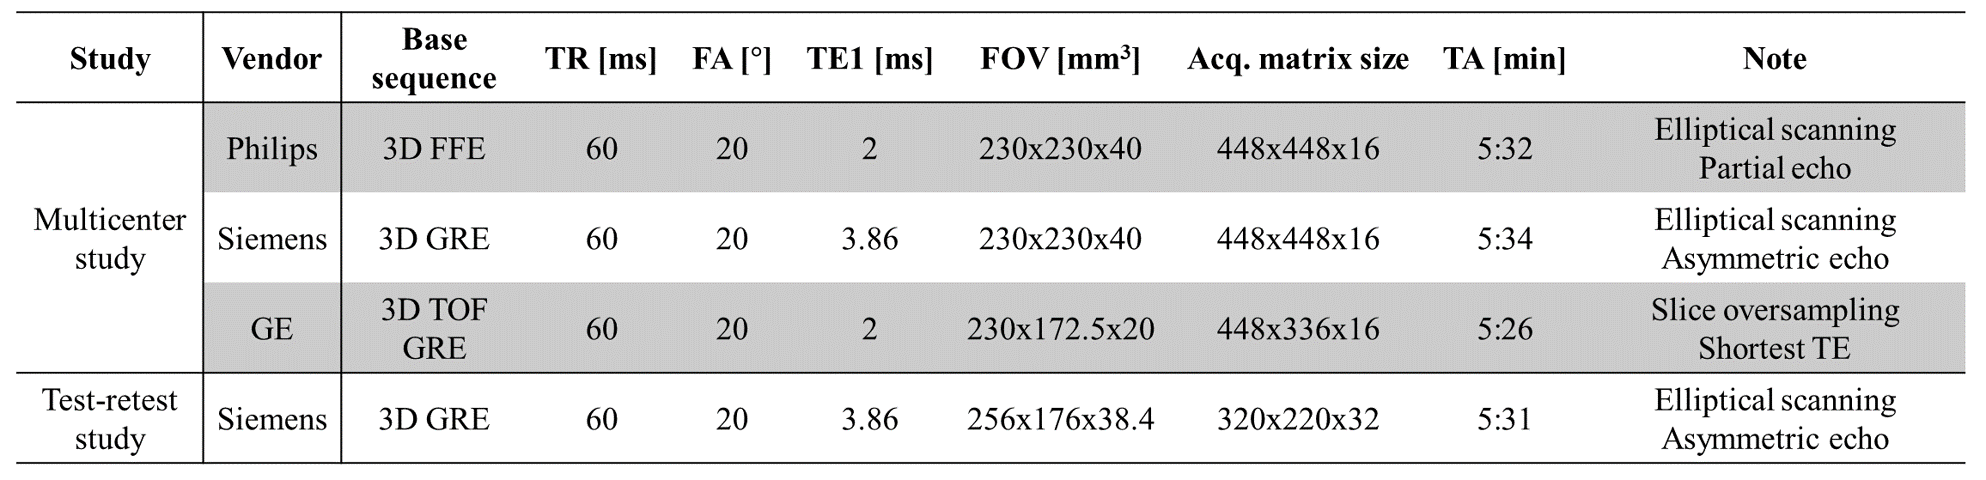
Table 1. Sequence parameters used
in the multicenter study and the test-retest study.
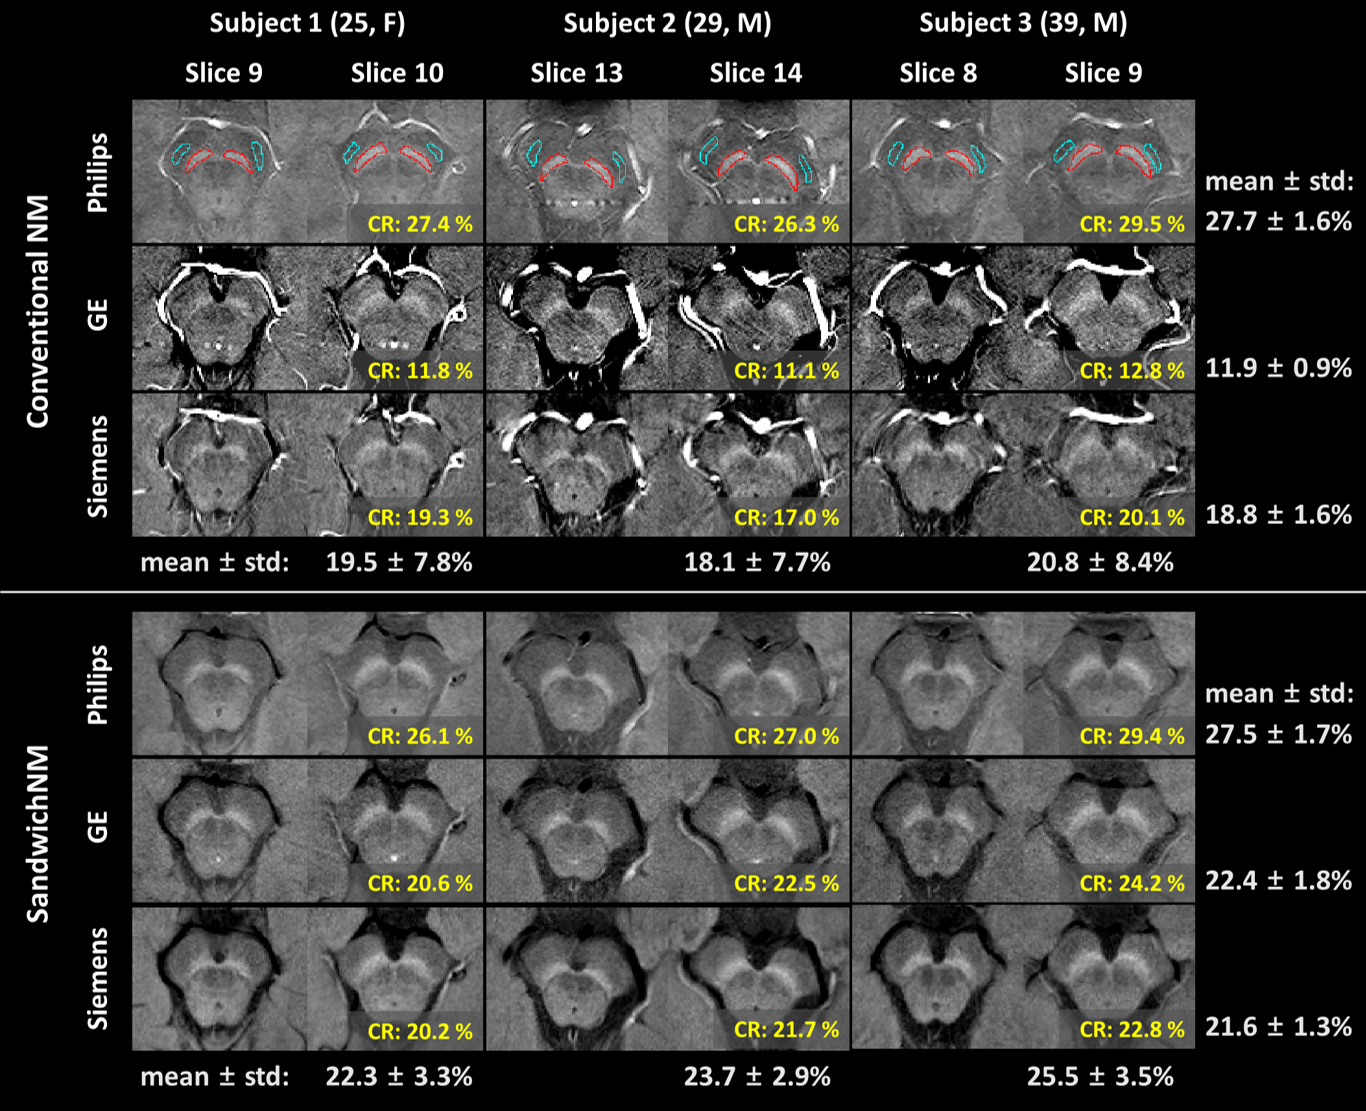
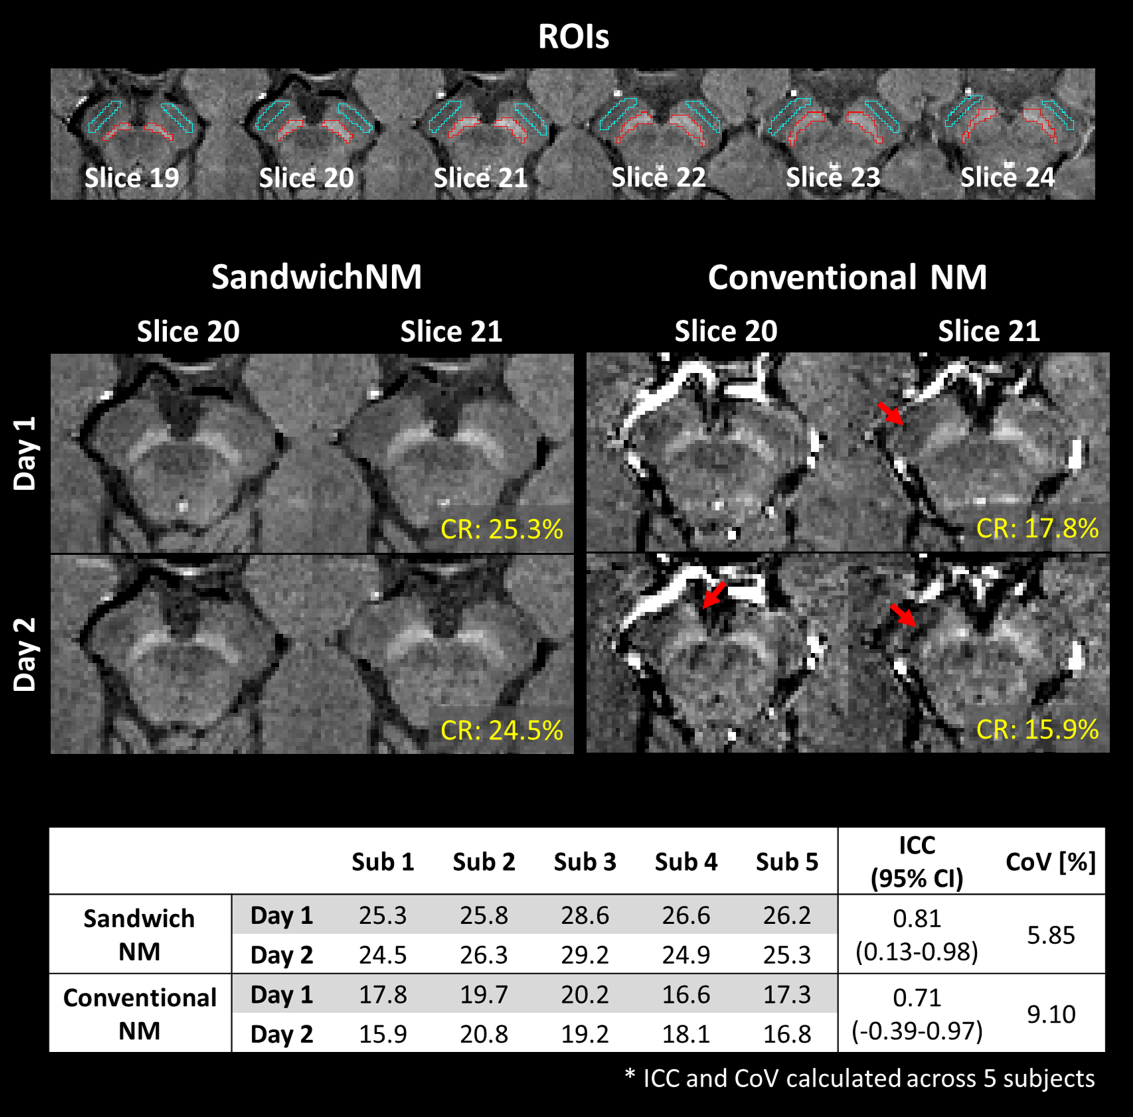
Figure 3. Results of the test-retest study. The ROIs drawn on 6 slices, and two
representative slices of sandwichNM and conventional NM images for Day 1 and 2
are displayed for one subject. Blue and red ROIs represent CC and SN ROIs,
respectively. The CR values are calculated for the displayed ROIs. Results of
statistical analysis suggest higher reliability of sandwichNM compared to
conventional NM with higher ICC (0.81 vs. 0.71) and lower CoV (5.85% vs.
9.10%). (SD=standard deviation, ICC=intraclass coefficient, CI= confidence
interval, CoV=coefficient of variation)