2265
Brain-wide olfactory aberrations in a Parkinson’s Disease mouse model revealed by functional MRI1Shemesh Lab, Champalimaud Foundation, Lisbon, Portugal, 2Experimental Neurodegeneration, University of Goettingen, Goettingen, Germany
Synopsis
Parkinson's disease (PD) is associated with irreparable damage to dopaminergic neurons in brain areas involved in movement. Frequently, a very early symptom is an impaired sense of smell, but the associated brain-wide mechanisms remain unclear. Here, we report on aberrations in BOLD-fMRI responses along olfactory pathway in a PD mouse model. We find decreased activation, especially in the main olfactory bulb, olfactory tubercle and piriform cortex in PD mice when compared to healthy controls upon olfactory stimulation.
Introduction
Parkinson’s disease (PD) is the second most widespread neurodegenerative disease worldwide1, typically characterized by α-synuclein (αSYN) aggregates and progressive motor deficits. Interestingly, olfactory deficitsmay precede clinical motor symptoms by years2 and can be used to assess the risk for developing PD inotherwise asymptomatic individuals2. Experiments in mouse models suggest that neuronal loss may lead to aberrations in olfactory perception3.MRI provides means for interrogating the entire network noninvasively. In the context of PD animal models, MRI was harnessed to characterize brain-wide microstructural changes via diffusion MRI4 and variations in brain volume by high resolution mapping5. Compared to other transgenic5,6 or toxin-based models7 the αSYNtransgenic model benefits from extensive characterization and reproduces several features of sporadic PD8.
Given the feasibility of olfactory stimulation in fMRI9,10, the main goal of this study was therefore to characterize activity aberrations along the olfactory pathway in the αSYN mouse model using fMRI.
Methods
All animal experiments were pre-approved by the competent institutional and national authorities and were carried out according to European Directive 2010/63.Animals: The mouse line used in this study is the SYN transgenic model (C57BL/6-DBA/2 Thy1- αSYN). Transgenic mice (N=10) and their wildtype littermates (healthy controls, N=10), were housed in 12h/12h light/dark cycles with ad-libitum access to food and water.
MRI setup:
MRI was performed on a 9.4 T Bruker BioSpec scanner (Karlsruhe, Germany) equipped with an 86mm volume coil for transmittance and a 4-element array cryogenic coil (Bruker, Fallanden, Switzerland) for signal reception, and a gradient system capable of producing up to 660mT/m isotropically.
Mice were sedated using medetomidine 0.4mg/kg bolus and 0.8mg/kg/h s.c. infusion. Temperature and respiration rate were continuously monitored and remained stable throughout the sessions.
Olfactory stimulation paradigm: Mice were stimulated using a specialized odor delivery setup. Amyl acetate diluted in mineral oil 1:10 was used for odor stimulation. The fMRI design included 48 seconds of rest followed by 4 sec of continuous olfactory stimulation (Fig.1A) repeated 5 times. Each of these stimulation blocks was repeated 3-4 times per animal.
fMRI acquisition: A multislice GE-EPI was used for the fMRI acquisitions, with the following parameters: TR/TE=1250/12ms, in-plane resolution=200×200μm2, BW=326kHz, pFT=1.3, FOV=16×12mm2, slice thickness=0.45mm, 440 repetitions, 10 slices.
Data preprocessing and activation mapping: Images were outlier, slice-timing and motion corrected, coregistered to respective anatomical scan, normalized to a reference scan (from a representative mouse) and spatially smoothed (FWHM=0.17mm) in SPM12. Outliers were found in 2-5 slices of each animal group, and 1 run of each group was discarded due to animal movement during olfactory acquisitions. A GLM was computed, using a double-gamma HRF peaking at 1.4 s, and corrected for false discovery rate (p<0.05, clusters > 8 voxels).
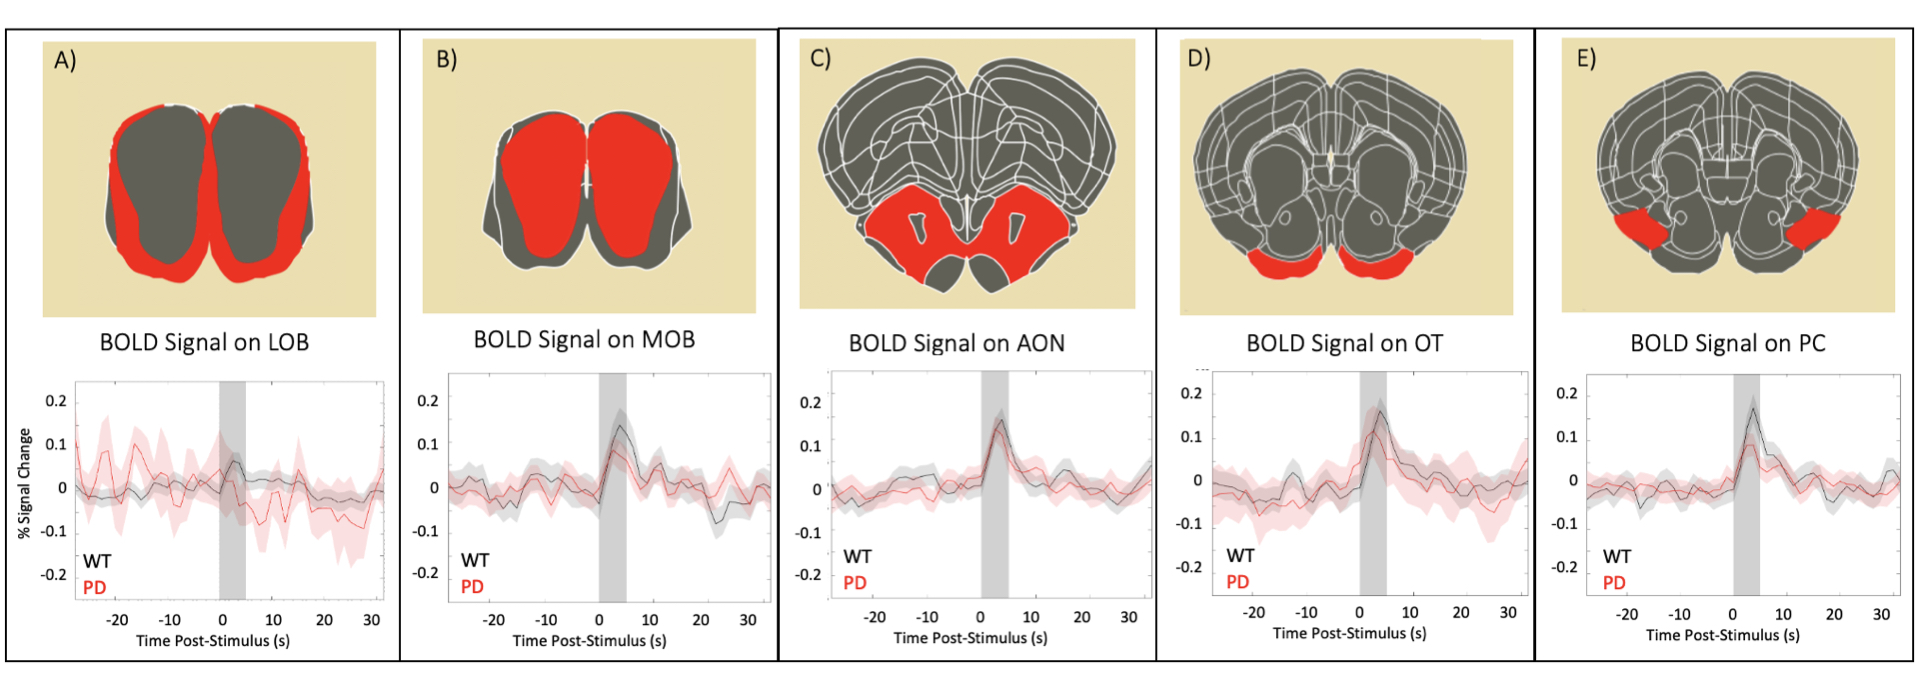
Region of interest (ROI) analysis: ROIs were manually defined according to the Paxinos and Watson atlas11 and mean±s.e.m. signals were extracted, detrended and temporally smoothed (Savitzky-Golay filter, span=5, degree=3). The average cycle was calculated by averaging all stimulation epochs.
Results
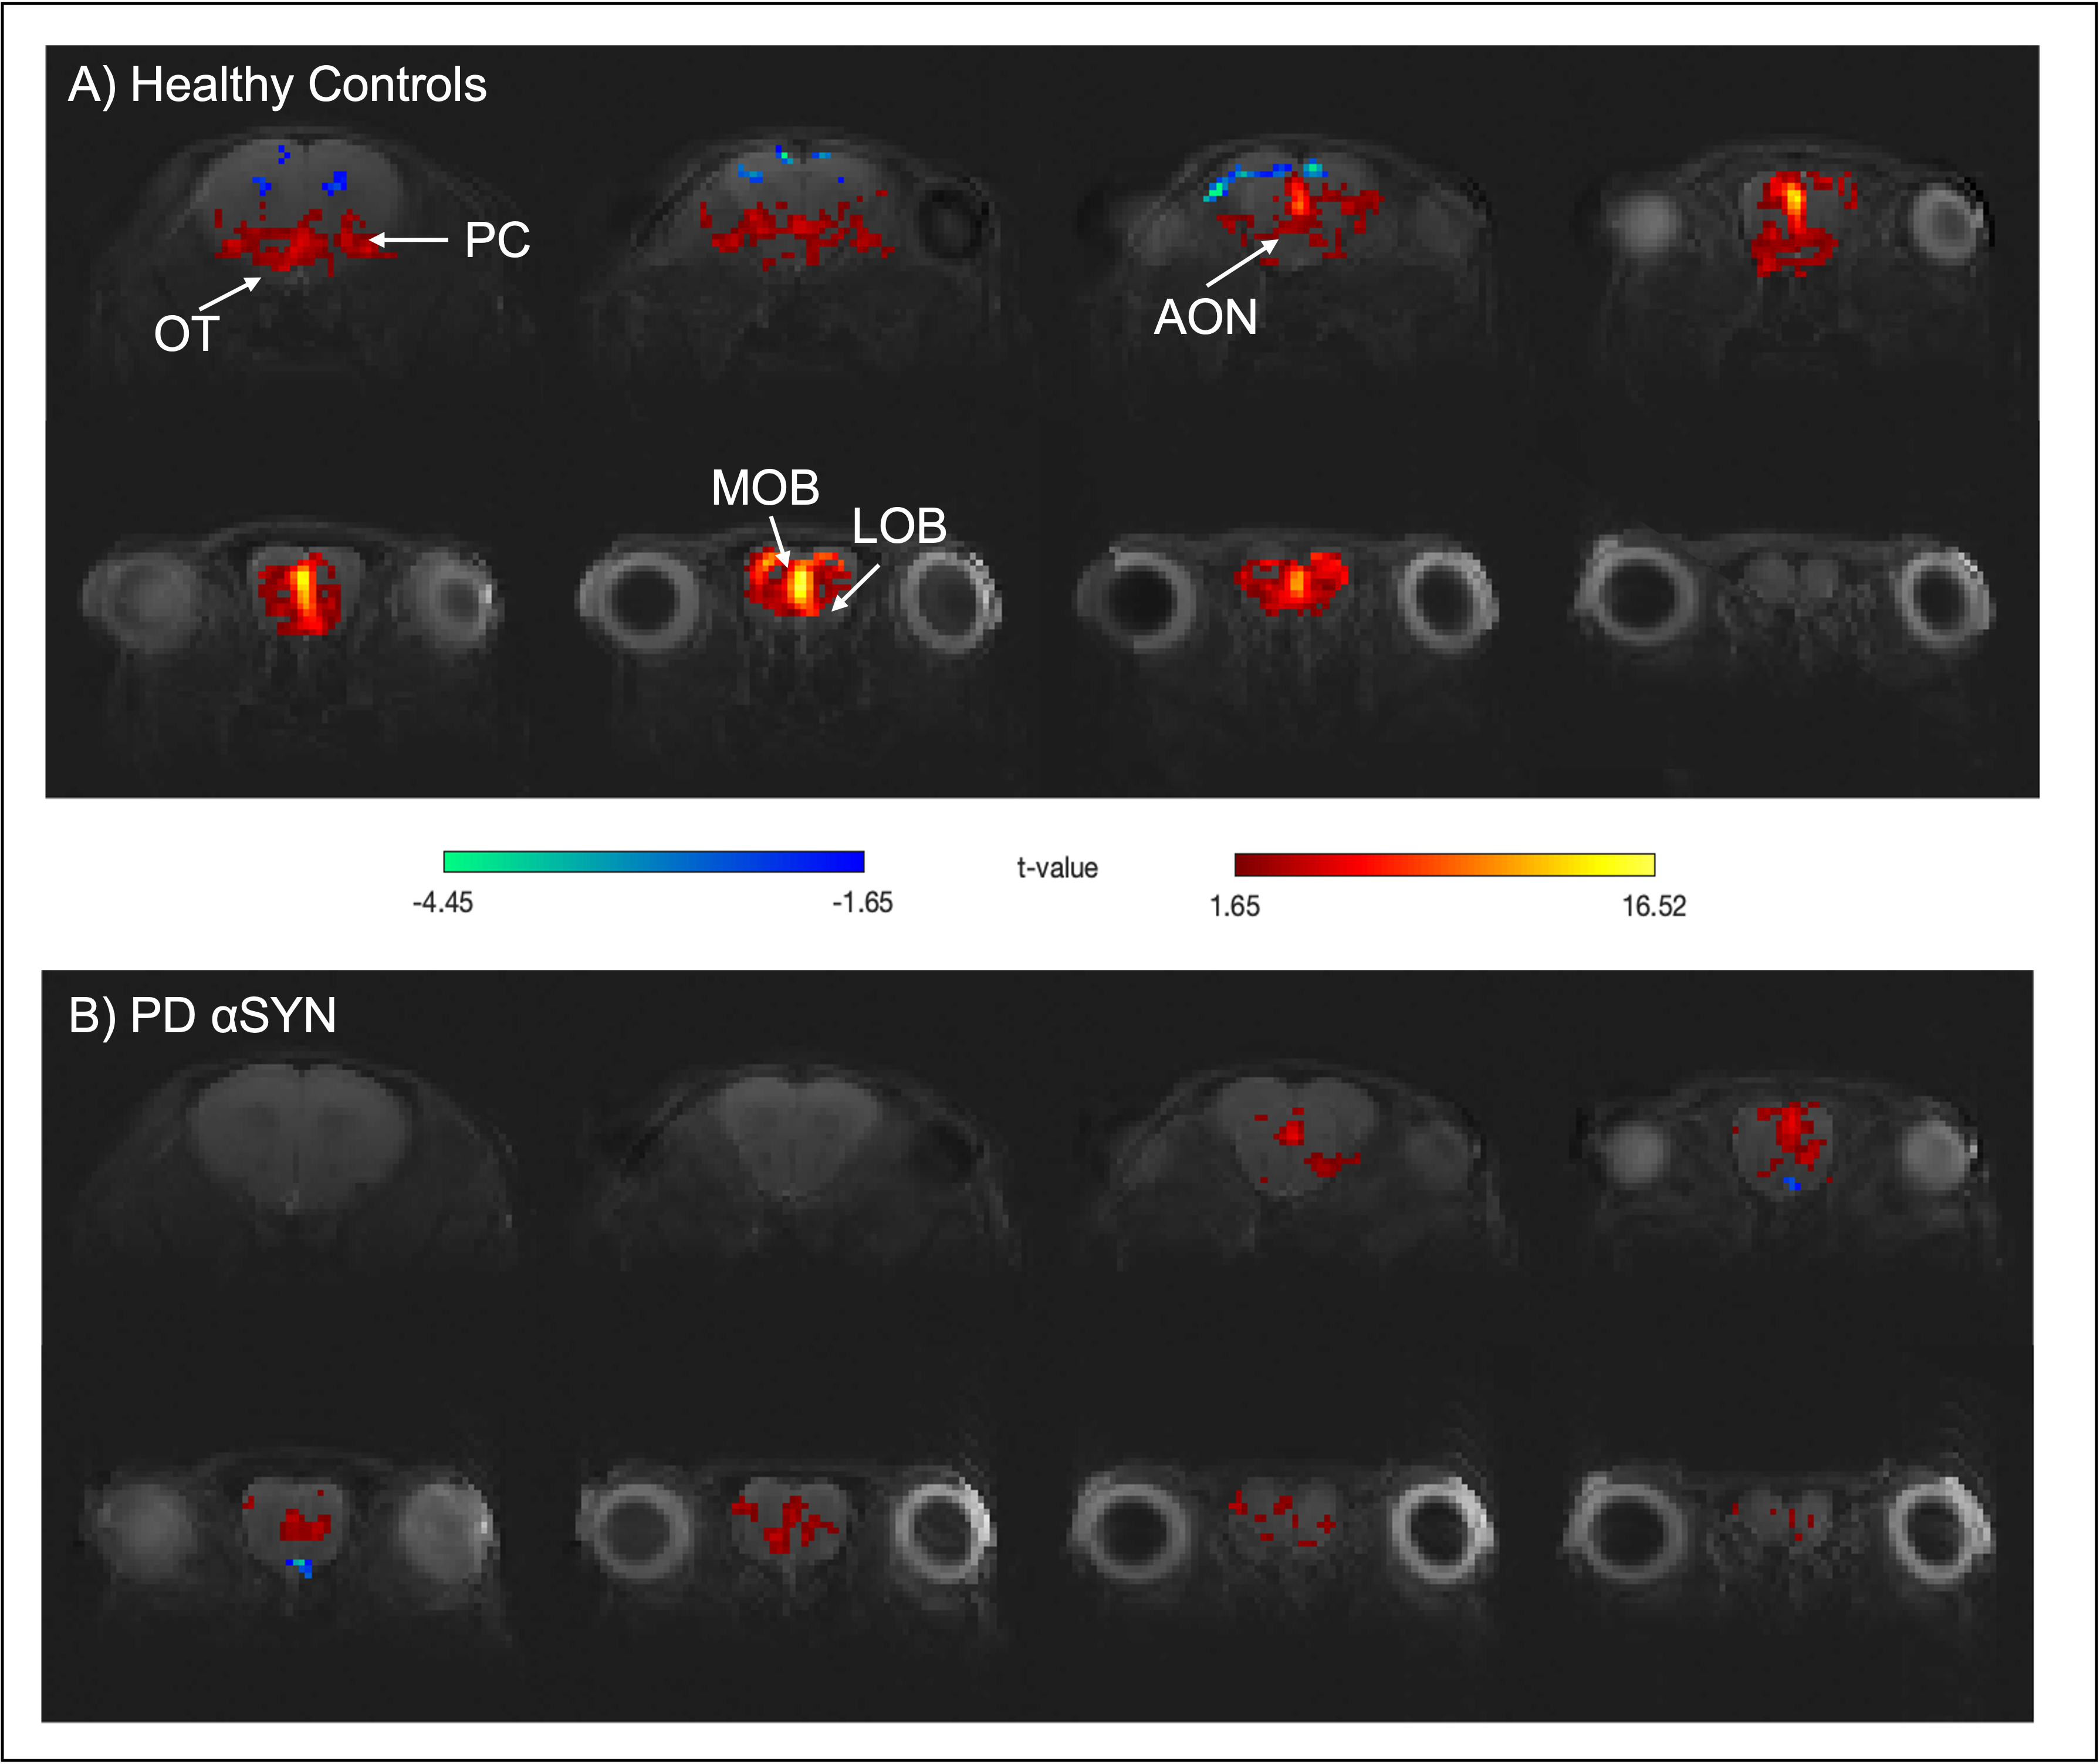
Raw data for the olfactory fMRI experiment (EPI acquisitions) was characterized by high quality (Fig.1B). Upon olfactory stimulation, healthy controls exhibited robust activation in the entire olfactory pathway, including the olfactory bulb, olfactory tubercle and piriform cortex (Fig.2). In PD mice, the number of activated pixels and the t-values corresponding to activation were clearly much lower than in the healthy controls (Fig.2). Medial areas seem to retain a higher level of activity when compared to more lateral regions of the olfactory bulb.To further investigate these responses, we examined fMRI signals in ROIs placed along the olfactory pathway (Fig.3). In healthy controls, robust BOLD responses were observed in the main olfactory areas, peaking around 4s. Interestingly, BOLD responses in the PD mice were heterogeneous: in LOB and LON, similar responses compared to healthy controls were noted, while in OT, PC and MOB, the response were highly disrupted, in some cases disappearing altogether.
Discussion
Our findings suggest that the αSYN transgenic model of PD is characterized by deficits in sensory processing along parts of the olfactory pathway while other areas remain comparable in activity extent to activity in healthy controls. This underscores the importance of entire network mapping in these models. Interestingly at least to some extent, our BOLD-fMRI findings mirror electrophysiological12 and behavioral13 results, which showed that neuronal loss may lead to a decrease in the underlying neural activity in PD. From a molecular perspective it is interesting to note that the genetic expression pattern of two important genes affecting PD progression, GBA114 and DJ-115, are qualitatively in line with our BOLD activation patterns. Such insights and putative correlations may be valuable for understanding the mechanisms underpinning sensory aberrations in PD progression.An important confounding factor of our experiments is the reliance of BOLD on neurovascular coupling, which potentially conflates vascular and neuronal sources. Indeed, recent CBF experiments in this transgenic model showed deficits suggesting a causative role for -synucleinopaties16. In the future, orthogonal techniques (e.g., c-FOS immunohistology, electrophysiology) probing the neuronal aspects, and hypercapnia / CBF measurements probing the vascular component will assist in the interpretation of our findings.
Conclusions
Our findings reveal important activation deficits along the olfactory pathway in a mouse model of PD.Acknowledgements
This study was supported by funding from the Mantero Belard Award 2020 and European Research Council (ERC) under the European Union’s Horizon 2020 research and innovation program.References
1. Calabresi P, di Filippo M. The changing tree in Parkinson’s disease. Nature Neuroscience. Published online 2015. doi:10.1038/nn.4092
2. Haehner A, Hummel T, Reichmann H. Olfactory loss in parkinson’s disease. Parkinson’s Disease. Published online 2011. doi:10.4061/2011/450939
3. Johnson ME, Bergkvist L, Mercado G, et al. Deficits in olfactory sensitivity in a mouse model of Parkinson’s disease revealed by plethysmography of odor-evoked sniffing. Scientific Reports. 2020;10(1). doi:10.1038/s41598-020-66201-8
4. Hansen B. Diffusion Kurtosis Imaging as a Tool in Neurotoxicology. Neurotoxicity Research. 2020;37(1). doi:10.1007/s12640-019-00100-3
5. Cong L, Muir ER, Chen C, et al. Multimodal MRI evaluation of the mitopark mouse model of Parkinson’s disease. PLoS ONE. Published online 2016. doi:10.1371/journal.pone.0151884
6. Yao L, Wu J, Koc S, Lu G. Genetic Imaging of Neuroinflammation in Parkinson’s Disease: Recent Advancements. Frontiers in Cell and Developmental Biology. 2021;9. doi:10.3389/fcell.2021.655819
7. Hisahara S, Shimohama S. Toxin-Induced and Genetic Animal Models of Parkinson’s Disease. Parkinson’s Disease. 2011;2011. doi:10.4061/2011/951709
8. Fernagut PO, Chesselet MF. Alpha-synuclein and transgenic mouse models. Neurobiology of Disease. Published online 2004. doi:10.1016/j.nbd.2004.07.001
9. Muir ER, Biju KC, Cong L, et al. Functional MRI of the mouse olfactory system. Neuroscience Letters. 2019;704. doi:10.1016/j.neulet.2019.03.055
10. Zhao F, Meng X, Lu S, et al. fMRI study of olfactory processing in mice under three anesthesia protocols: Insight into the effect of ketamine on olfactory processing. NeuroImage. 2020;213. doi:10.1016/j.neuroimage.2020.116725
11. ’Keith F, ’George P. Atlas of the Developing Mouse Brain. Vol 1. 5th ed. (Academic Press, ed.). Academic Press; 2019.
12. Ellens DJ, Leventhal DK. Review: Electrophysiology of Basal Ganglia and Cortex in Models of Parkinson Disease. Journal of Parkinson’s Disease. 2013;3(3). doi:10.3233/JPD-130204
13. Taylor TN, Greene JG, Miller GW. Behavioral phenotyping of mouse models of Parkinson’s disease. Behavioural Brain Research. 2010;211(1). doi:10.1016/j.bbr.2010.03.004
14. Do J, Perez G, Berhe B, Tayebi N, Sidransky E. Behavioral Phenotyping in a Murine Model of GBA1-Associated Parkinson Disease. International Journal of Molecular Sciences. 2021;22(13). doi:10.3390/ijms22136826
15. Chandran JS, Lin X, Zapata A, et al. Progressive behavioral deficits in DJ-1-deficient mice are associated with normal nigrostriatal function. Neurobiology of Disease. 2008;29(3). doi:10.1016/j.nbd.2007.11.011
16. Biju K, Shen Q, Hernandez ET, Mader MJ, Clark RA. Reduced cerebral blood flow in an α -synuclein transgenic mouse model of Parkinson’s disease. Journal of Cerebral Blood Flow & Metabolism. 2020;40(12). doi:10.1177/0271678X19895432
Figures
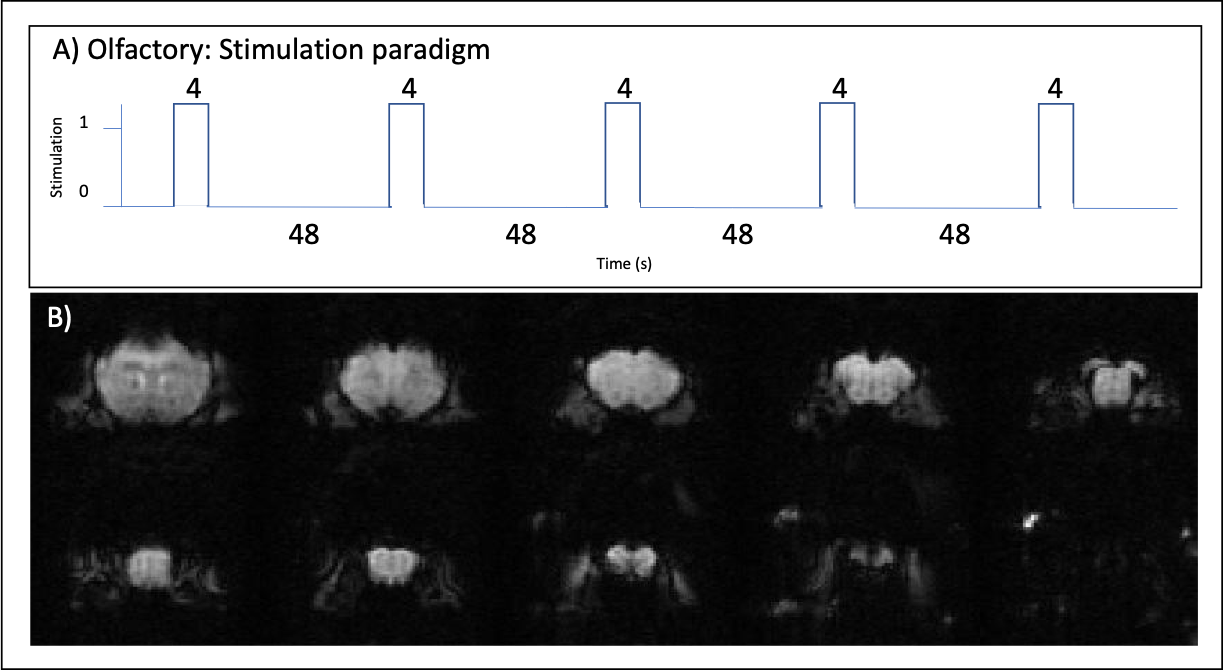
Figure 1: Stimulation paradigm and raw data.
A) Olfactory stimulation paradigm (5 stimulation trains, 4s each, interleaved by 48s of rest). B) Representative raw functional images of the slices analyzed in the olfactory stimulation.