2264
RF Coils for Evaluation of Duchenne Muscular Dystrophy Biomarkers at 4.7 T1Electrical and Computer Engineering, Texas A&M University, College Station, TX, United States, 2Biomedical Engineering, Texas A&M University, College Station, TX, United States, 3Veterinary Integrative Biosciences, Texas A&M University, College Station, TX, United States
Synopsis
Duchenne muscular dystrophy (DMD) is a debilitating genetic muscle disorder. To study and characterize this disease efficiently, our group has developed a set of custom single-tuned and multi-tuned coils. We have acquired 1H, 23Na and 31P data from 20 healthy and diseased samples. Some of the studied biomarkers have shown clear distinctions between healthy and diseased samples.
Introduction
Duchenne muscular dystrophy (DMD) is a genetic disorder that affects 1 in 3500-5000 males around the world1. Several animal models have been developed to study the disease, with canine models, such as golden retriever with muscular dystrophy (GRMD), being good predictors of disease development2. Our group has access to a vast number of formalin fixed and cryopreserved GRMD muscle samples to evaluate and characterize biomarkers, including 1H imaging/spectroscopy, 23Na imaging, and 31P spectroscopy. 1H imaging/spectroscopy are useful for assessing fatty infiltration and edema3-5; 23Na imaging is beneficial for assessing correlation between tissue sodium concentration and disease progression6, 7; 31P spectroscopy enables the study of anomalies in muscle metabolism8, 9. We have developed a set of custom coils to study these biomarkers in tissue samples. The coils include single-tuned, double-tuned, and triple-tuned options at each frequency (52.93, 81, and 200MHz at 4.7 T). This set of coils gives us potential flexibility to focus on specific nuclei, acquire multiple biomarkers without moving the sample, minimize scan time, and eliminate the need for co-registration of data during post-processing.Methods
HardwareThe coil geometries all included a solenoid and/or saddle coil that were built using 16 AWG enameled copper and 3D printed formers. The solenoids had inner diameter 12.1mm, height 27mm, 7 turns. The saddle inner diameter 20mm, height 24.9 mm, and standard aperture angle 120°.
The single-tuned saddle or solenoid structures were designed to nest with one another and fit as closely as possible to the tissue samples - approximately 1cm3 in volume (Fig. 1). The 1H coil was the saddle and the “outer coil” for all configurations. Multi-tuned coils then were achieved by nesting the respectively-tuned solenoid coil inside the 1H saddle coil. Specifically, the double-tuned coils consisted of two solenoid-saddle pairs tuned for 4.7T to 23Na (52.96 MHz)/1H (200 MHz) and 31P (81 MHz)/1H. The triple-tuned coil consisted of a single-tuned 23Na solenoid placed inside a double-tuned (31P/1H) saddle coil. Benchtop data included standard S11, S21, and Q measurements.
Data acquisition
The single-tuned coils were used to determine imaging protocol for each nucleus. Physiologically relevant phantoms and six GRMD formalin-fixed tissue samples were used to complete this stage.
With finalized parameters, twenty cryopreserved bicep femoris samples (8 healthy, 12 GRMD) were studied. To minimize scan time, avoid post-processing co-registration of 1H/23Na and 1H/31P data, and maximize X-nuclei sensitivity, the double-tuned coils were used. A positioning platform ensured repeatable positioning of the coils and samples (Fig. 2). The samples ranged from <1 month to 15 months of age. The following data was acquired on all samples: imaging included T1w, T2w, 3-point Dixon, and 23Na; spectroscopy included 31P spuls, 1H spuls, and 1H with water suppression.
Matlab and jMRUI were used to process the data, and JMP was used for statistical analysis. Correlations between age (disease progression), as well as statistically significant differences between diseased and healthy tissue, were assessed.
Results
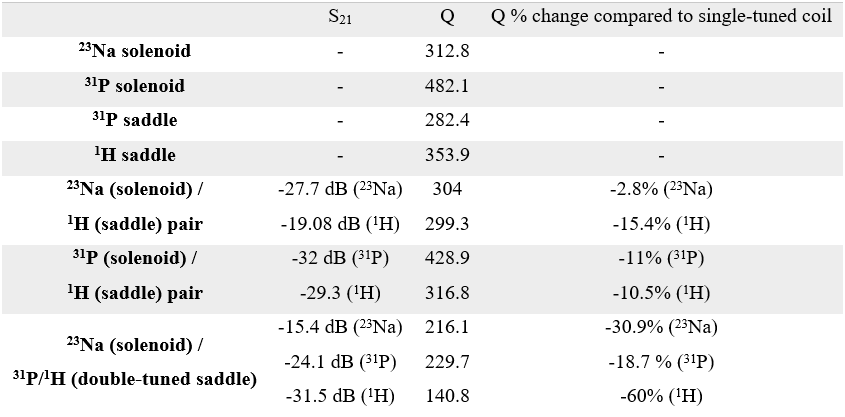
HardwareThe S11 of all coils was < -20 dB. Table 1 shows the measured S21 parameters, Q values, and the percent decrease in Q of the multi-tuned coils compared to their single-tuned counterpart. As expected, there is some loss due to multi-tuning. This is most evident with the triple-tuned structure which necessarily included traps.
Data acquisition
Preliminary processing of the 23Na imaging data shows differences in average SNR of the tissue samples, discussed below. Figure 3 shows the results of this statistical analysis. Figure 4 shows the characteristic 31P split inorganic phosphate peak, consistent with other studies9, and a Pearson correlation coefficient of 0.78 obtained between age and the normalized (by volume) peak intensity. Average SNR comparisons of the 1H data did not provide any significant information. Further processing of the 1H imaging and spectroscopy data needs to be done before drawing conclusions regarding disease progression/state.
Discussion
HardwareThe set of coils discussed in this work have proven to be useful for different purposes, including protocol testing, tissue studies, and evaluation of multi-tuned coil quality. The bench measurements indicate excellent individual performance and expected decreases in Q for multi-tuned coil structures. The triple-tuned coil was intended to capitalize on scanner time and provide the most reliable co-registration of the data, but the significant decrease in Q and commensurate SNR did not justify its use.
Data acquisition
For the 23Na data, the means of the average SNR in the two groups (healthy/diseased) are statistically different with a 95% confidence interval. Further processing is required to reach a conclusion regarding disease progression vs. age and differences between healthy/diseased tissue for 1H and 31P. The information obtained through this study will help determine which biomarkers are relevant and how to improve parameters for future tissue and in vivo studies.
Conclusion
We have demonstrated the utility of having a coil library available in the design of multi-nuclear large-scale tissue studies. Using this set of coils, we were able to (and will be able to) study a larger set of samples than would be practical with single-tuned coils, determine potentially significant differences in healthy and diseased tissue and assess disease progression/therapy response, and assess the effectiveness of using multi-tuned coils.Acknowledgements
The authors gratefully acknowledge funding for the project given through NIH grant R01EB028533 and R01EB028533-02S1.
References
1. Emery, A E. Population frequencies of inherited neuromuscular diseases--a world survey. Neuromuscul Disord. 1991;1(1):19-29.
2. Kornegay, J N, et al. Golden Retriever Muscular Dystrophy (GRMD): Developing and Maintaining a Colony and Physiological Functional Measurements. Methods in Molecular Biology (Methods and Protocols). D. Duan, Humana Press. 2010;709:105-123.
3. Finanger, E L, et al. Use of skeletal muscle MRI in diagnosis and monitoring disease progression in Duchenne muscular dystrophy. Phys Med Rehabil Clin N Am. 2012;23(1):1-10, ix.
4. Fan, Z, et al. Characteristics of magnetic resonance imaging biomarkers in a natural history study of golden retriever muscular dystrophy. Neuromuscul Disord. 2014;24(2):178-191.
5. Barnard, A M, et al. Skeletal muscle magnetic resonance biomarkers correlate with function and sentinel events in Duchenne muscular dystrophy. PLos ONE. 2018;13(3):e0194283.
6. Weber, M-A, et al. Sodium (23Na) MRI detects elevated muscular sodium concentration in Duchenne muscular dystrophy. Neurology. 2011;77(23).
7. Weber, M-A, et al. Permanent muscular sodium overload and persistent muscle edema in Duchenne muscular dystrophy: a possible contributor of progressive muscle degeneration. Neurology. 2012;259(11):2385-2392.
8. McCully, K, et al. Canine X-linked muscular dystrophy studied with in vivo phosphorus magnetic resonance spectroscopy. Muscle Nerve. 1991;14(11):1091-1098.
9. Wary, C, et al. Splitting of Pi and other 31P NMR anomalies of skeletal muscle metabolites in canine muscular dystrophy. NMR in Biomedicine. 2012;25(10):1160-1169.
Figures
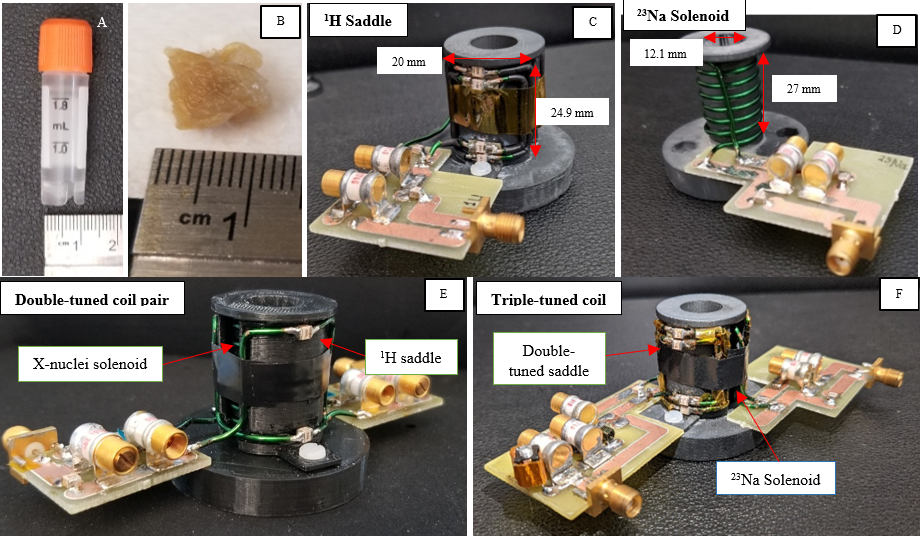
Figure 1. Vial, tissue, and single and multi-tuned coils. (C, B) Single-tuned solenoid (X-nuclei) and saddle (1H and 31P) example coils. (E) Nested solenoid/saddle configuration producing a double-tuned coil structure. (F) Nested solenoid with double-tuned saddle configuration producing a triple-tuned structure.
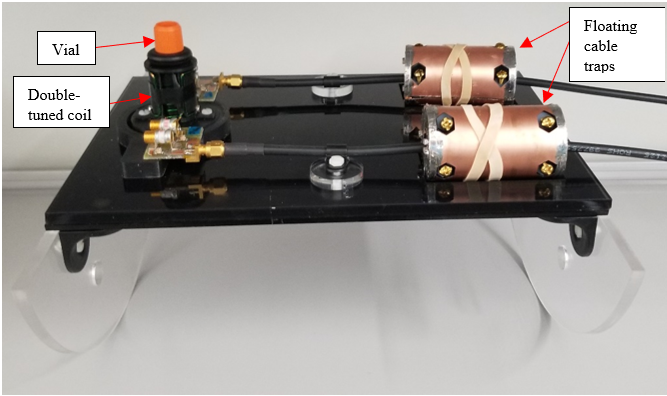
Figure 2. Coil, vial, floating cable traps, and positioning platform setup. Platform was designed to position the coil and tissue at the center of the scanner.

Figure 3. (A) Example zoomed-in 23Na image (top) and 1H ref image (bottom) of a phantom and tissue sample. (B) Statistical Analysis of 23Na SNR data as a function of diseased and healthy tissue. Box plots showing 23Na average SNR distribution. The Pooled t-test results show that the p-value is less than 0.05 indicating that the mean of the healthy tissue average SNR is less than the mean of the diseased tissue average SNR with a 95% confidence interval.
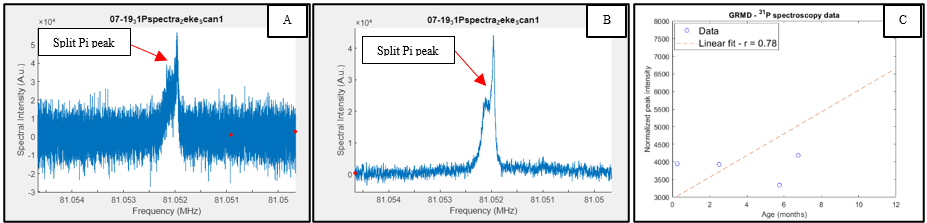
Figure 4. Preliminary processing of the 31P data showed a split inorganic phosphate peak, consistent with other studies. (A) Raw spectroscopy data and (B) data with 2Hz of line broadening showing the split inorganic phosphate peak more clearly. (C) Peak intensity distributions as a function of age (disease progression), linear fit of data and Pearson correlation coefficient.