2251
Acute Lower Body Negative Pressure Changes Human Brain Stiffness in vivo Measured with MR Elastography1Biomedical Engineering, University of Delaware, Newark, DE, United States, 2Kinesiology and Applied Physiology, University of Delaware, Newark, DE, United States
Synopsis
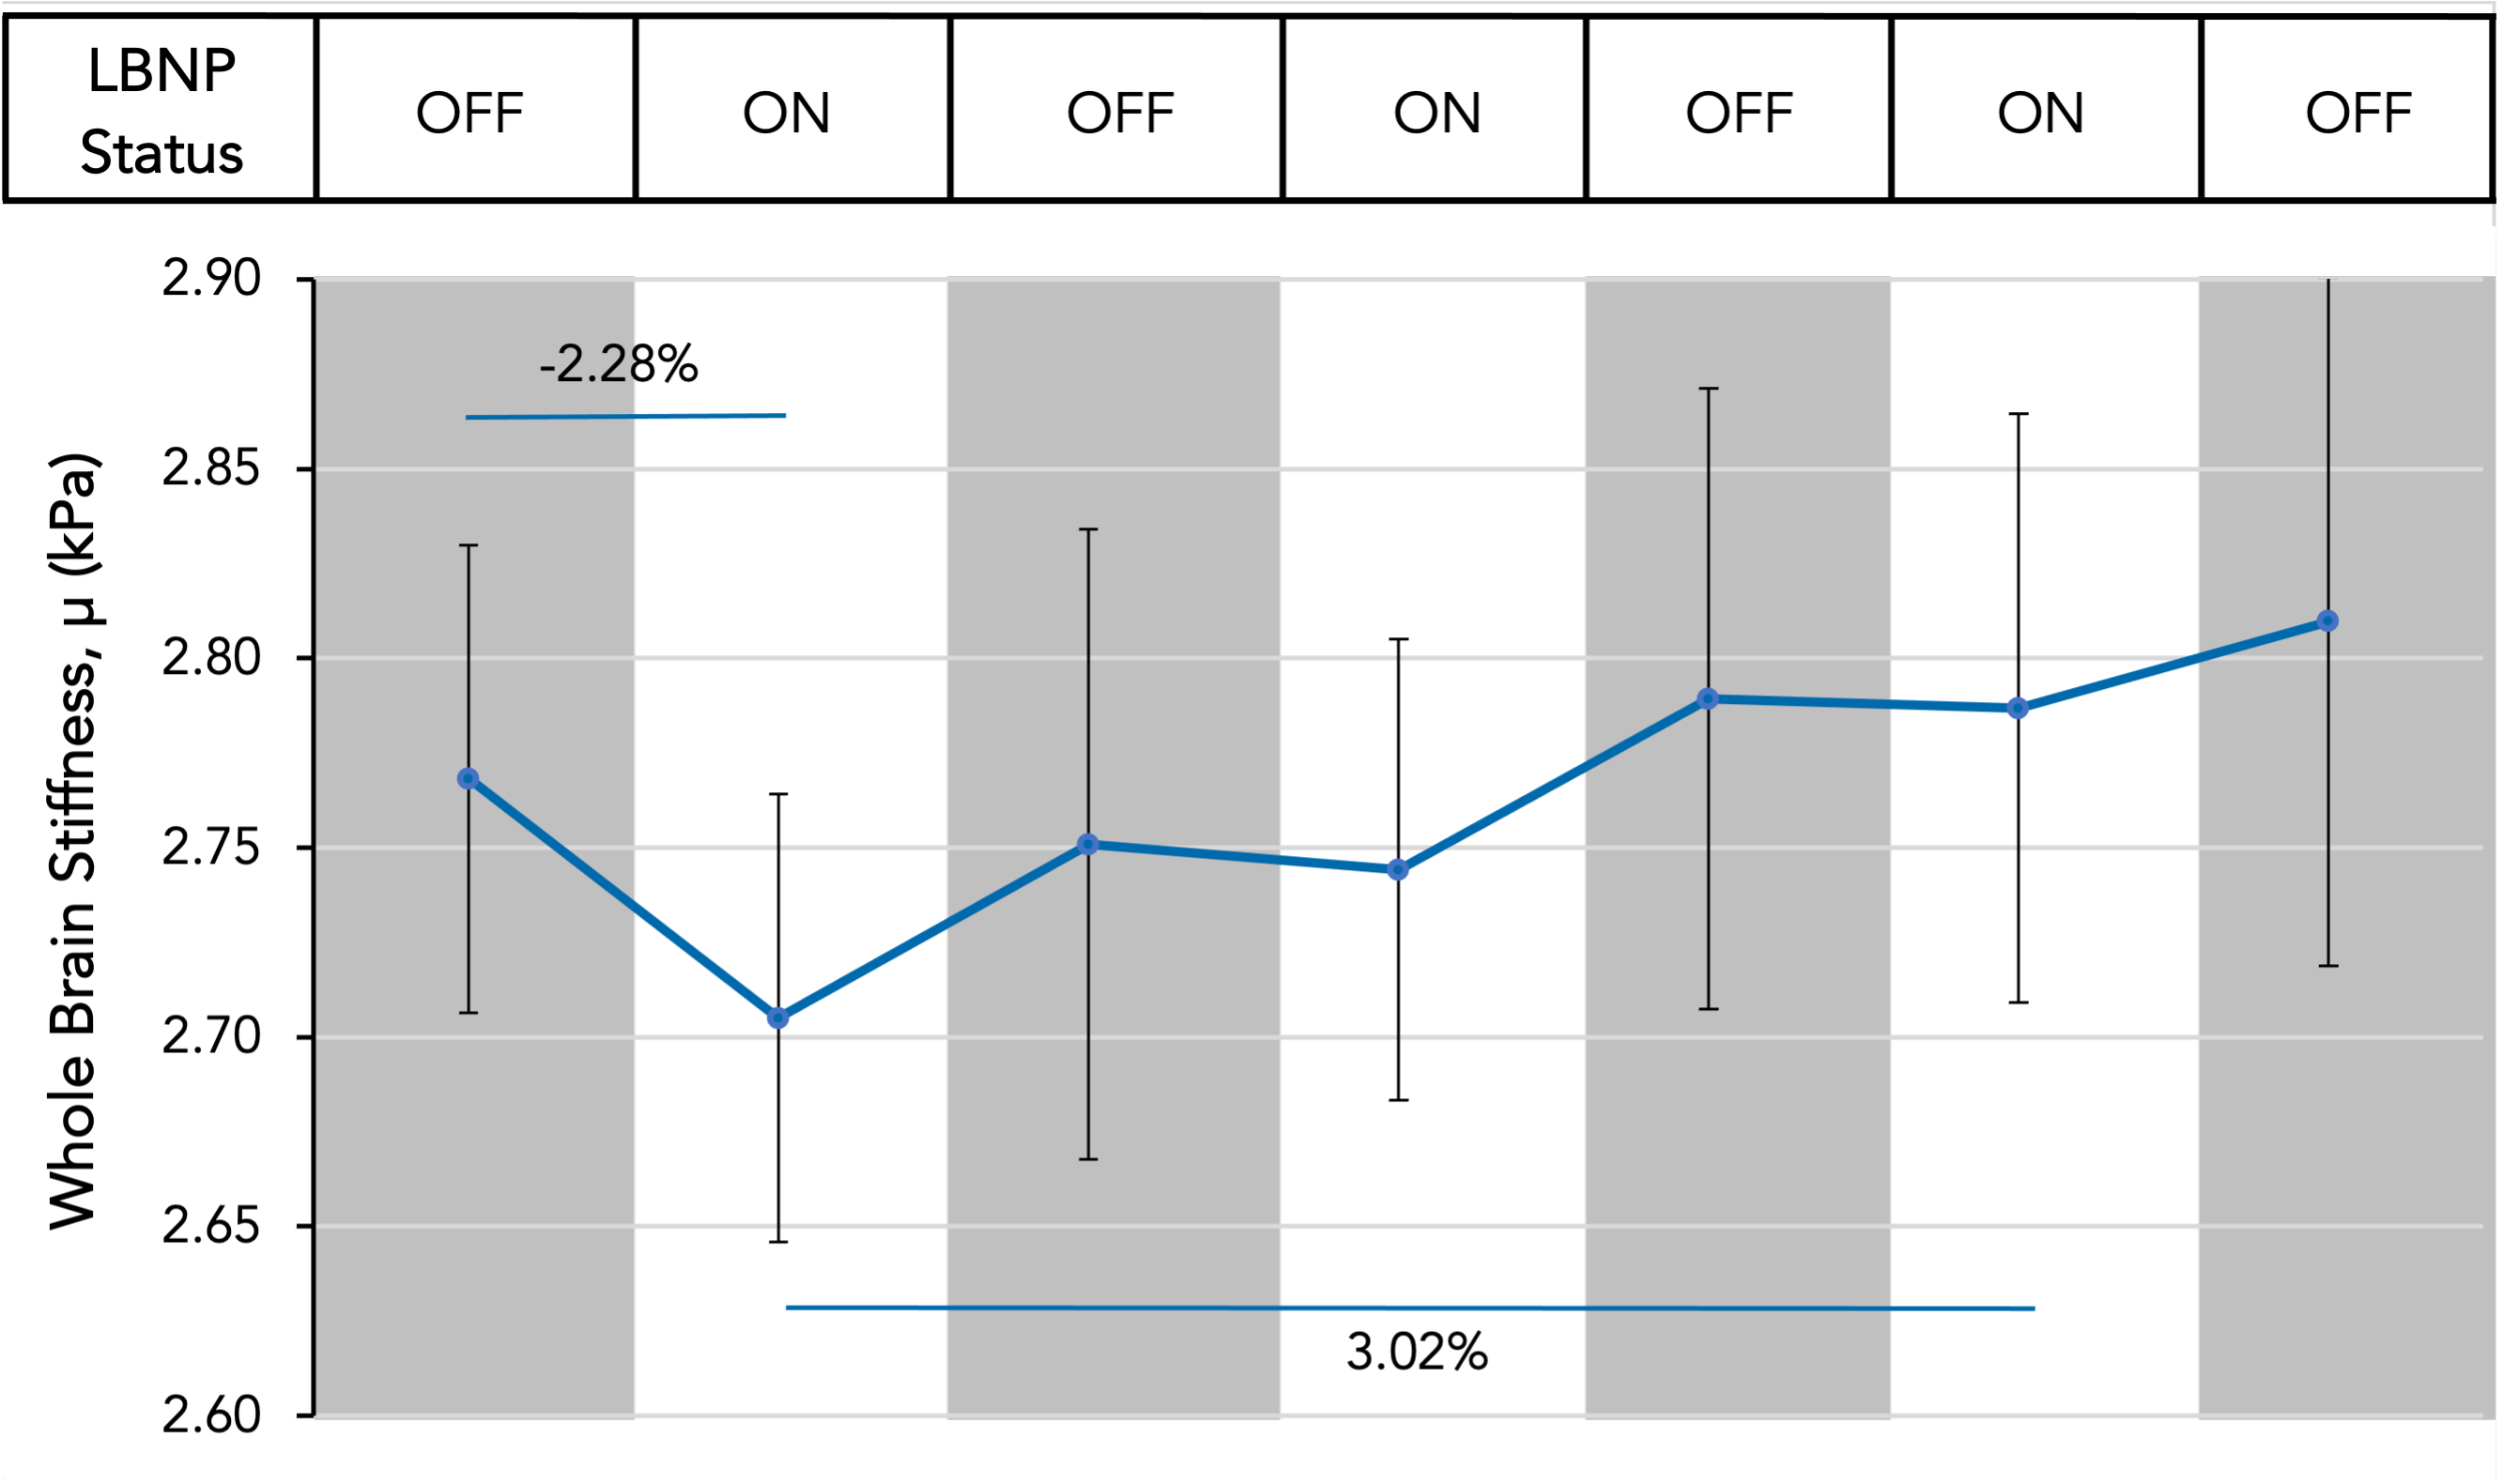
Lower body negative pressure (LBNP) is a non-invasive physiological method known to decrease cerebral blood flow. This technique was used to study the brain’s response to altered cerebrovascular hemodynamics and showed that, on average, brain stiffness decreases by 2.28% in response to ten minutes of LBNP application and decreased cerebral blood flow. By decreasing and increasing cerebral blood flow by turning the LBNP on and off repeatedly in 10-minute blocks, brain stiffness was shown to increase by 3.02% on average from the initial application of LBNP to the final application of LBNP.
Introduction
Lower body negative pressure (LBNP) is a method in which negative pressure is applied below the iliac crest causing pooling of blood in the legs, thereby altering central hemodynamics1. LBNP evokes several physiologic responses, namely decreased central venous return which reduces cerebral blood flow and intracranial pressure2,3. There is a significant gap in knowledge regarding how the brain responds to such an acute change in blood flow. We propose to examine the effects of decreased cerebral blood flow on brain tissue stiffness using magnetic resonance elastography (MRE), a technique for noninvasively imaging the mechanical properties of tissues in vivo. Brain stiffness is indicative of neural tissue integrity and brain health, and has shown response to acute changes in intracranial pressure and blood flow4,5. By observing brain stiffness under different conditions with LBNP, we can illuminate the acute effects of altered hemodynamics on brain tissue integrity.Methods
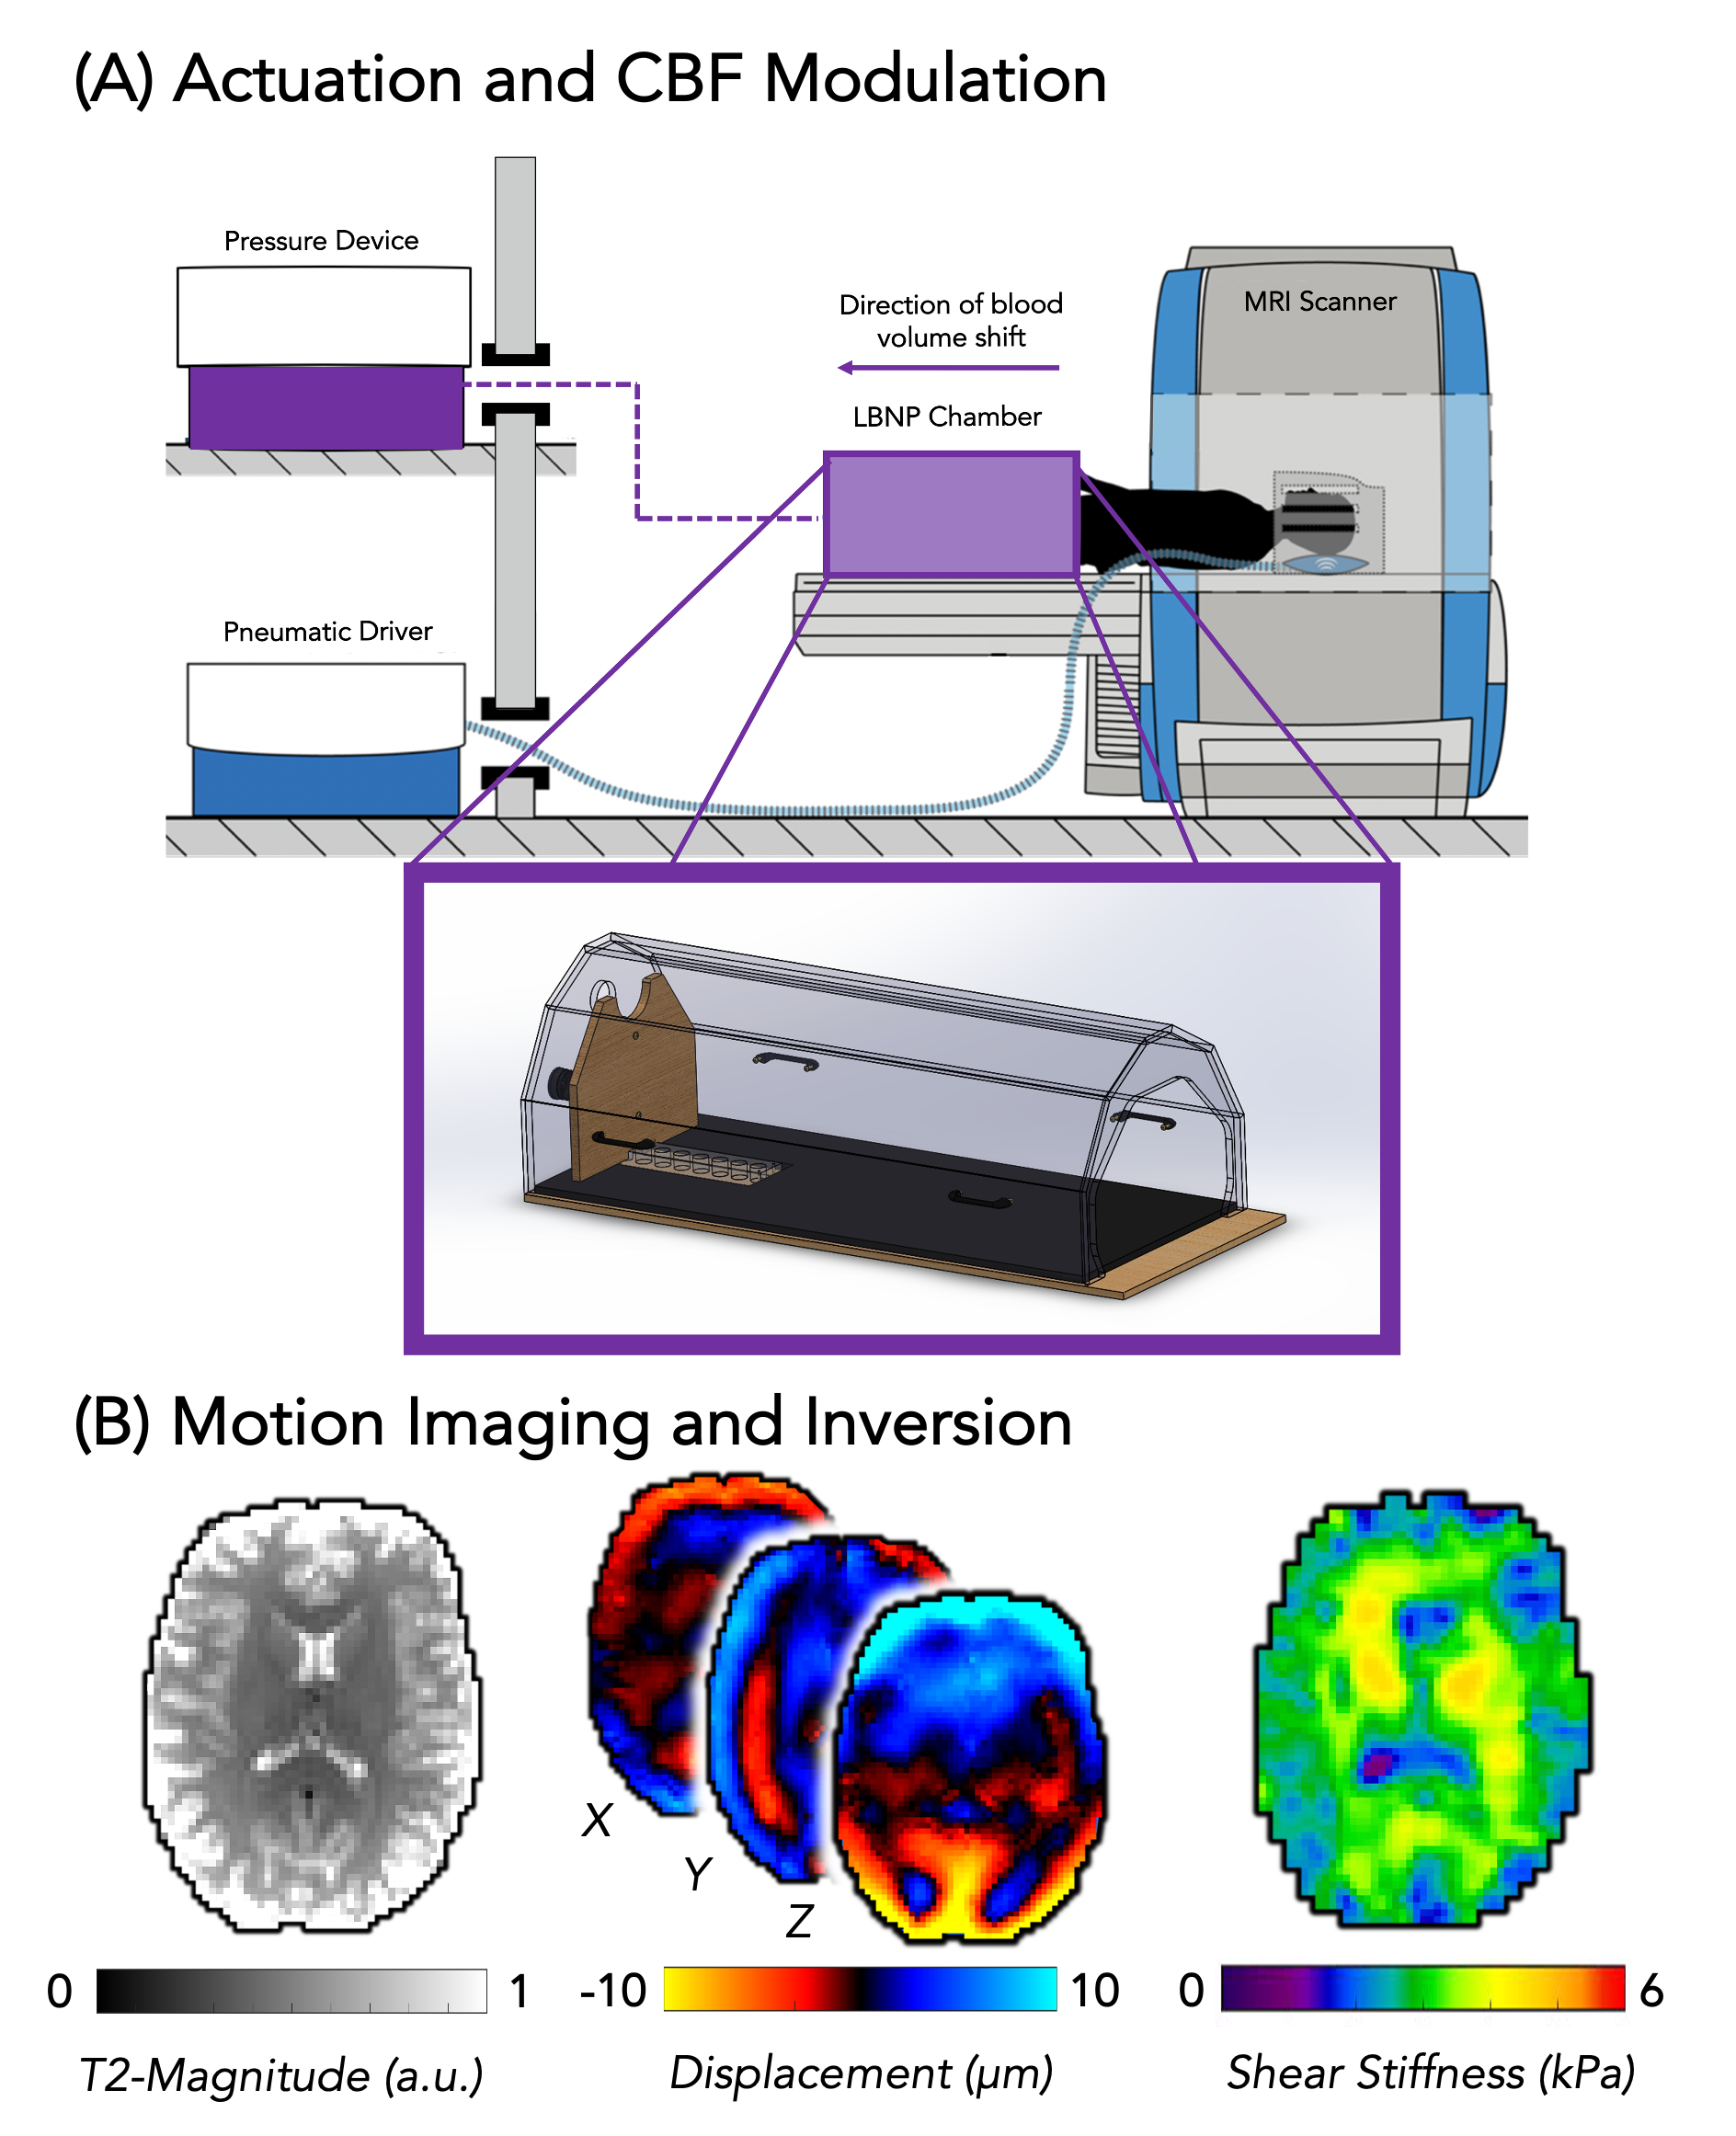
Six subjects (4M/2F; 22-26 years old) were imaged using a Siemens 3T Prisma MRI scanner while in a custom-built, MRI-compatible LBNP chamber, as shown in Figure 1A. A pneumatic actuator system (Resoundant, Rochester, MN) was used to deliver vibrations to the back of the head at 50 Hz that generated tissue displacements imaged with an echoplanar imaging MRE sequence (2.5 mm resolution; 48 slices; TR=6720ms; TE=70ms; FOV=240x240mm; 3.5 minutes per scan). Seven MRE scans were collected for each subject, alternating between two conditions: LBNP off, to observe a baseline condition, and LBNP on, with -30 mmHg applied pressure. Each condition was applied for a duration of 6 minutes and 30 seconds prior to starting the scan and continued until the end of the scan so that each condition was applied for duration of 10 minutes. After data collection, a nonlinear inversion algorithm (NLI) was used to convert measured displacement fields into maps of estimated brain tissue stiffness, µ, as seen in Figure 1B6. The whole brain map of shear stiffness is calculated by μ=2|G|2/(G’+|G|) where G is the complex viscoelastic shear modulus, composed of the sum of the loss modulus G’’ which represents the viscous component of the material, and the storage modulus G’ which represents the elastic portion of the material7,8. Stiffness data was averaged across the whole brain white matter and grey matter, excluding CSF, as determined via segmentation using FSL-FAST.Results
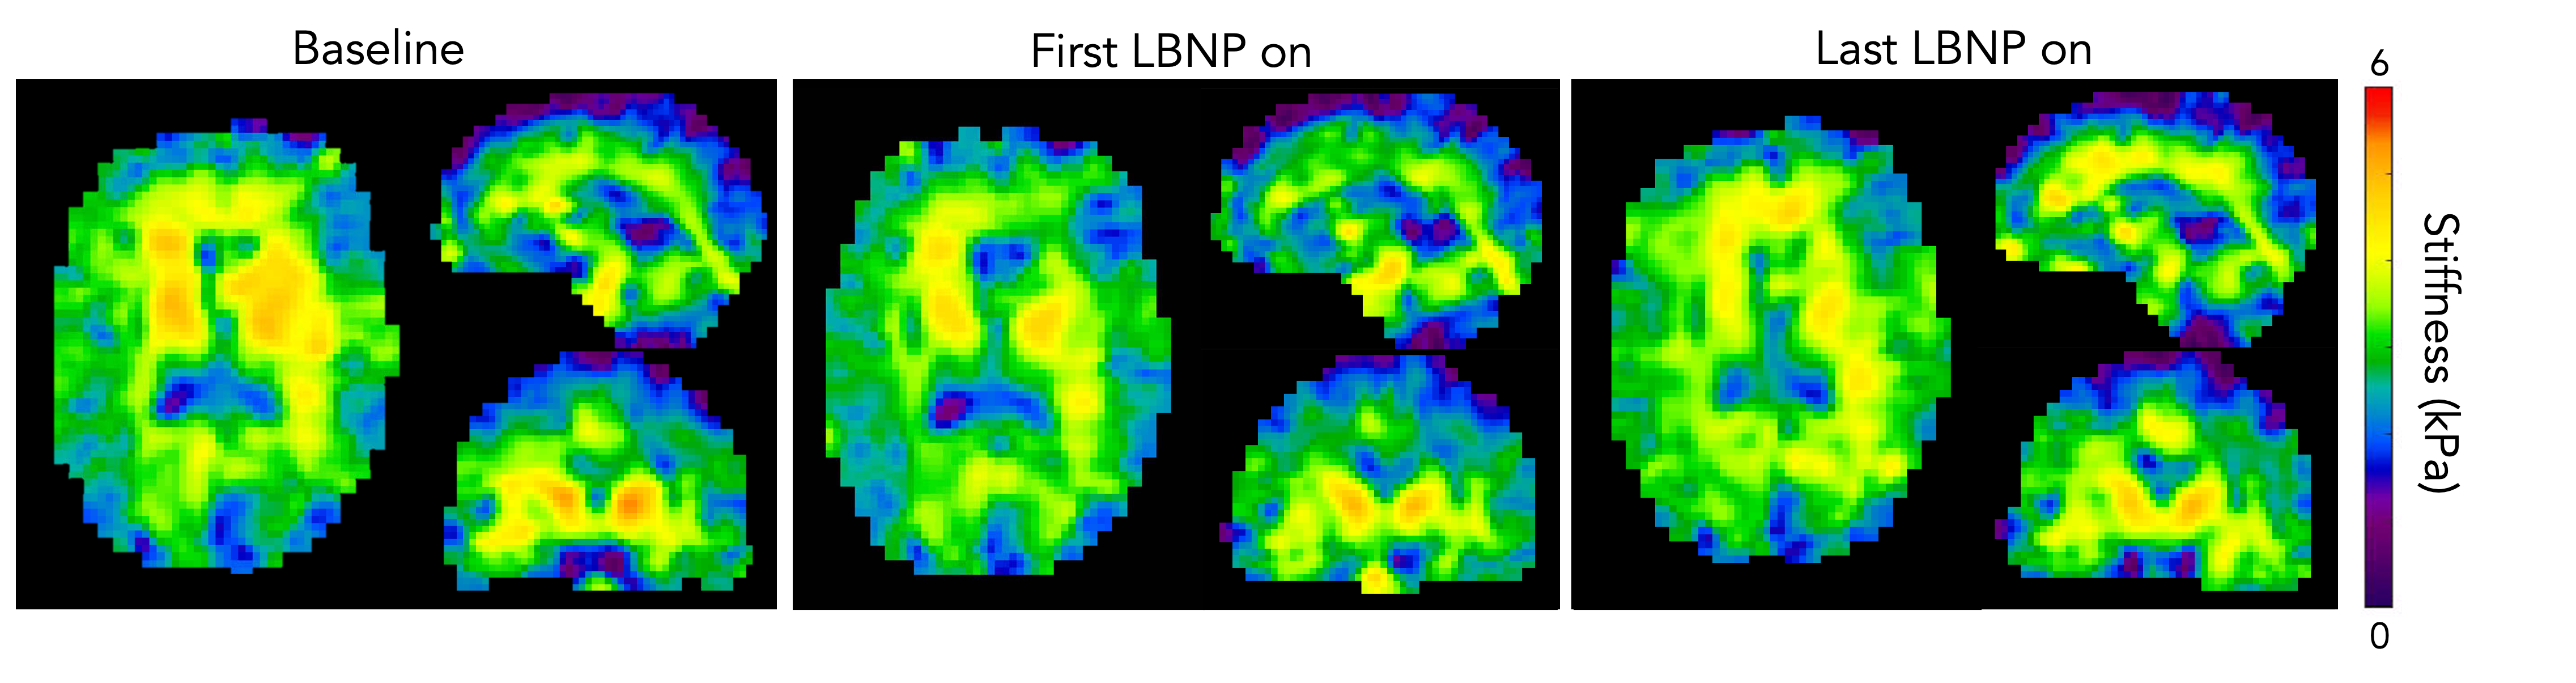
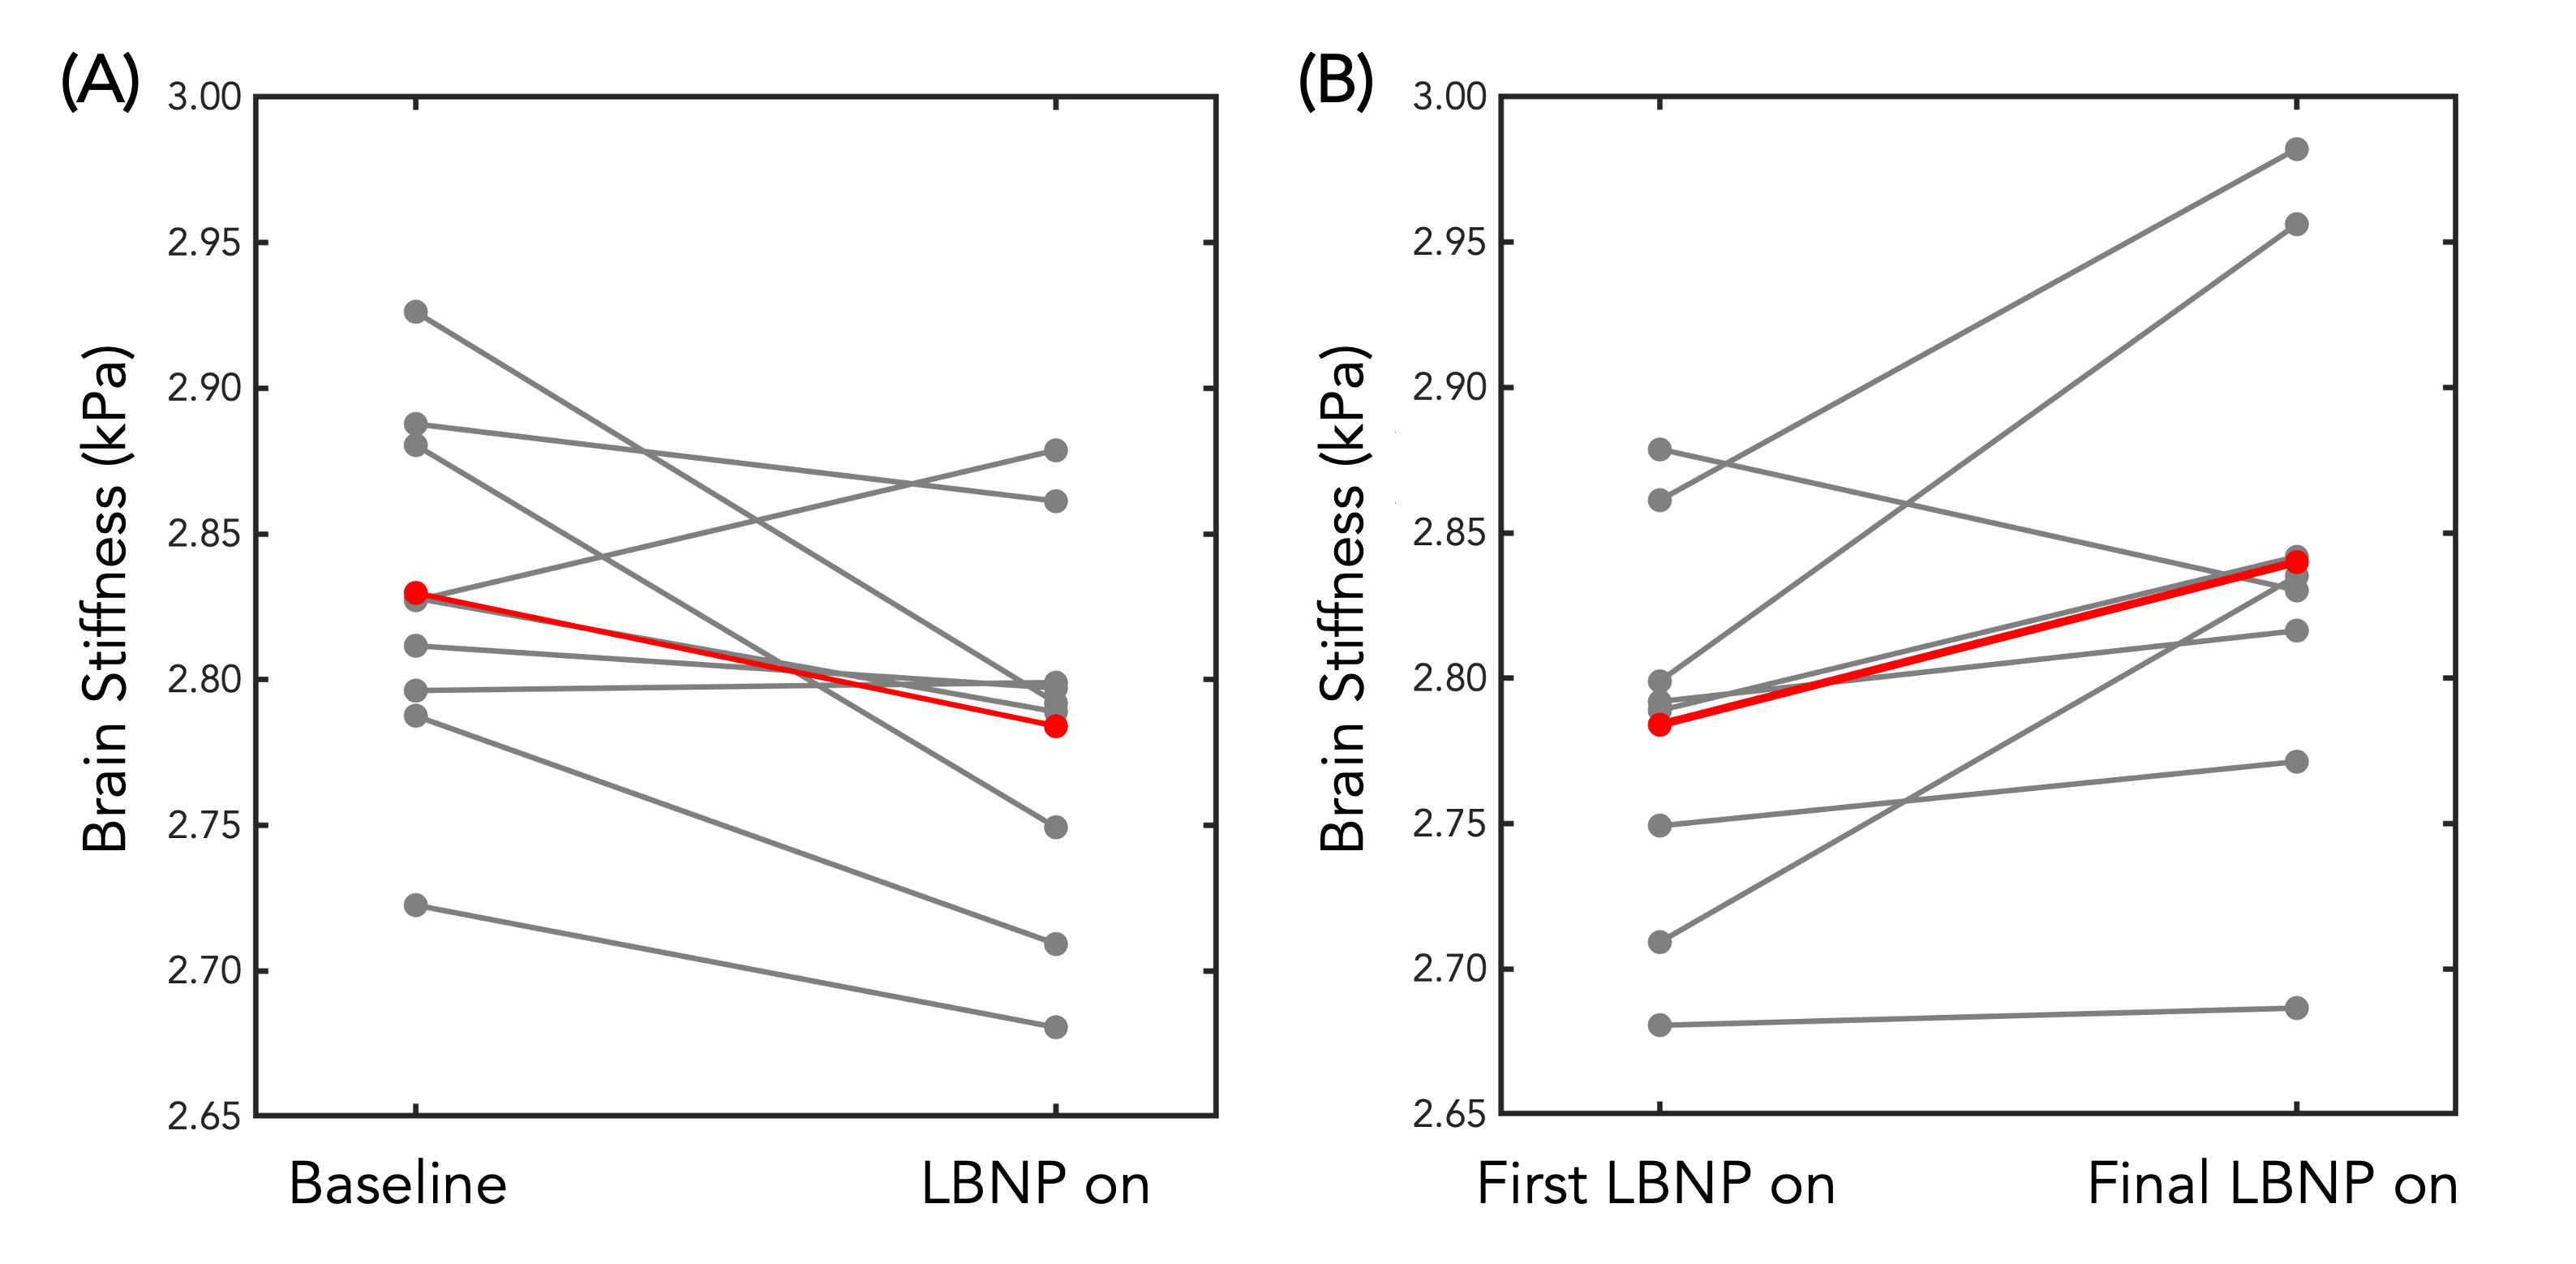
The initial application of LBNP caused an average decrease of 2.28% in whole brain stiffness across all subjects (Figure 2). The softening caused by the initial application of LBNP was followed by a return to nearly the same initial baseline stiffness once the LBNP was turned off. The subsequent applications of LBNP resulted in smaller or negligible decreases in brain stiffness; however, after each subsequent application of LBNP, the next baseline condition showed a notable increase in average brain stiffness. This trend held true for the duration of the scanning protocol and there was an average increase of 3.02% from the first application of LBNP to the last application of LBNP across all subjects (Figure 2). The softening and stiffening effects with serial applications of LBNP can be seen as visible change in the representative slices of Figure 3, and the trends across individual subjects can be seen in Figure 4.Discussion
There are several possible explanations for the stiffening phenomenon that we observed with repeated applications of LBNP. One such explanation is that the stiffening may be due to endothelium-dependent dilation of the cerebral arteries, which may occur in response to a surge of blood entering the brain following the cessation of LBNP. In the peripheral circulation, it has been shown that following a sharp increase in the shear stress of blood vessels due to sudden increase in flow, vasodilation is sustained for several minutes after the blood flow has returned to normal9. This is due to shear-mediated release of vasodilatory molecules from the vascular endothelial cells10. The overall stiffening effect observed with repeated LBNP applications may be due to activation of similar cellular signaling pathways which cause extended cerebrovascular vasodilation leading to acute microstructural changes in the glial matrix.Conclusions
Findings suggest that applied LBNP causes an initial decrease in brain stiffness, which may be related to reduced cerebral blood flow or a drop in intracranial pressure. Future studies will investigate the effects of altered cerebral blood flow during and immediately following LBNP as a possible mechanism for the blunted response to subsequent applications of LBNP. This preliminary study suggests that using LBNP to probe stiffness changes from altered cerebral hemodynamics could be an effective way to investigate the coupling between cerebrovascular function and brain mechanics, which may be indicative of the sensitivity of brain stiffness to cerebrovascular health. Further implications from the effect of blood flow on brain stiffness, and therefore brain function, may be found in the aging population who are known to decline in both cardiovascular health and brain health and stiffness.Acknowledgements
University of Delaware Research Foundation, R01-AG058853, and K01-AG054731.References
1. Goswami, N., Blaber, A. P., Hinghofer-Szalkay, H. & Convertino, V. A. Lower body negative pressure: Physiological effects, applications, and implementation. Physiol. Rev. 99, 807–851 (2019).
2. Bronzwaer, A. S. G. T. et al. The cerebrovascular response to Lower-body negative pressure vs. head-up tilt. J. Appl. Physiol. 122, 877–883 (2017).
3. Brown, C. M., Du, M., Hilz, M. J., Hecht, M. J. & Neundorfer, B. Assessment of cerebrovascular and cardiovascular responses to lower body negative pressure as a test of cerebral autoregulation. J. Neurol. Sci. 208, 71–78 (2003).
4. Arani, A. et al. Acute pressure changes in the brain are correlated with MR elastography stiffness measurements: initial feasibility in an in vivo large animal model. Magn. Reson. Med. 79, 1043–1051 (2018).
5. Herthum, H. et al. Real-Time Multifrequency MR Elastography of the Human Brain Reveals Rapid Changes in Viscoelasticity in Response to the Valsalva Maneuver. Front. Bioeng. Biotechnol. 9, 1–12 (2021).
6. McGarry, M. D. J. et al. Multiresolution MR elastography using nonlinear inversion. Med. Phys. 39, 6388–6396 (2012).
7. Manduca, A. et al. Magnetic resonance elastography: Non-invasive mapping of tissue elasticity. Med. Image Anal. 5, 237–254 (2001).
8. Johnson, C. L. et al. Viscoelasticity of subcortical gray matter structures. Hum. Brain Mapp. 37, 4221–4233 (2016).
9. Thijssen, D. H. J. et al. Assessment of flow-mediated dilation in humans: A methodological and physiological guideline. Am. J. Physiol. - Hear. Circ. Physiol. 300, 2–12 (2011).
10. Ras, R. T., Streppel, M. T., Draijer, R. & Zock, P. L. Flow-mediated dilation and cardiovascular risk prediction: A systematic review with meta-analysis. Int. J. Cardiol. 168, 344–351 (2013).
Figures