2250
Brain stiffness correlates with hematocrit1Berlin Center for Advanced Neuroimaging, Charité - Universitätsmedizin Berlin, Berlin, Germany, 2Institute of Medical Informatics, Charité - Universitätsmedizin Berlin, Berlin, Germany, 3Radiology department, Charité - Universitätsmedizin Berlin, Berlin, Germany
Synopsis
The viscosity of blood scales with the concentration of red blood cells (hematocrit) and potentially influences the viscoelasticity of the perfused tissue. In this study, cerebral MR elastography (MRE) was applied to a group of healthy subjects to analyze the interrelation between mechanical properties of brain tissue and the hematocrit. We found a highly significant positive correlation between in-vivo mechanical properties of cerebral tissue and hematocrit level (p<0.0001).
Introduction
MR elastography (MRE) allows the non-invasive measurement of in vivo brain viscoelastic properties.1 The interaction between tissue microstructure and the macroscopic mechanical state of in vivo tissues offers a variety of quantitative imaging biomarkers for the assessment and better understanding of physiological and pathological processes in the brain. However, the variability of brain stiffness among healthy subjects needs to be better understood in order to further increase the comparability and reproducibility of brain MRE.Recent work provided evidence for a contribution of the micro-vascular architecture to the baseline stiffness of brain tissue.2 Further, it could be shown that changes of viscoelastic properties of human brain tissue are related to microvascular blood viscosity changes.3 The concentration of red blood cells (hematocrit) is the primary factor affecting the viscosity of blood,4 thereby potentially influencing the viscoelasticity of the perfused tissue.
In this study, we use MRE to assess the relationship between blood viscosity on the stiffness of cerebral tissue and expect a globally homogeneous effect due to the uniform distribution of blood over the entire capillary bed of brain tissue.
Methods
Twelve healthy volunteers (mean age 33, range 22-50 years) were investigated. Blood samples were obtained from all subjects for hematocrit quantification directly before the MRE scan. Multifrequency MRE was performed by inducing shear waves in the head at 20, 25, 35, 40 Hz using air drivers5 in a 3-Tesla scanner (Magnetom Lumina, Siemens). Image acquisition was performed using a single-shot spin-echo echo planar imaging (EPI) sequence sensitized to motion by a motion-encoding gradient. Eight phase offsets were recorded in 40 axial slices with 200×200 mm2 field-of-view, 1.6x1.6x2 mm3 voxel size, 70 ms echo time and 4700 ms repetition time.Raw data was corrected for motion and distortion using SPM12. Maps of the shear wave speed (SWS) were reconstructed using the 2D phase-gradient based k-MDEV inversion6 with brain adapted pre-processing.7 Wave images were decomposed in eight propagation directions. Smoothing and suppression of compression waves was done using a bandpass Butterworth filter of third order with highpass threshold of 15/m and lowpass threshold of 250/m.
For further analysis, SWS maps were normalized to the MNI space to fit the dimensions of the Neuromorphometrics atlas delivered by SPM12. The tissue probability map of CSF was used to eliminate voxels in the vicinity (within a radius of 1.5 mm) of CSF in order to avoid partial volume effects. Those regions with more than 30% of all voxels preserved for all subjects were used for further analysis. A linear regression model of regional tissue stiffness included the participants‘ hematocrit level as covariate of interest and their age and a constant as covariates of no interest.
Results
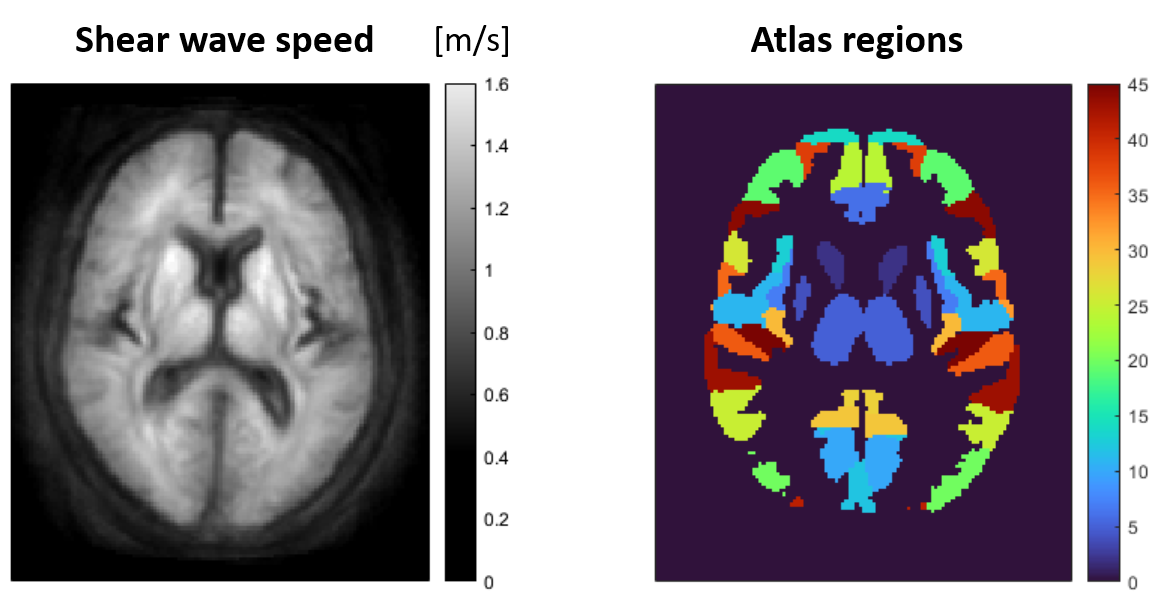
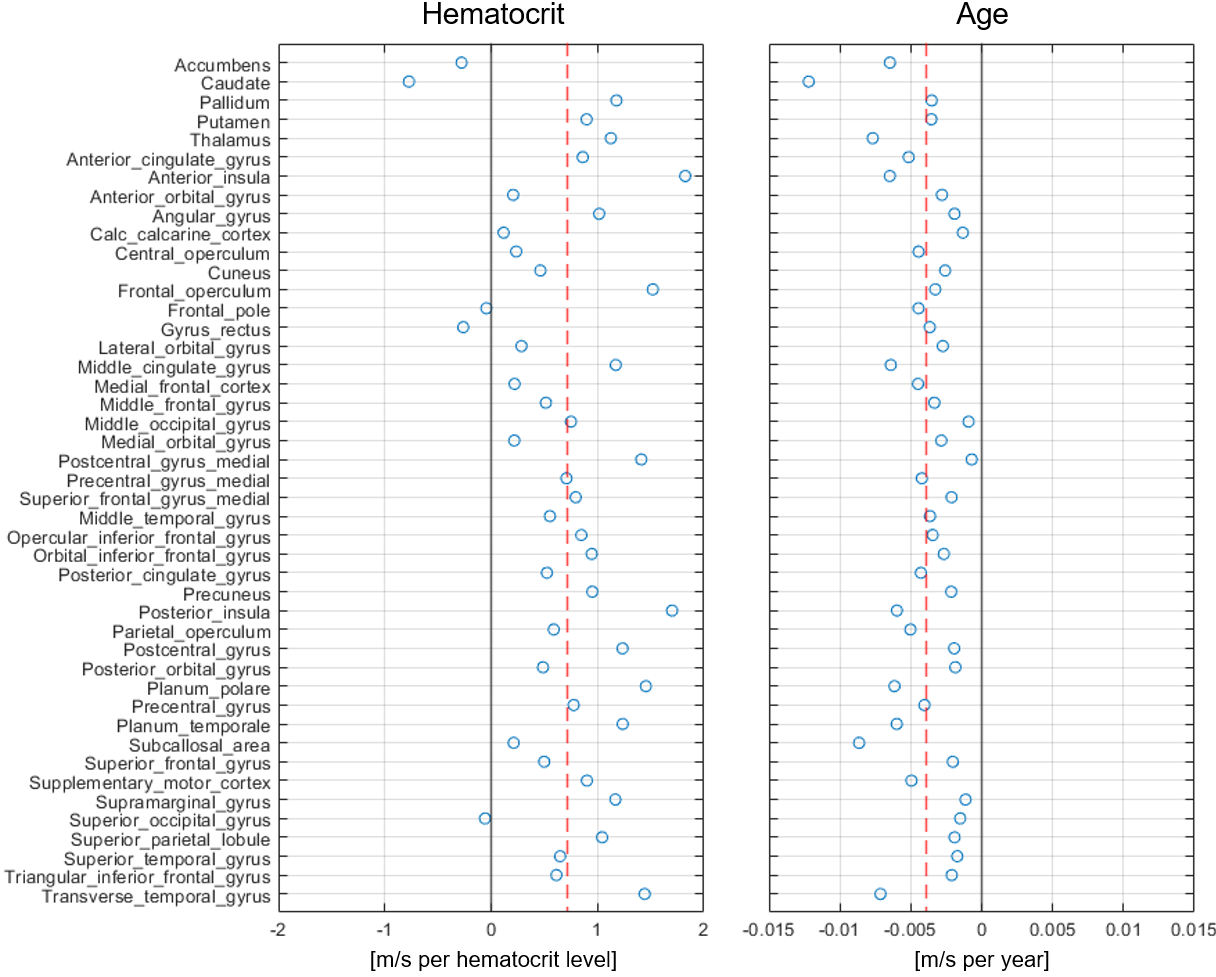
Figure 1 shows the group-averaged stiffness maps (as represented by the shear wave speed) of one representative axial slice through the brain and the corresponding atlas regions. 45 gray matter regions fulfilled the criterion of minimum >30% voxels preserved and were used for the regression analysis across subjects. The average SWS across atlas regions was (1.06±0.13) m/s.The measured individual hematocrit levels ranged from 0.39 to 0.48.Figure 2 depicts the stiffness change per hematocrit level and age resulting from the linear regression model. Across brain regions, a significant increase of SWS of +(0.0071±0.0055) m/s per percent hematocrit (p=2.4×10⁻¹¹) was observed. This corresponds to a relative stiffness reduction of (0.7±0.5)% per percent hematocrit. The ageing effect on SWS was -(0.0039±0.0023) m/s per year (p=3.9×10⁻¹⁵) or -(0.4±0.2)% per year, respectively.
Discussion
Our results provide evidence for a significant contribution of the blood composition on the viscoelasticity of cerebral tissue, i.e. the red blood cell concentration that scales with blood viscosity. A highly significant positive correlation between the hematocrit and the stiffness of cortical tissue was found using a regression model with age as a variable of no-interest. This statistical analysis further enabled the verification of the well-known effect of cerebral stiffness reduction with age in agreement with literature values of about 0.5% per year.8,9The sensitivity of MRE to detect stiffness changes of a few percent interferes with the individual variability of hematocrit when considering the stiffness change of about 1% per percent hematocrit level found in this study. Future work with more subjects will be needed, e.g., to analyze gender or diurnal rhythm effects and to increase the sensitivity for identifying brain regions potentially showing elevated hematocrit effects.
As our results provide evidence for a significant contribution of the blood composition to brain tissue viscoelasticity, we hypothesize that cerebral MRE might be sensitive to subtle microstructural tissue damage associated with diseases showing abnormal rheological behavior, i.e. increased blood viscosity that is linked to inflammatory activity10 or disruption of the blood brain barrier.11
Acknowledgements
Funding from the German Research Foundation (GRK 2260 BIOQIC, SFB1340 Matrix in Vision, #276880906) and from the European Union’s Horizon 2020 Program (ID 668039, EU FORCE – Imaging the Force of Cancer) is gratefully acknowledged.References
1. Muthupillai et al., Science 1995; 269: 1854–1857
2. Hetzer et al., JCBFM 2018; 38:116–125
3. Hetzer et al., JCBFM 2019; 39:2445–2455
4. Wells et al., J Clin Invest 1962; 41:1591–1598
5. Schrank, JCBFM 2020; 40:991-1001
6. Tzschätzsch et al., Med Image Anal 2016; 30:1-10
7. Herthum et al., ISMRM 2021; #1023
8. Sack et al., Neuroimage 2009; 46:652-657
9. Hiscox et al., Neuroimage 2021; 232:117889
10. Pop et al., Neth Heart J 2002; 10:512–516
11. Silva et al., Front Neurosci 2021; 15:701308
Figures