2242
MR Elastography of short T2 samples with Optimal Control-based RF pulses demonstrated on Achilles tendon1Univ Lyon, INSA-Lyon, Inserm, UCBL1, CNRS, CREATIS, UMR 5220, U1294, F-69621, Lyon, France, 2CPE Lyon, Département Sciences du Numérique, Lyon, France, 3Univ Lyon, CarMen Laboratory, INSERM, INRA, INSA Lyon, Université Claude Bernard Lyon 1,69495, Lyon, France, 4Hospices Civils de Lyon, Département Endocrinologie, Diabète et Nutrition, Hôpital Lyon Sud, 6949, Lyon, France
Synopsis
Magnetic Resonance Elastography (MRE) allows the quantitative characterization of mechanical properties of tissues based on the properties of shear wave propagation. MRE uses mostly oscillating motion encoding gradients (MEGs) to encode motion. Their presence involves long echo times, limiting the application of MEGs to very short T2 tissues. RF pulses designed with an optimal control (OC) algorithm applied with a constant gradient can simultaneously perform slice selection and motion encoding, enabling short echo times. In this study, we used OC pulses to mechanically quantify by MRI for the first time a very short T2 tissue such as the Achilles tendon.
Introduction
Characterizing biological tissues having short T2s is an actual challenge in MRI. Some dedicated pulse sequences enabling short TEs have been developed such as UTE. Most MRI applications use magnitude images. However, phase images can contain important information about the characteristics of tissues. Magnetic Resonance Elastography (MRE) uses phase images to non-invasively quantify mechanical properties of biological tissues1. MRE usually uses oscillating motion encoding gradients (MEGs) placed between the RF excitation and the readout gradient, resulting in TEs too long to encode motion in very short T2 tissues. A novel motion encoding strategy consisting in applying RF pulses optimized through an Optimal Control (OC) algorithm with a constant gradient was shown to be relevant by improving phase to noise ratio by reducing TE2. However, questions remained concerning the relevance of this approach when T2 values were smaller than the pulse duration. Here, we applied this strategy to encode motion on very short T2 samples on phantom and ex vivo experiments.Methods
The application of OC to MRE has been recently well described3. The OC algorithm computes via Bloch equations, the control parameter (RF pulse) to manipulate the magnetization from the equilibrium state towards a desired target state. Some parameters appearing in Bloch equations such as T2 must be defined. Indeed, relaxation times are taken into account during the optimization process. This is crucial in the case of short T2 because the pulse has to deal with the rapid loss of phase coherence to maximize the transverse magnetization. OC pulses are applied with a constant gradient $$$G_z$$$ to perform slice selectivity4 while a shear wave of amplitude A and frequency $$$f$$$ induces static field variations given by $$$\Delta B_{0_{(i,j)}}(t)=G_z(Asin(2\pi ft+\theta_{(i)})+z_{(j)})$$$, where $$$z_{(j)}$$$ represents the magnetization (i,j) location in the slice and $$$\theta_{(i)}$$$ the motion initial phase. Targets states describe a classical MRE phase pattern while maximizing the transverse magnetization inside the slice ($$$\Delta z_{in}$$$) and minimizing it outside ($$$\Delta z_{out}$$$). The magnetization phase is thus related to the phase in the oscillatory motion:$$\overrightarrow{T}_{(i,j)}=(sin(cos\theta_{(i)}),cos(cos\theta_{(i)}), 0)\;if\; z_{(j)}\in\Delta z_{in}$$
$$\overrightarrow{T}_{(i,j)}=(0,0,1) \;if\; z_{(j)}\in\Delta z_{out}$$
Acquisitions were performed on a preclinical 7T MRI scanner (BioSpec Bruker), with a quadrature 72mm inner diameter volume coil in transmit/receive mode. Phantom experiments were carried on a bi-layer agar (2%) cube doped with 1 and 5 mM MnCl2 concentrations. Ex vivo experiments were carried on a bovine Achilles tendon (AT) embedded in agar (2%). Relaxation times measured using a RARE sequence with different TEs and TRs were: [T1,T2]1mM=[94,4.9]ms, [T1,T2]5mM=[28,1.3]ms, [T1,T2]AT=[988,1]ms. A piezoelectric actuator (CEDRAT) was used as mechanical transducer driver.
Two OC pulses were computed for two different excitation frequencies. Their optimization parameters are summarized in Table 1.
OC pulses were applied in UTE and RARE sequences. MRE sequences with classical MEGs were also realized. Acquisition parameters are summarized in Table 2. Acquisitions with and without motion were also acquired. Two acquisitions with inversion of the wave polarity were done for phase images subtraction to remove static phase offsets.
Phase-to-Noise ratios (PNR) were calculated to compare the motion encoding efficiency of the different sequences in both samples. Phase encoding is defined as the difference of the maximal and minimal phase encoded in a same pixel along time. Then, the PNR is defined as the ratio between the average value (over all pixels inside a ROI) of the phase encoding in presence of mechanical excitation (∆) and the phase noise, defined as the average value of the phase encoding in the absence of motion (σ): PNR=∆/σ. The mean and standard deviation of shear storage modulus G’ were computed with a Helmholtz equation inversion algorithm for comparison.
Results
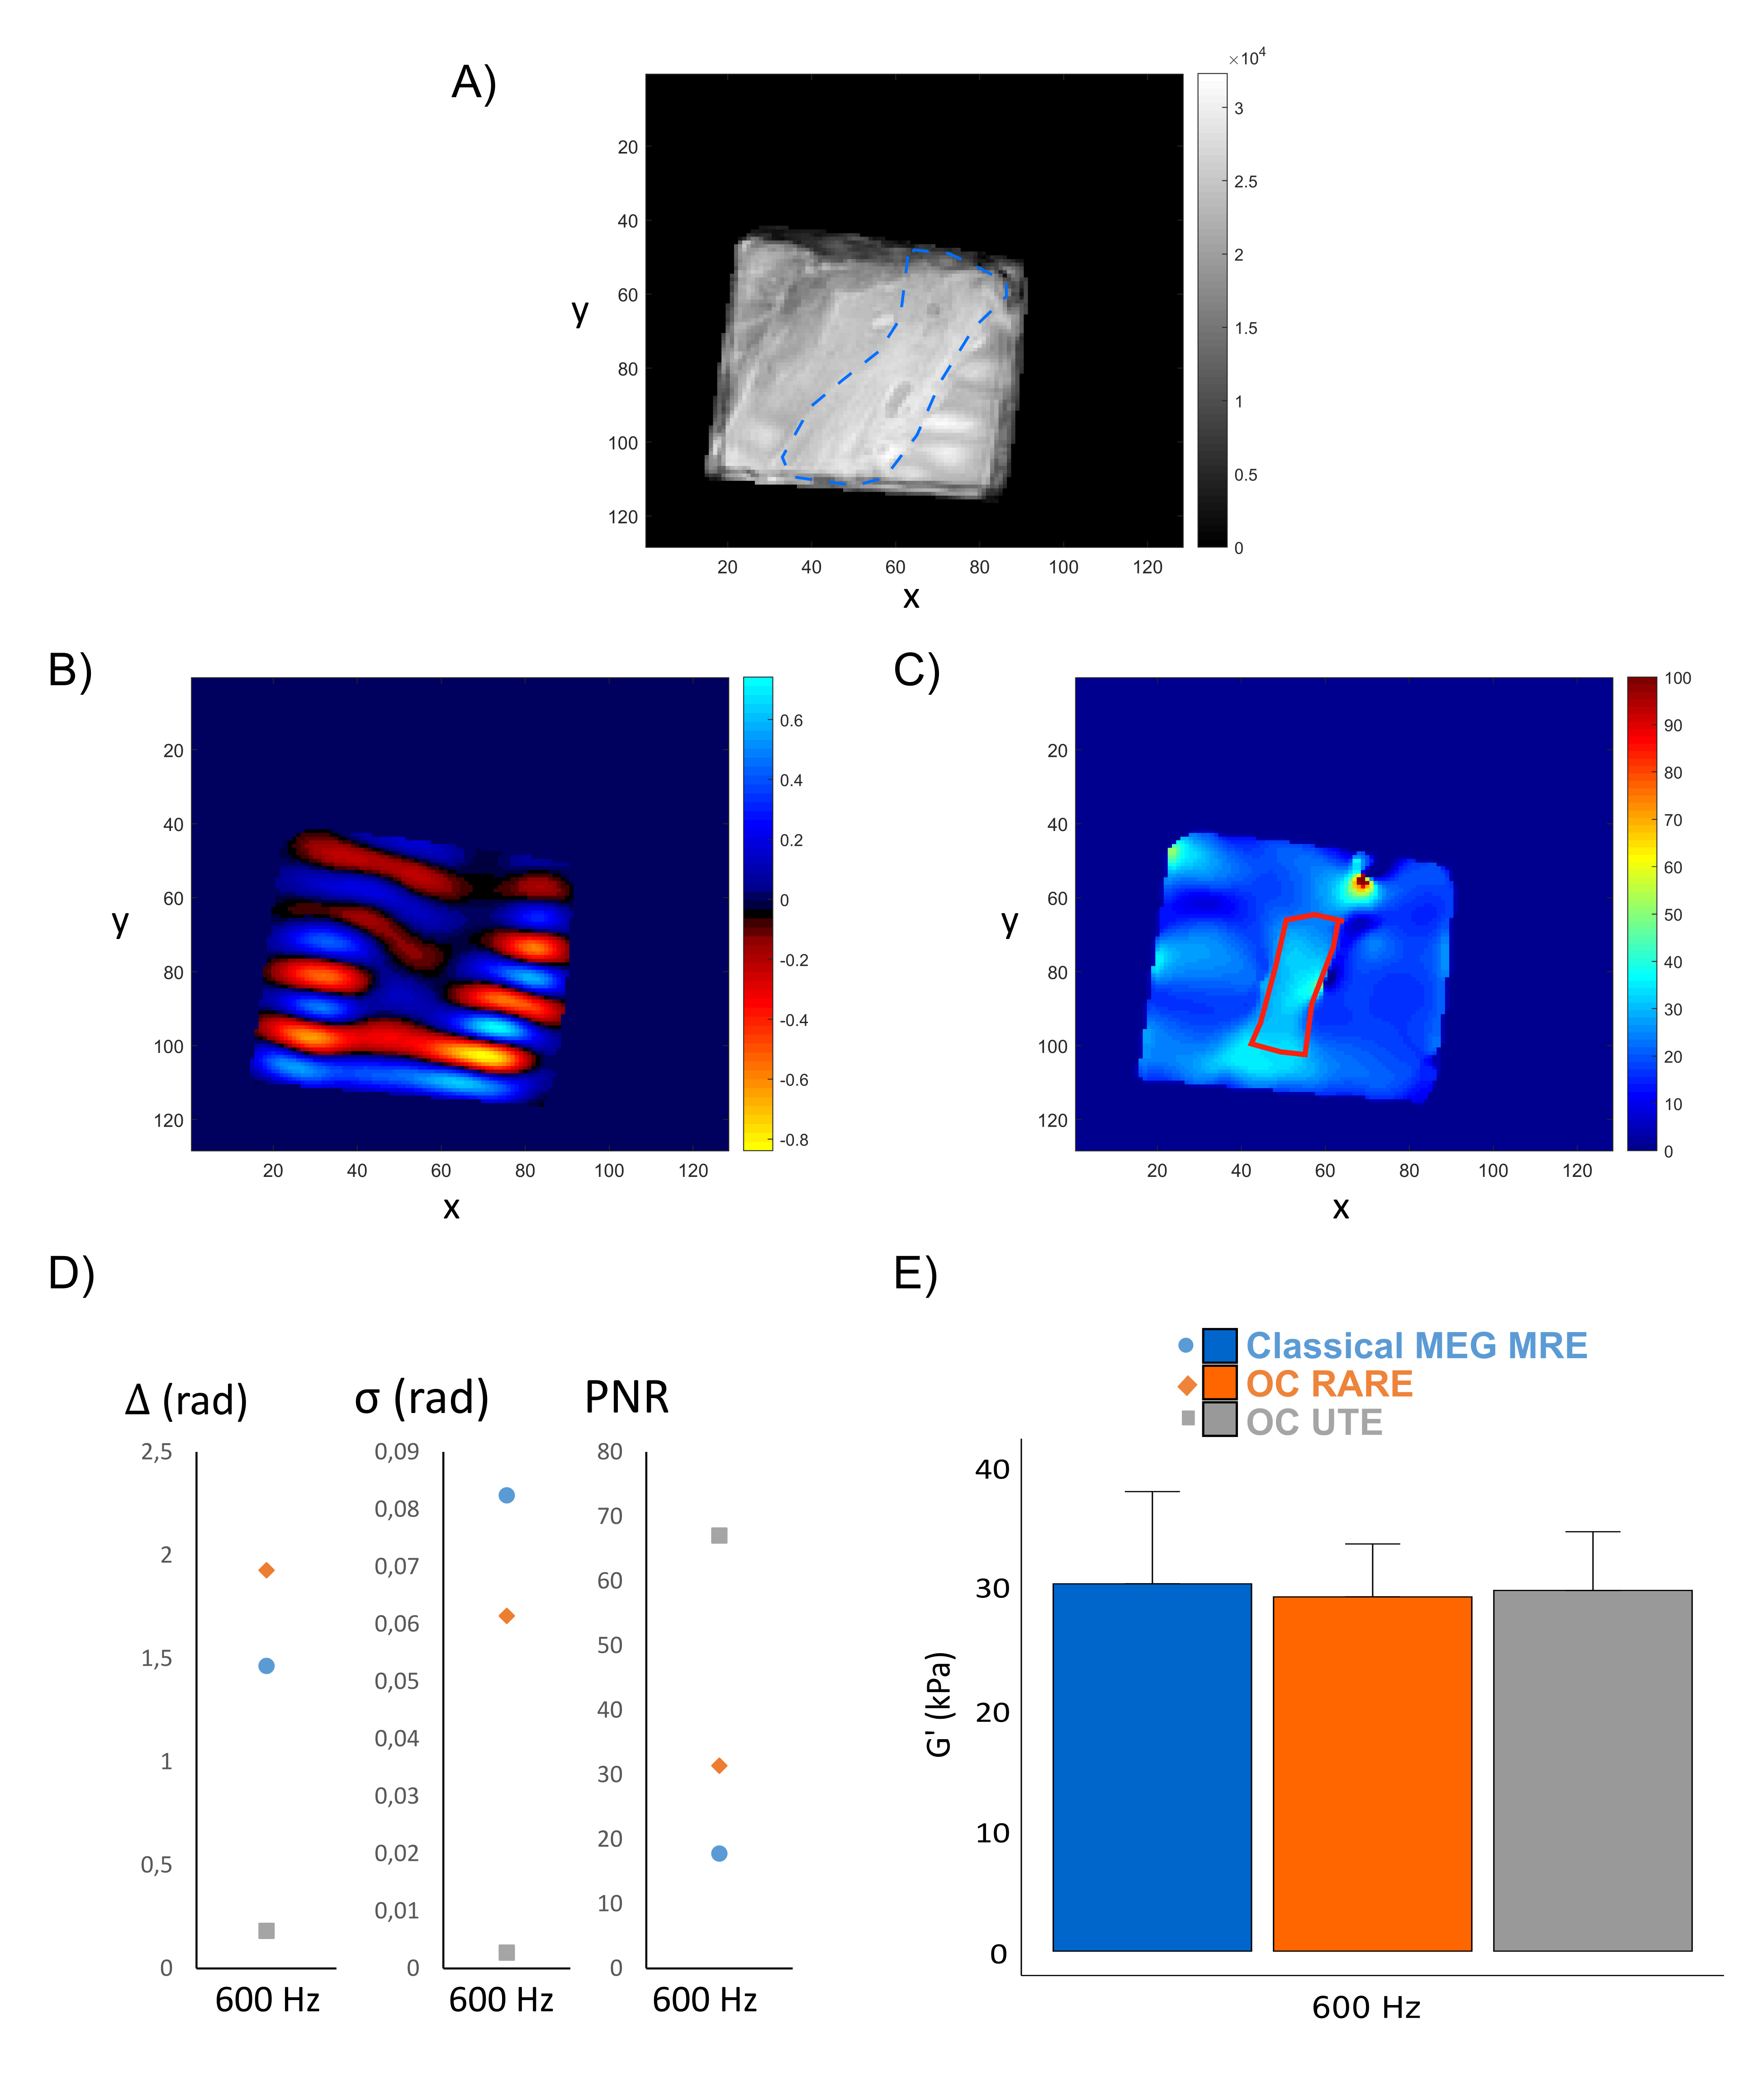
Figure 1 shows magnitude and phase images as well as the elastograms of the phantom with the different used sequences at 600 Hz. The layer of 5 mMMnCl2 concentration (i.e. the smallest T2) is only visible in magnitude images obtained with the OC-UTE sequence since it has the shortest TE. Phase is however encoded with both the OC-RARE and OC-UTE sequences. Figure 2 compares results in both layers in terms of motion encoding efficiency (Figures 2A,B) and G’ (Figure 2C,D). Best PNRs are found with the OC-UTE sequence and G’ of the 5 mMMnCl2 concentration can only be reconstructed with the OC strategies.Figure 3 shows results obtained on the Achilles tendon (AT) at 600 Hz. Figure 3A displays the magnitude image obtained with the OC-UTE sequence. MEGs-classical MRE and OC-RARE sequences had longer echo times compared to the T2AT, yielding weak signals in most of the parts of the AT. Figures 3B and 3C show the phase image and the G’ elastogram of the OC-UTE sequence respectively and Figure 3D and Figure 3E compare results in terms of motion encoding efficiency and G’, respectively. The OC-UTE sequence presents again the best PNR.
Conclusion
Only the OC-UTE sequence could encode motion in very short T2 samples yielding magnitude images enabling proper visualization of them. OC-UTE produced the best PNRs and could be a valuable tool to explore both the anatomy5 and the mechanical properties of the Achilles tendon. Further studies are needed to confirm its applicability in vivo.Acknowledgements
This work was performed within the scope of LABEX PRIMES (ANR-11-LABX-0063). Experiments were performed on the PILoT facility, part of the France Life Imaging infrastructure (ANR-11-INBS-0006).References
1. Muthupillai R, Lomas D, Rossman P, Greenleaf J, Manduca A, Ehman R: Magnetic resonance elastography by direct visualization of propagating acoustic strain waves. Science 1995; 269:1854–1857.
2. Sango Solanas P, Tse Ve Koon K, Van Reeth E, Caussy C, Beuf O. Ultra-short echo time Magnetic Resonance Elastography. In: Proc Int Soc Magn Reson Med; 2020; Abstract 168.
3. Lefebvre PM, Van Reeth E, Ratiney H, et al. Active control of the spatial MRI phase distribution with optimal control theory. Journal of Magnetic Resonance. 2017;281:82-93. doi:10.1016/j.jmr.2017.05.008
4. Van Reeth E, Lefebvre PM, Ratiney H, et al. Constant gradient elastography with optimal control RF pulses. Journal of Magnetic Resonance. 2018;294:153-161. doi:10.1016/j.jmr.2018.07.013
5. Dallaudière B, Trotier A, Ribot E, et al. Three-dimensional ultrashort echo time (3D UTE) MRI of Achilles tendon at 4.7T MRI with comparison to conventional sequences in an experimental murine model of spondyloarthropathy. Journal of Magnetic Resonance Imaging. 2019;50(1):127-135. doi:10.1002/jmri.26569
Figures
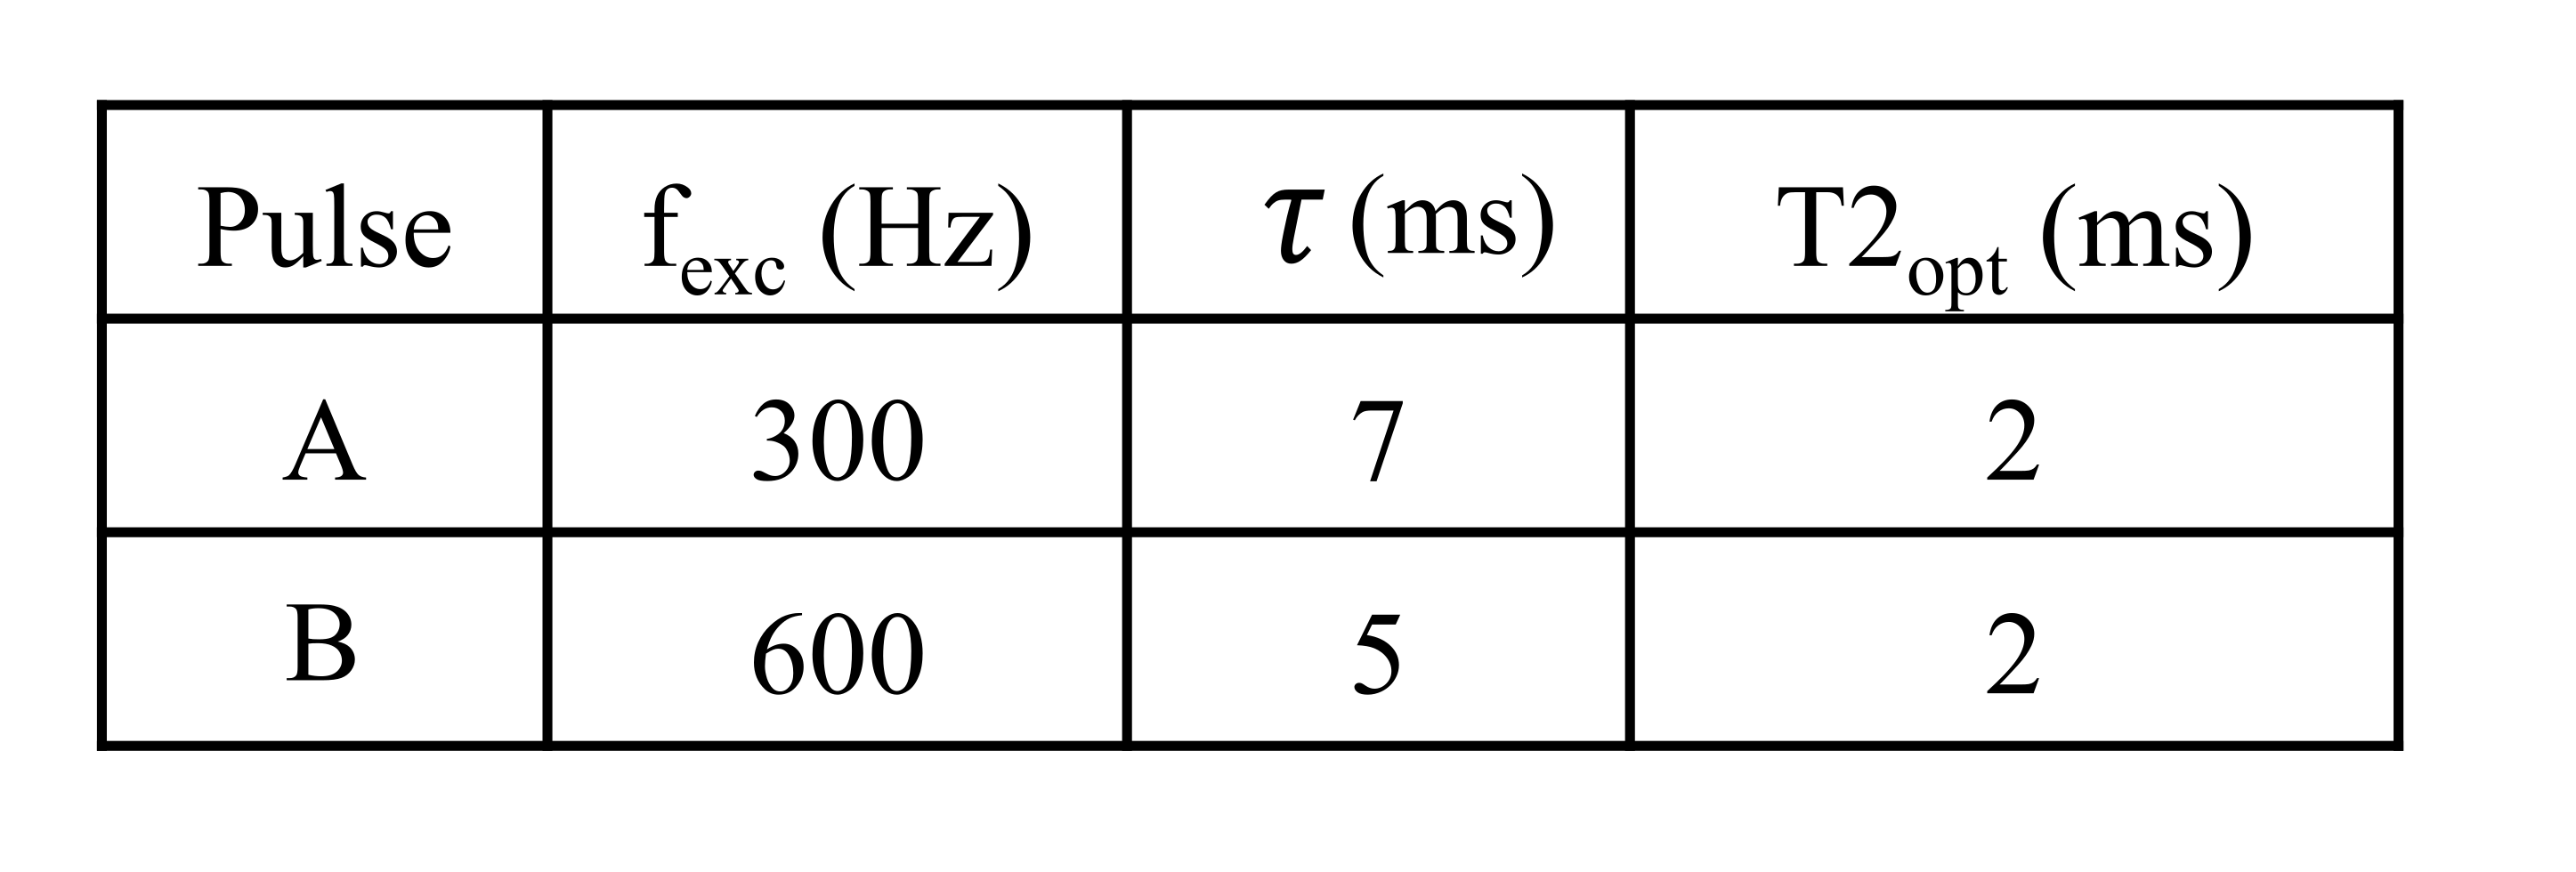
Table 1. Optimization parameters of the different OC pulses. Common parameters to both OC pulses were: pulse amplitudes |ux| bounded to 94 μT, slice bandwidths Δfin of 7 kHz, which corresponds to a 1mm slice with a gradient amplitude Gz=164 mT/m. Variable parameters were: excitation frequency fexc, pulse duration τ and T2.
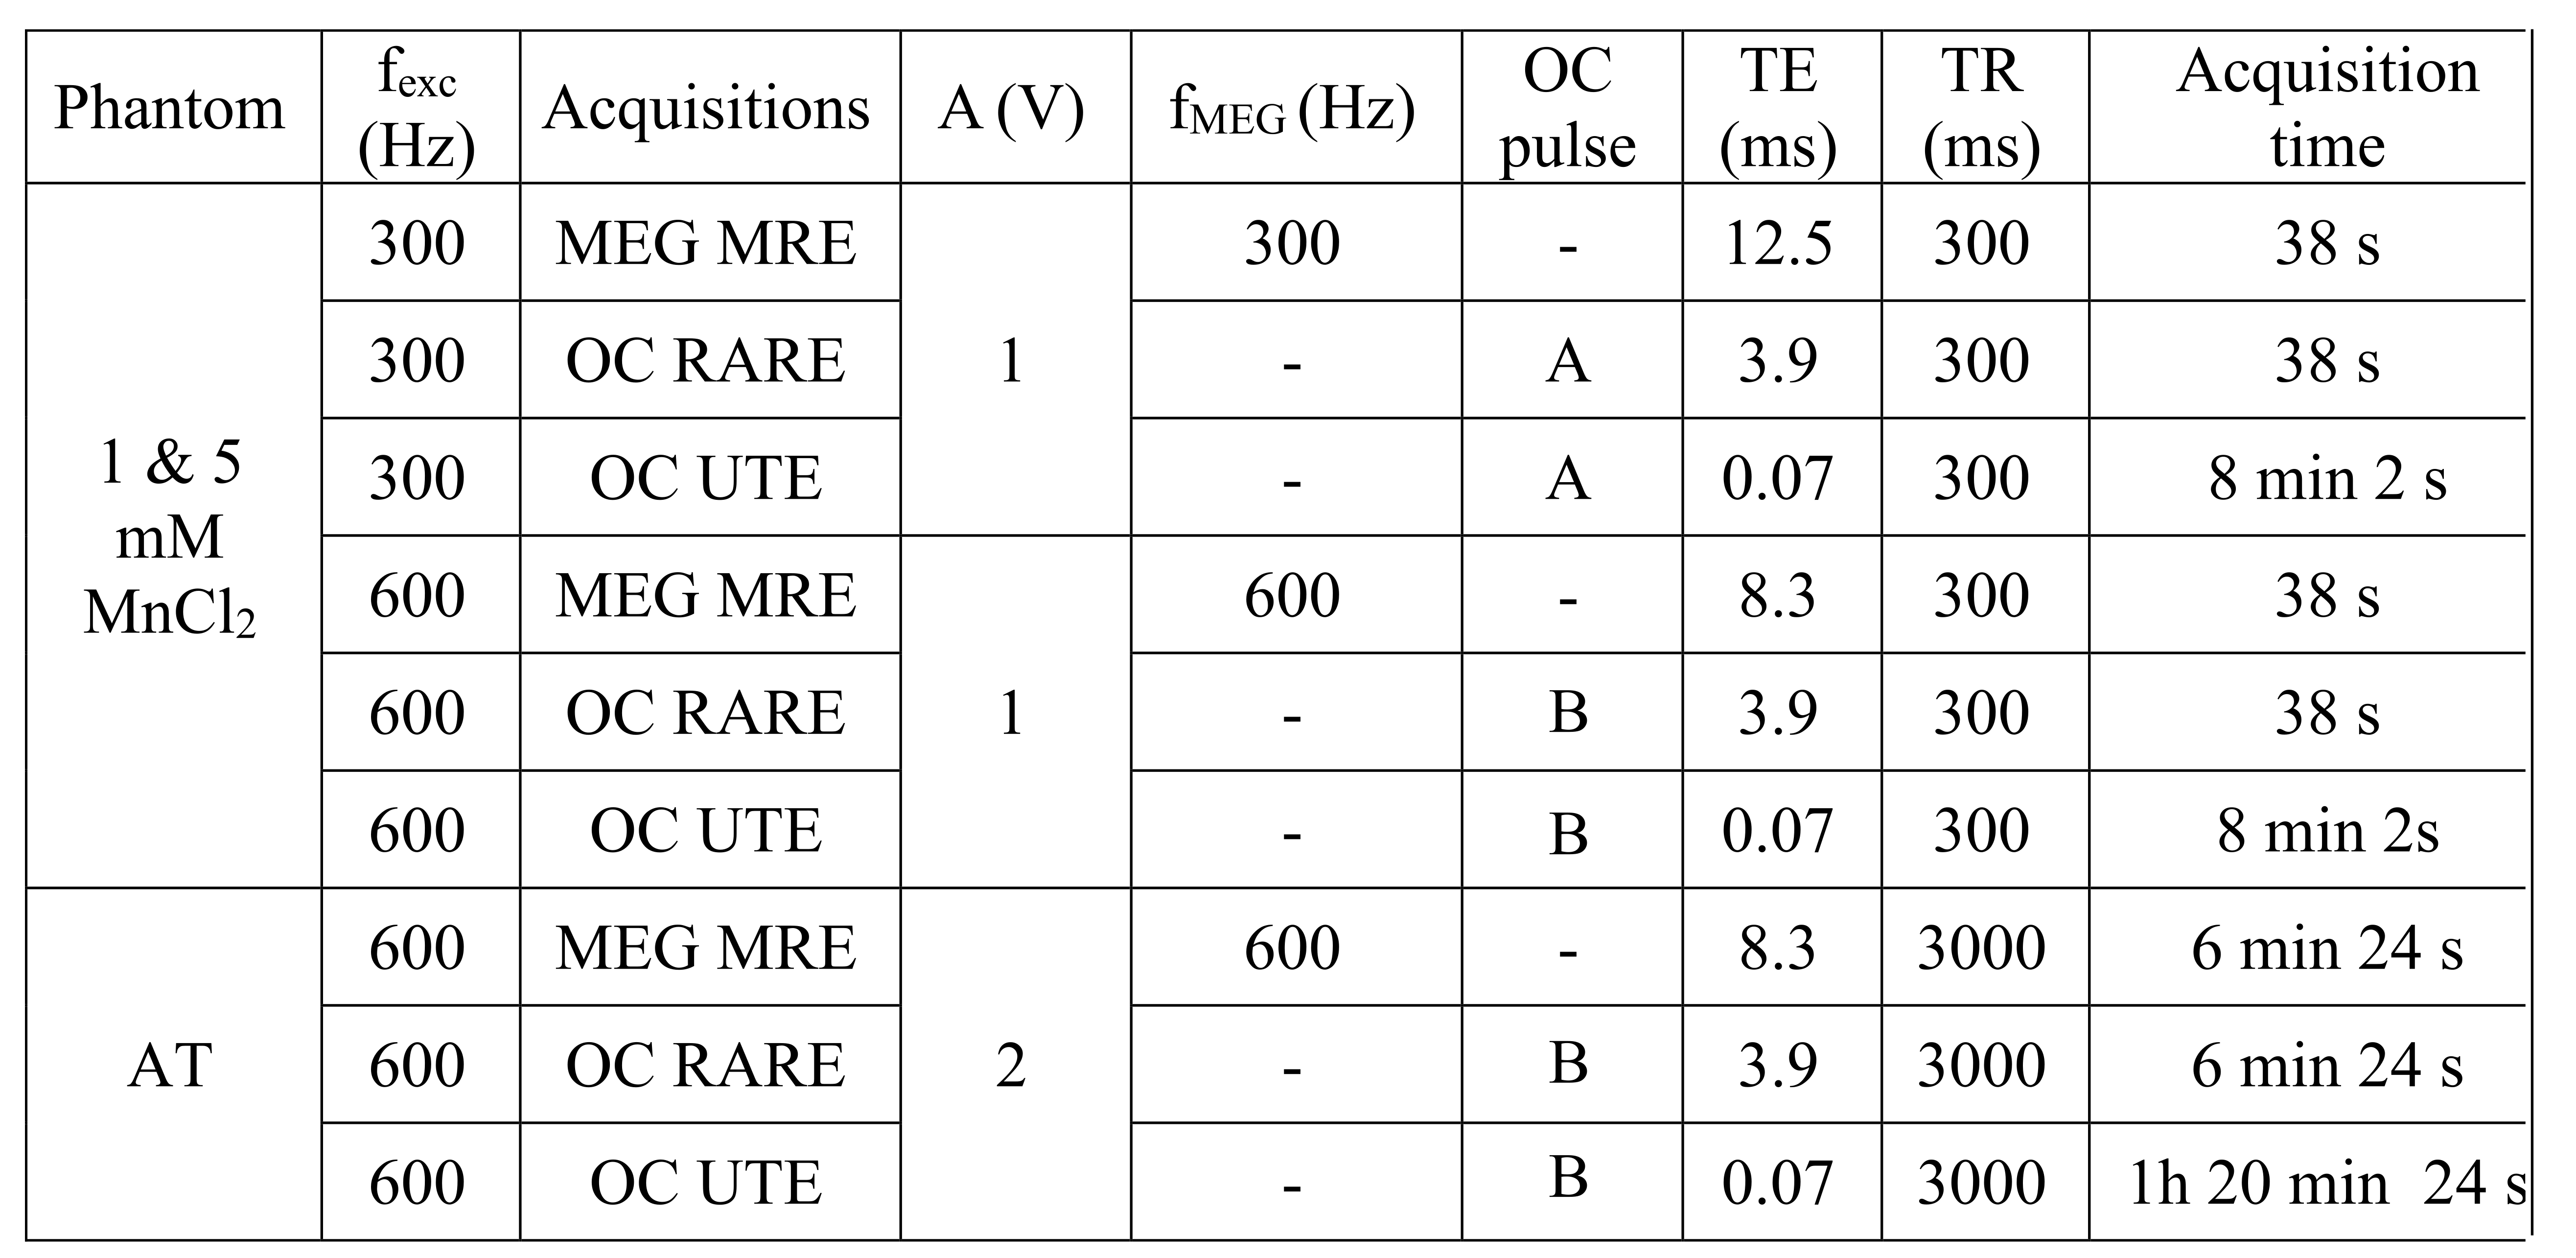
Table 2. Pulse sequence parameters established for the acquisitions of every sample with the different methods. Geometry parameters were matrix of 128 x 128 pixels and FOV of 70 x 70 and 60 x 60 mm² for the phantom and ex vivo acquisitions, respectively. The MnCl2 phantom was characterized at 300 and 600 Hz. The AT was only characterized at 600 Hz.
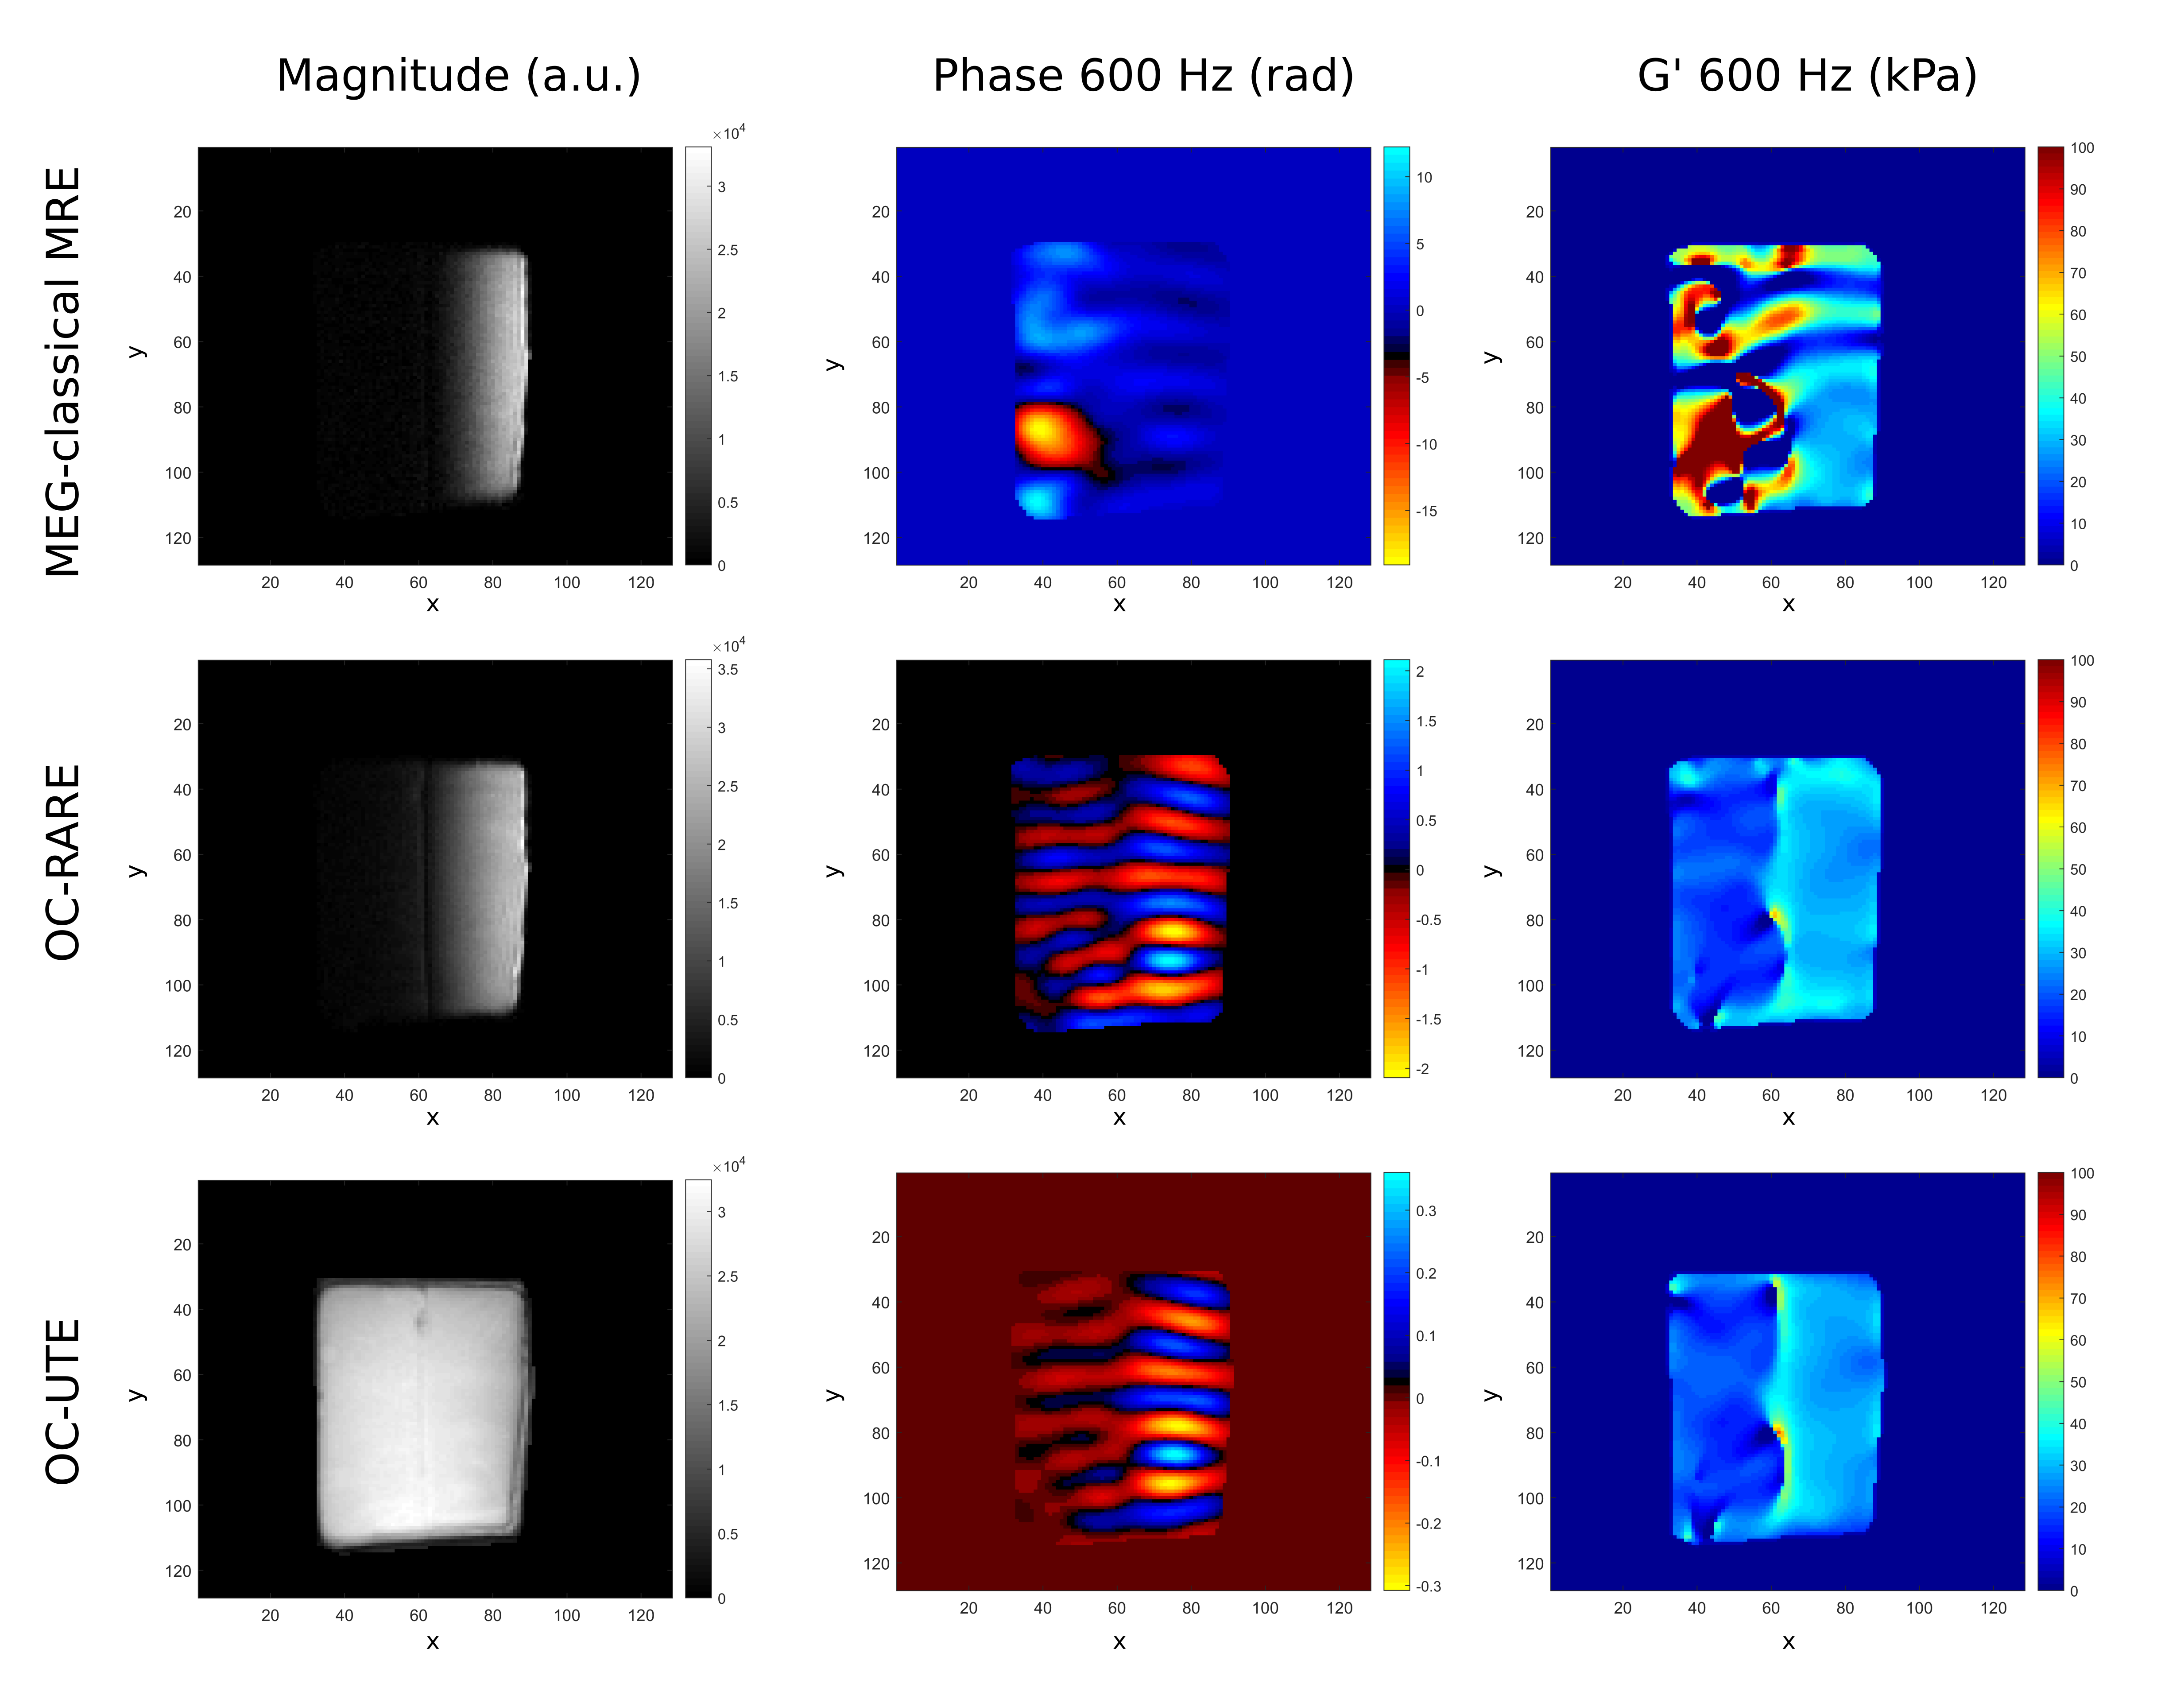
Figure 1. Magnitude (left column), phase (middle column) and shear storage modulus G’ (right column) images obtained at 600 Hz with the different sequences: MEG-classical MRE (top row), OC-RARE (middle row) and OC-UTE (bottom row). For the OC sequences, pulse B was used.
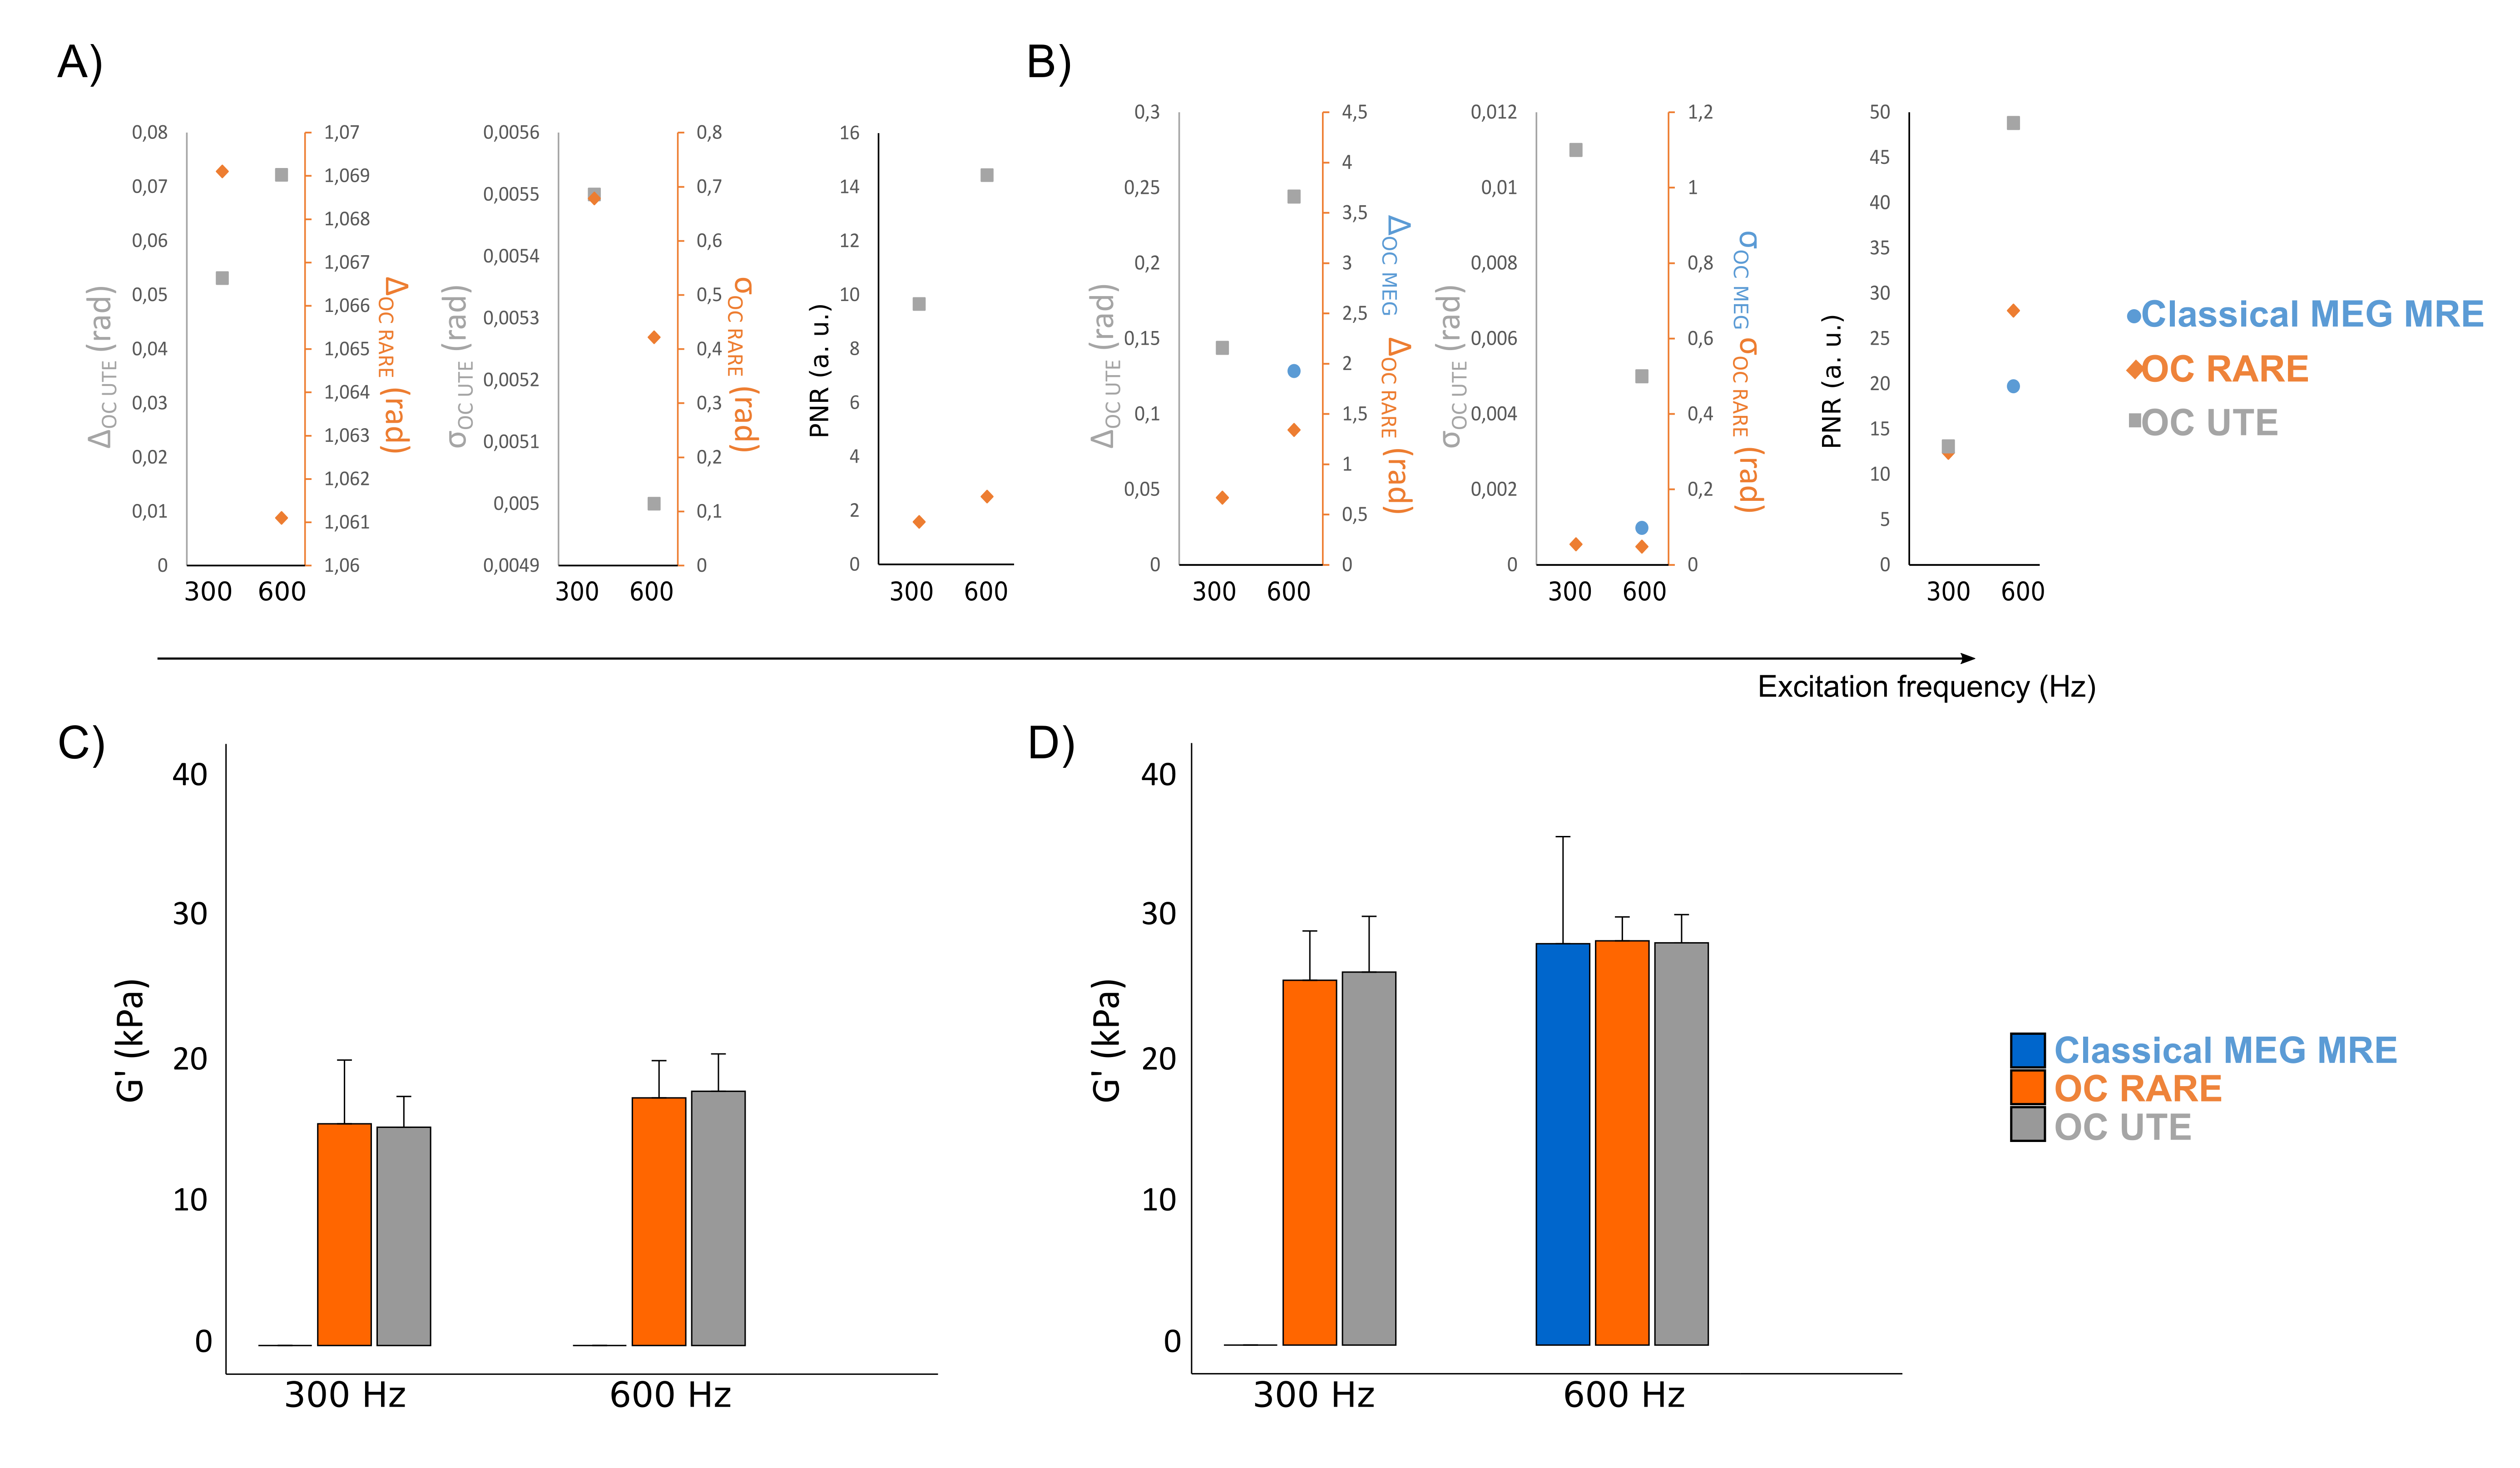
Figure 2. Results of phase encoding Δ , phase noise σ and Phase-to-Noise ratio PNR obtained with the different acquisitions at multiple frequencies on the A) 5 mM and the B) 1 mM MnCl2 concentration layers. Note that two vertical axis are showed in phase encoding and phase noise plots. Mean values and standard deviation of the shear storage modulus G’ obtained for all the excitation frequencies with the different sequences on the C) 5 mM and the D) 1mM MnCl2 concentration layers.