2241
Breathing task paradigm to improve the quality of pancreatic Magnetic Resonance Elastography
Nienke P.M. Wassenaar1, Anne-Sophie van Schelt1, Eric M. Schrauben1, Rémi van der Woude2, Jamila E. de Jong2, Jules L. Nelissen1, Hanneke W.M. van Laarhoven3, Jing Guo4, Ingolf Sack4, Jurgen H. Runge1, Aart J. Nederveen1, and Jaap Stoker1
1Radiology and Nuclear Medicine, Amsterdam University Medical Centers, University of Amsterdam, Amsterdam, Netherlands, 2University of Twente, Enschede, Netherlands, 3Department of Medical Oncology, Cancer Center Amsterdam, Amsterdam University Medical Centers, University of Amsterdam, Amsterdam, Netherlands, 4Department of Radiology, Charité - Universitätsmedizin Berlin, corporate member of Freie Universität Berlin, Humboldt-Universität zu Berlin, and Berlin Institute of Health, Berlin, Germany
1Radiology and Nuclear Medicine, Amsterdam University Medical Centers, University of Amsterdam, Amsterdam, Netherlands, 2University of Twente, Enschede, Netherlands, 3Department of Medical Oncology, Cancer Center Amsterdam, Amsterdam University Medical Centers, University of Amsterdam, Amsterdam, Netherlands, 4Department of Radiology, Charité - Universitätsmedizin Berlin, corporate member of Freie Universität Berlin, Humboldt-Universität zu Berlin, and Berlin Institute of Health, Berlin, Germany
Synopsis
Free-breathing acquisition of pancreatic MR elastography can potentially introduce errors in stiffness reconstruction. In this study, breathing tasks are introduced during interleaved and reversed slice order MRE acquisition to determine if the quality of MRE increases. The shear-wave speed and octahedral shear strain signal-to-noise-ratio in the pancreas did not significantly change when using breathing tasks. However, the stability of the pancreas location over time increases when using breathing tasks combined with reversed slice ordering as well as the octahedral shear strain signal-to-noise-ratio in the whole abdomen. Future research should focus on comparing shear-wave speed reproducibility of both MRE methods.
Introduction
Pancreatic MR Elastography (MRE) can detect viscoelastic changes in the course of pancreatitis or pancreatic cancer1,2. Both breath-hold and free-breathing (FB) MRE is possible, the latter preferable in sick patients unable to suspend their breath multiple times. However, FB-MRE acquisition can lead to a mismatch in pancreatic location over multiple phase-offsets, potentially introducing errors in stiffness reconstruction.Using a breathing task (BT) paradigm timed such that MRE acquisition for a given slice occurs during the same respiratory phase could potentially increase MRE quality without limiting the temporal and spatial resolution. We investigated the impact of BTs on pancreatic MRE by evaluating the pancreatic location over multiple phase-offsets. Furthermore, the influence of BTs on the octahedral shear strain signal-to-noise-ratio (OSS-SNR) and shear-wave speed (SWS) was determined.
Methods
Study protocol:Nine healthy volunteers (♂=3,♀=6, mean age 27±2 years) were included. Subjects fasted four hours prior to MRI examination. BTs were created in ePrime (version 3.0,PST Inc.,Sharpsburg,PA,USA) and followed a natural breathing pattern(Figure 1). The breathing period was equal to TR and phase-offset delay, and instructions were synchronized with the sequence using a TTL pulse. This way, each slice with varying phase-offset is acquired at the same respiratory phase.
MRI measurements:
Multi-slice multi-frequency spin-echo echoplanar imaging (SE-EPI) MRE images were acquired with a 3.0T MRI scanner (R.5.7.1.1,Ingenia,Philips,Best,the Netherlands). Mechanical vibrations were introduced using four compressed-air driven MRE transducers at four vibrational frequencies (MREfreq=30,40,50,60Hz)2. Motion encoding gradients (MEG) were applied along three orthogonal directions. Three different MRE acquisitions were recorded(Table 1). In FB-MRE scans, no BTs were displayed and standard interleaved slice ordering was used. For the two MRE scans using synchronized BTs, interleaved (BT-Int) and reversed central slice ordering (BT-Rev) were performed(Figure 1). BT-Rev was used to test if central slices containing the pancreas within the multi-slice acquisition were scanned during end-expiration.
Analysis and statistics:
To determine the stability of the pancreas location over phase-offsets for the three MRE scans, the pancreas was manually delineated in three slices aimed at head, body and tail on the magnitude MRE images for eight phase-offsets at 30 and 50 Hz. The mean dice similarity coefficient (DSC) of all combinations of the regions of interest (ROI) of all three slices was calculated. To test for differences between BT-Int and BT-Rev, the DSC for each slice was compared. Magnitude images of BT-Int and BT-Rev were visually compared to investigate the influence of slice order on image quality.
The whole pancreas was delineated on mean magnitude MRE images (mean over phase-offsets, MEG directions, frequencies). These ROIs were used to determine the pancreatic OSS-SNR and pancreatic SWS which was calculated with kMDEV inversion3. The OSS-SNR was also calculated over the whole abdomen. Repeated measures ANOVA with pairwise comparison and Bonferroni correction was used for statistical analysis. Image analysis and statistical analysis were performed in Matlab (R2021a,Mathworks,Natick,MA,USA) and SPSS (version 26,IBM,Armonk,NY,USA).
Results
Mean values of DSC, SWS and OSS-SNR are shown in Table 2. Compared with FB, DSC was significantly higher for BT-Rev (p=0.026), while no significant difference was found for DSC between BT-Int and BT-Rev or FB and BT-Int. No significant differences were found between the MRE scans for pancreatic SWS and OSS-SNR. However, OSS-SNR in the whole abdomen significantly increased for BT-Rev compared to FB and BT-Int (p-value=0.010 and 0.014 respectively).Magnitude images over eight phase-offsets can be found in Figure 2. Comparing the magnitude image quality between BT-Int and BT-Rev, signal loss in various slices was present more pronounced in BT-Rev. Overlap images of phase-offset ROIs and corresponding elastograms are shown in Figure 3.
Discussion
Introduction of BT-Rev paradigm during pancreatic MRE significantly increases DSC compared to FB-MRE. This may be an important finding for pancreatic tumors where stromal tissue is of great interest. Pancreatic tumors can be small and a consistent location over multiple phase-offsets is needed to be able to perform sub-region analysis. Previous research showed that 2D motion correction in coronal direction improves sharpness of FB-MRE images4. Nevertheless, this is more difficult in an axial orientation and eddy current artifacts lead to distortions when acquiring pancreatic MRE in coronal orientation on a 3T MRI system.BT-Rev MRE significantly improves OSS-SNR in the whole abdomen compared to FB and BT-Int, while pancreatic OSS-SNR did not significantly differ between scans. Higher abdominal OSS-SNR suggests that measurements may be more reproducible when BT-Rev is used. The pancreatic SWS did not significantly differ, and values were comparable to literature1,2,4,5.
Magnitude image quality of BT-Int was visually higher than BT-Rev. This could be explained by signal leakage into adjacent slices typical of EPI acquisitions. Despite this finding, the increase in whole-abdomen OSS-SNR and DSC warrant future research on using BT-Rev to compare the reproducibility of SWS measurements with FB-MRE. The scan time increased two times when using BTs, giving the opportunity to acquire more/thinner slices or a higher in-plane resolution. Furthermore, future research could focus on performing motion correction in axial orientation or applying respiratory binning.
Conclusion
Although, pancreatic OSS-SNR did not improve and SWS did not significantly change, using BTs during pancreatic MRE acquisition causes a more stable pancreatic location over multiple phase-offsets leading to a higher OSS-SNR in the whole abdomen.Acknowledgements
No acknowledgement found.References
- Zhu L, Guo J, Jin Z et al. Distinguishing pancreatic cancer and autoimmune pancreatitis with in vivo tomoelastography. Eur Radiol. 2021 May;31(5):3366-3374. doi: 10.1007/s00330-020-07420-5. Epub 2020 Oct 30. PMID: 33125553.
- Marticorena Garcia SR, Zhu L, Gültekin E et al. Tomoelastography for Measurement of Tumor Volume Related to Tissue Stiffness in Pancreatic Ductal Adenocarcinomas. Invest Radiol. 2020 Dec;55(12):769-774. doi: 10.1097/RLI.0000000000000704. PMID: 32796197.
- Tzschätzsch H, Guo J, Dittmann F et al. Tomoelastography by multifrequency wave number recovery from time-harmonic propagating shear waves. Med Image Anal. 2016 May;30:1-10. doi: 10.1016/j.media.2016.01.001. Epub 2016 Jan 13. PMID: 26845371.
- Shahryari M, Meyer T, Warmuth C et al. Reduction of breathing artifacts in multifrequency magnetic resonance elastography of the abdomen. Magn Reson Med. 2021 Apr;85(4):1962-1973. doi: 10.1002/mrm.28558. Epub 2020 Oct 26. PMID: 33104294.
- Gültekin E, Wetz C, Braun J et al. Added Value of Tomoelastography for Characterization of Pancreatic Neuroendocrine Tumor Aggressiveness Based on Stiffness. Cancers (Basel). 2021 Oct 15;13(20):5185. doi: 10.3390/cancers13205185. PMID: 34680334.
Figures
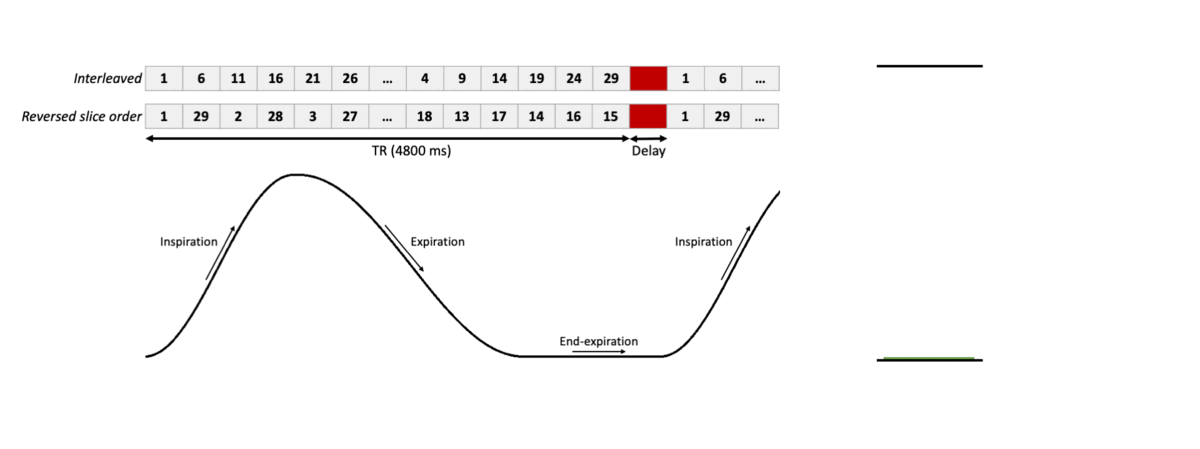
Figure 1: Breathing tasks
are synchronized with the MRE sequence such that each slice will be acquired
during the same breathing phase. The TR is 4800 ms and the delay varies for
each mechanical frequency and phase-offset. In this study, interleaved and
reversed slice order are used, shown here for 29 slices. At the right, an example of the breathing task paradigm is shown that is presented
to the volunteer during the MRE scan.

Table
1: Summary of the relevant MRE
parameters. TRs of MRE scans with breathing tasks are longer to ensure a more
natural breathing pattern.
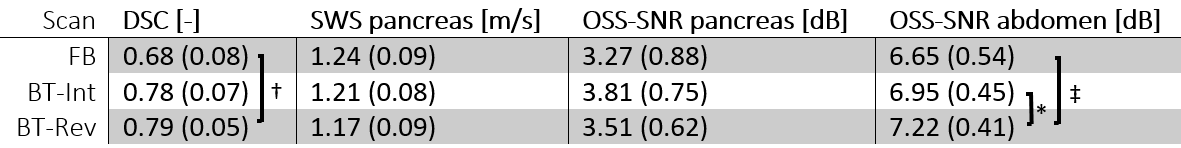
Table 2: The mean (standard
deviation) of dice similarity coefficient (DSC), shear-wave speed (SWS) and octahedral shear strain signal-to-noise-ratio (OSS-SNR) in the
pancreas and whole abdomen for the three different MRE scans (†p=0.026 , *p=0.010 ,
‡p=0.014).

Figure 2:
Magnitude MRE images for the three different scans for each phase-offset
acquired at a vibrational frequency of 30 and 50 Hz. The pancreas is delineated
in red. The movement of the pancreas over time can be recognized.
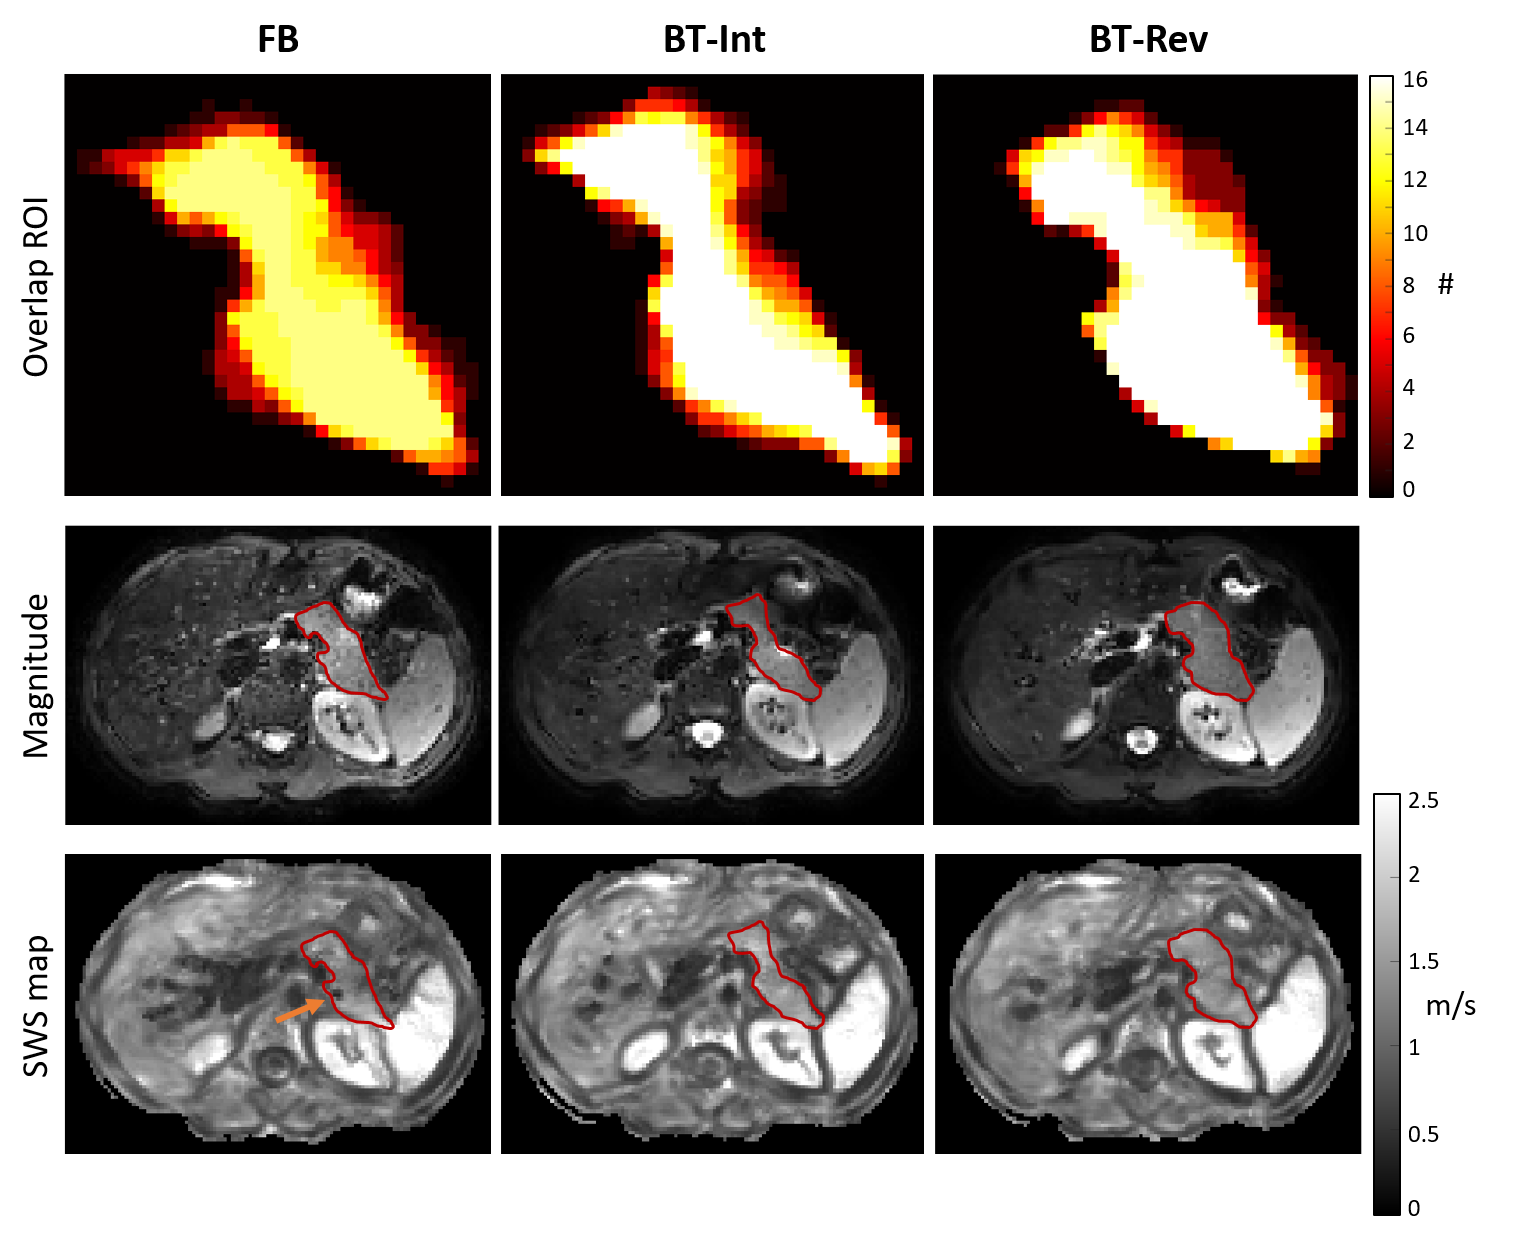
Figure
3: Top: Overlap of 16 ROIs delineated on
8 phase-offset magnitude images for 2 mechanical frequencies shown for the
three different MRE scans in 1 volunteer. The image is zoomed in on pancreatic
ROI. Note that for FB-MRE, the pancreas was not located in this slice for 2 phase-offsets.
Middle: Magnitude MRE images for the three MRE scans with the pancreas
delineated in red. Bottom: SWS map of the whole abdomen with the
pancreas delineated in red. The orange arrow indicates signal distortion in the
pancreas in the FB-MRE scan.
DOI: https://doi.org/10.58530/2022/2241