2240
Investigating the Repeatability of Multifrequency Magnetic Resonance Elastography applied to a Soft Gelatin Phantom1Division of Radiotherapy and Imaging, The Institute of Cancer Research, London, United Kingdom, 2Department of Radiology, The Royal Marsden NHS Foundation Trust, London, United Kingdom, 3Charité - Universitätsmedizin Berlin, Corporate Member of Freie Universität Berlin, Humboldt-Universität zu Berlin, and Berlin Institute of Health, Berlin, Germany
Synopsis
New measures of response are required that can capture the inherent heterogeneity and the heterogeneous changes observed in soft tissue tumours. Shear-wave Magnetic Resonance Elastography (MRE) measures stiffness of tissue by measuring the propagation of externally applied shear waves. In this study we explore the test-retest repeatability of Multifrequency MRE (MMRE), acquired using an echo-planar imaging readout applied to a soft gelatin phantom used to mimic the stiffness of soft-tissue tumours. Our results suggest MMRE is highly repeatable and supports further investigation in using MMRE to measure response in soft-tissue tumours.
Introduction
Conventional size-based measures of response such as RECIST1.1 fail to accurately assess treatment response in some soft-tissue tumours including soft-tissue sarcomas, leaving a need for quantitative imaging biomarkers that capture the heterogeneous response. A previous study has indicated tissue stiffness measured through Magnetic Resonance Elastography (MRE) may be suitable as a radiotherapy response marker for soft-tissue sarcomas1. Multifrequency MRE (MMRE) may provide a better assessment of tumour stiffness as intra-tumour regions that have low signal at one shear wave frequency may have higher signal at another2. Early repeatability studies are a key step towards identifying imaging response biomarkers3. In this study we take repeat MMRE measurements of a soft gelatin phantom and, using two different inversion algorithms4,5, generate maps of both the absolute shear modulus (absG), which has shown to capture tumour heterogeneity in glioblastomas5, and the shear wave speed (c), which has shown promise for tumour detection in prostate cancer6. We investigate and compare the test-retest repeatability of both fitted parameters.Method
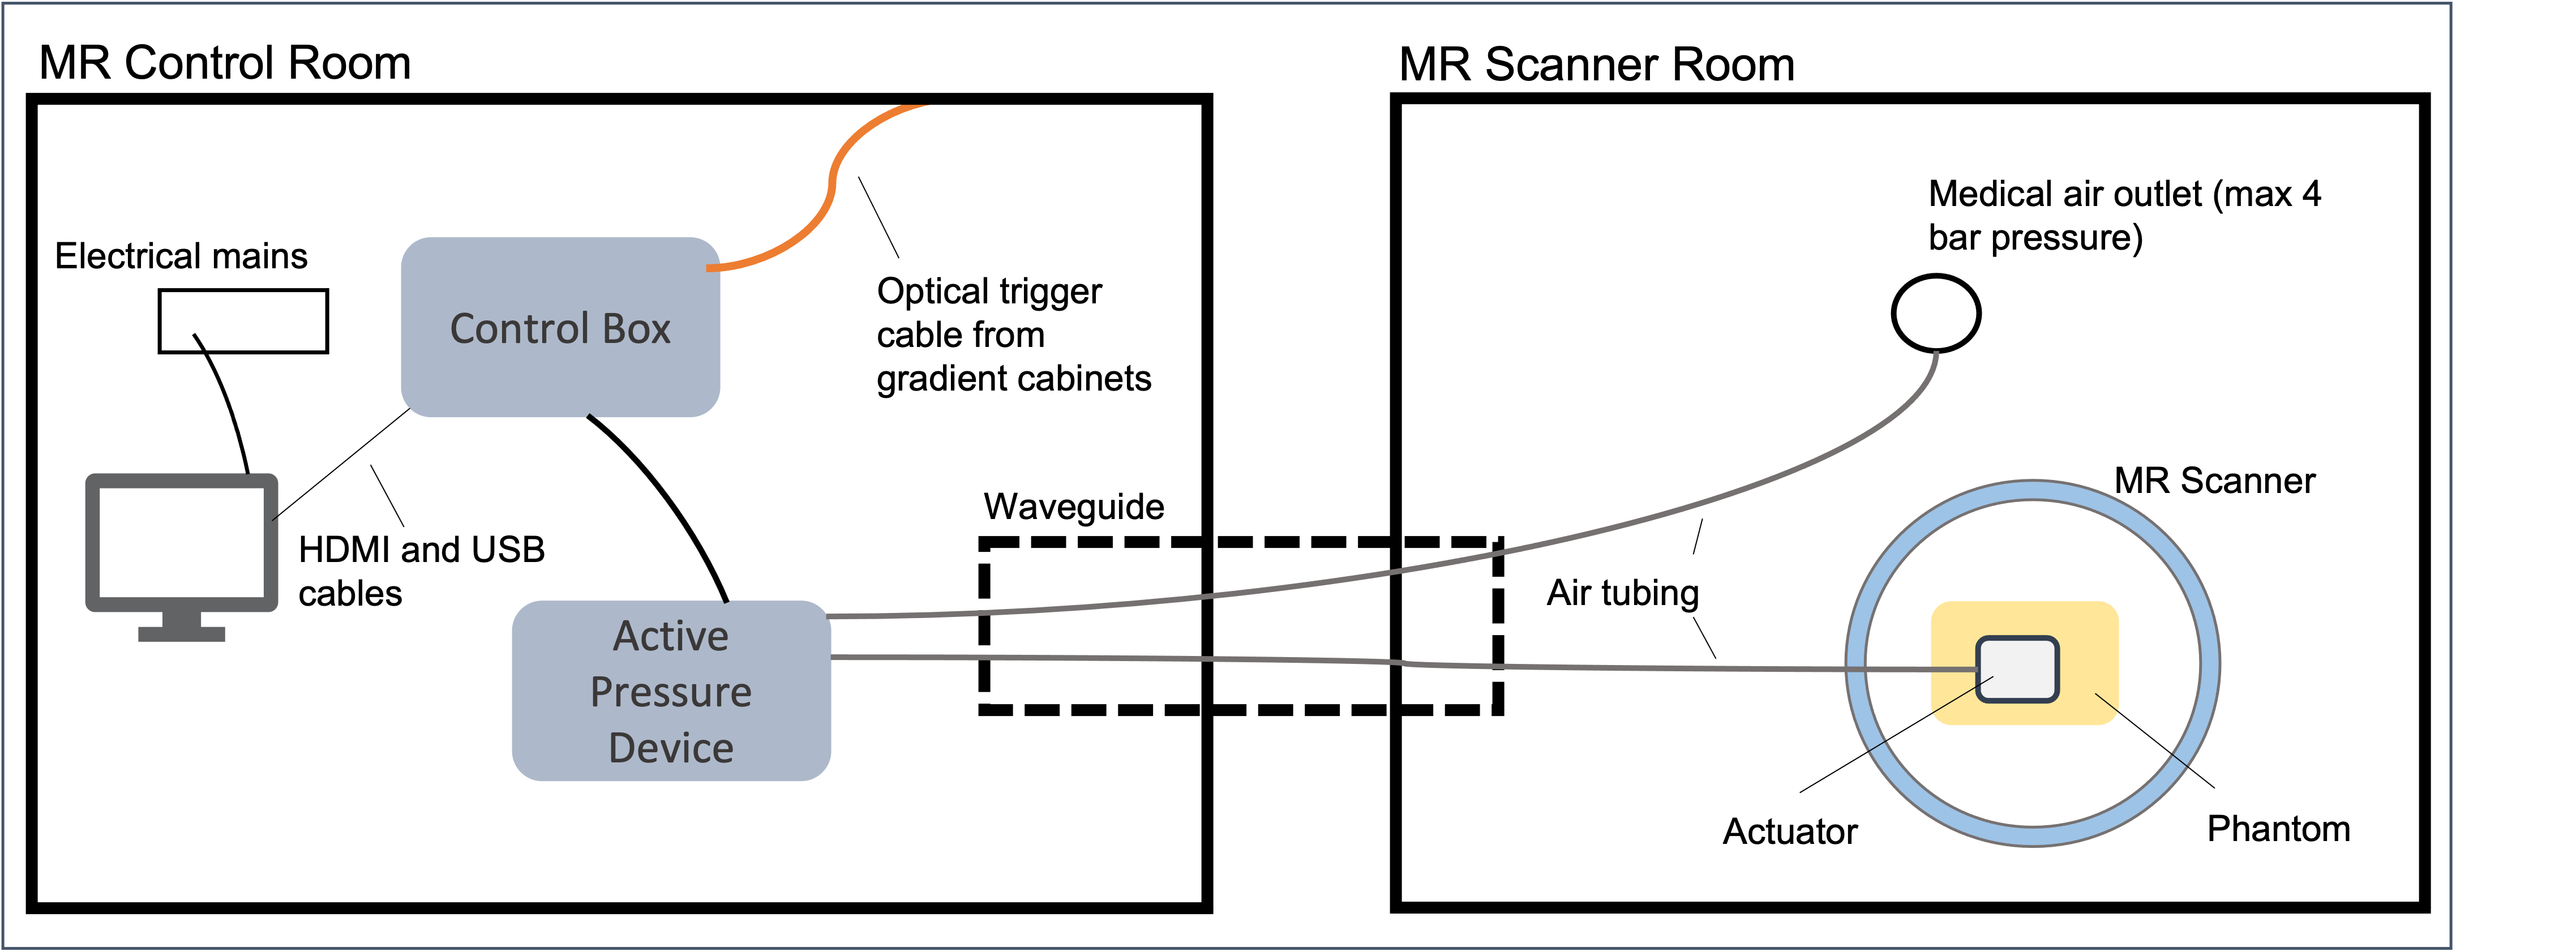
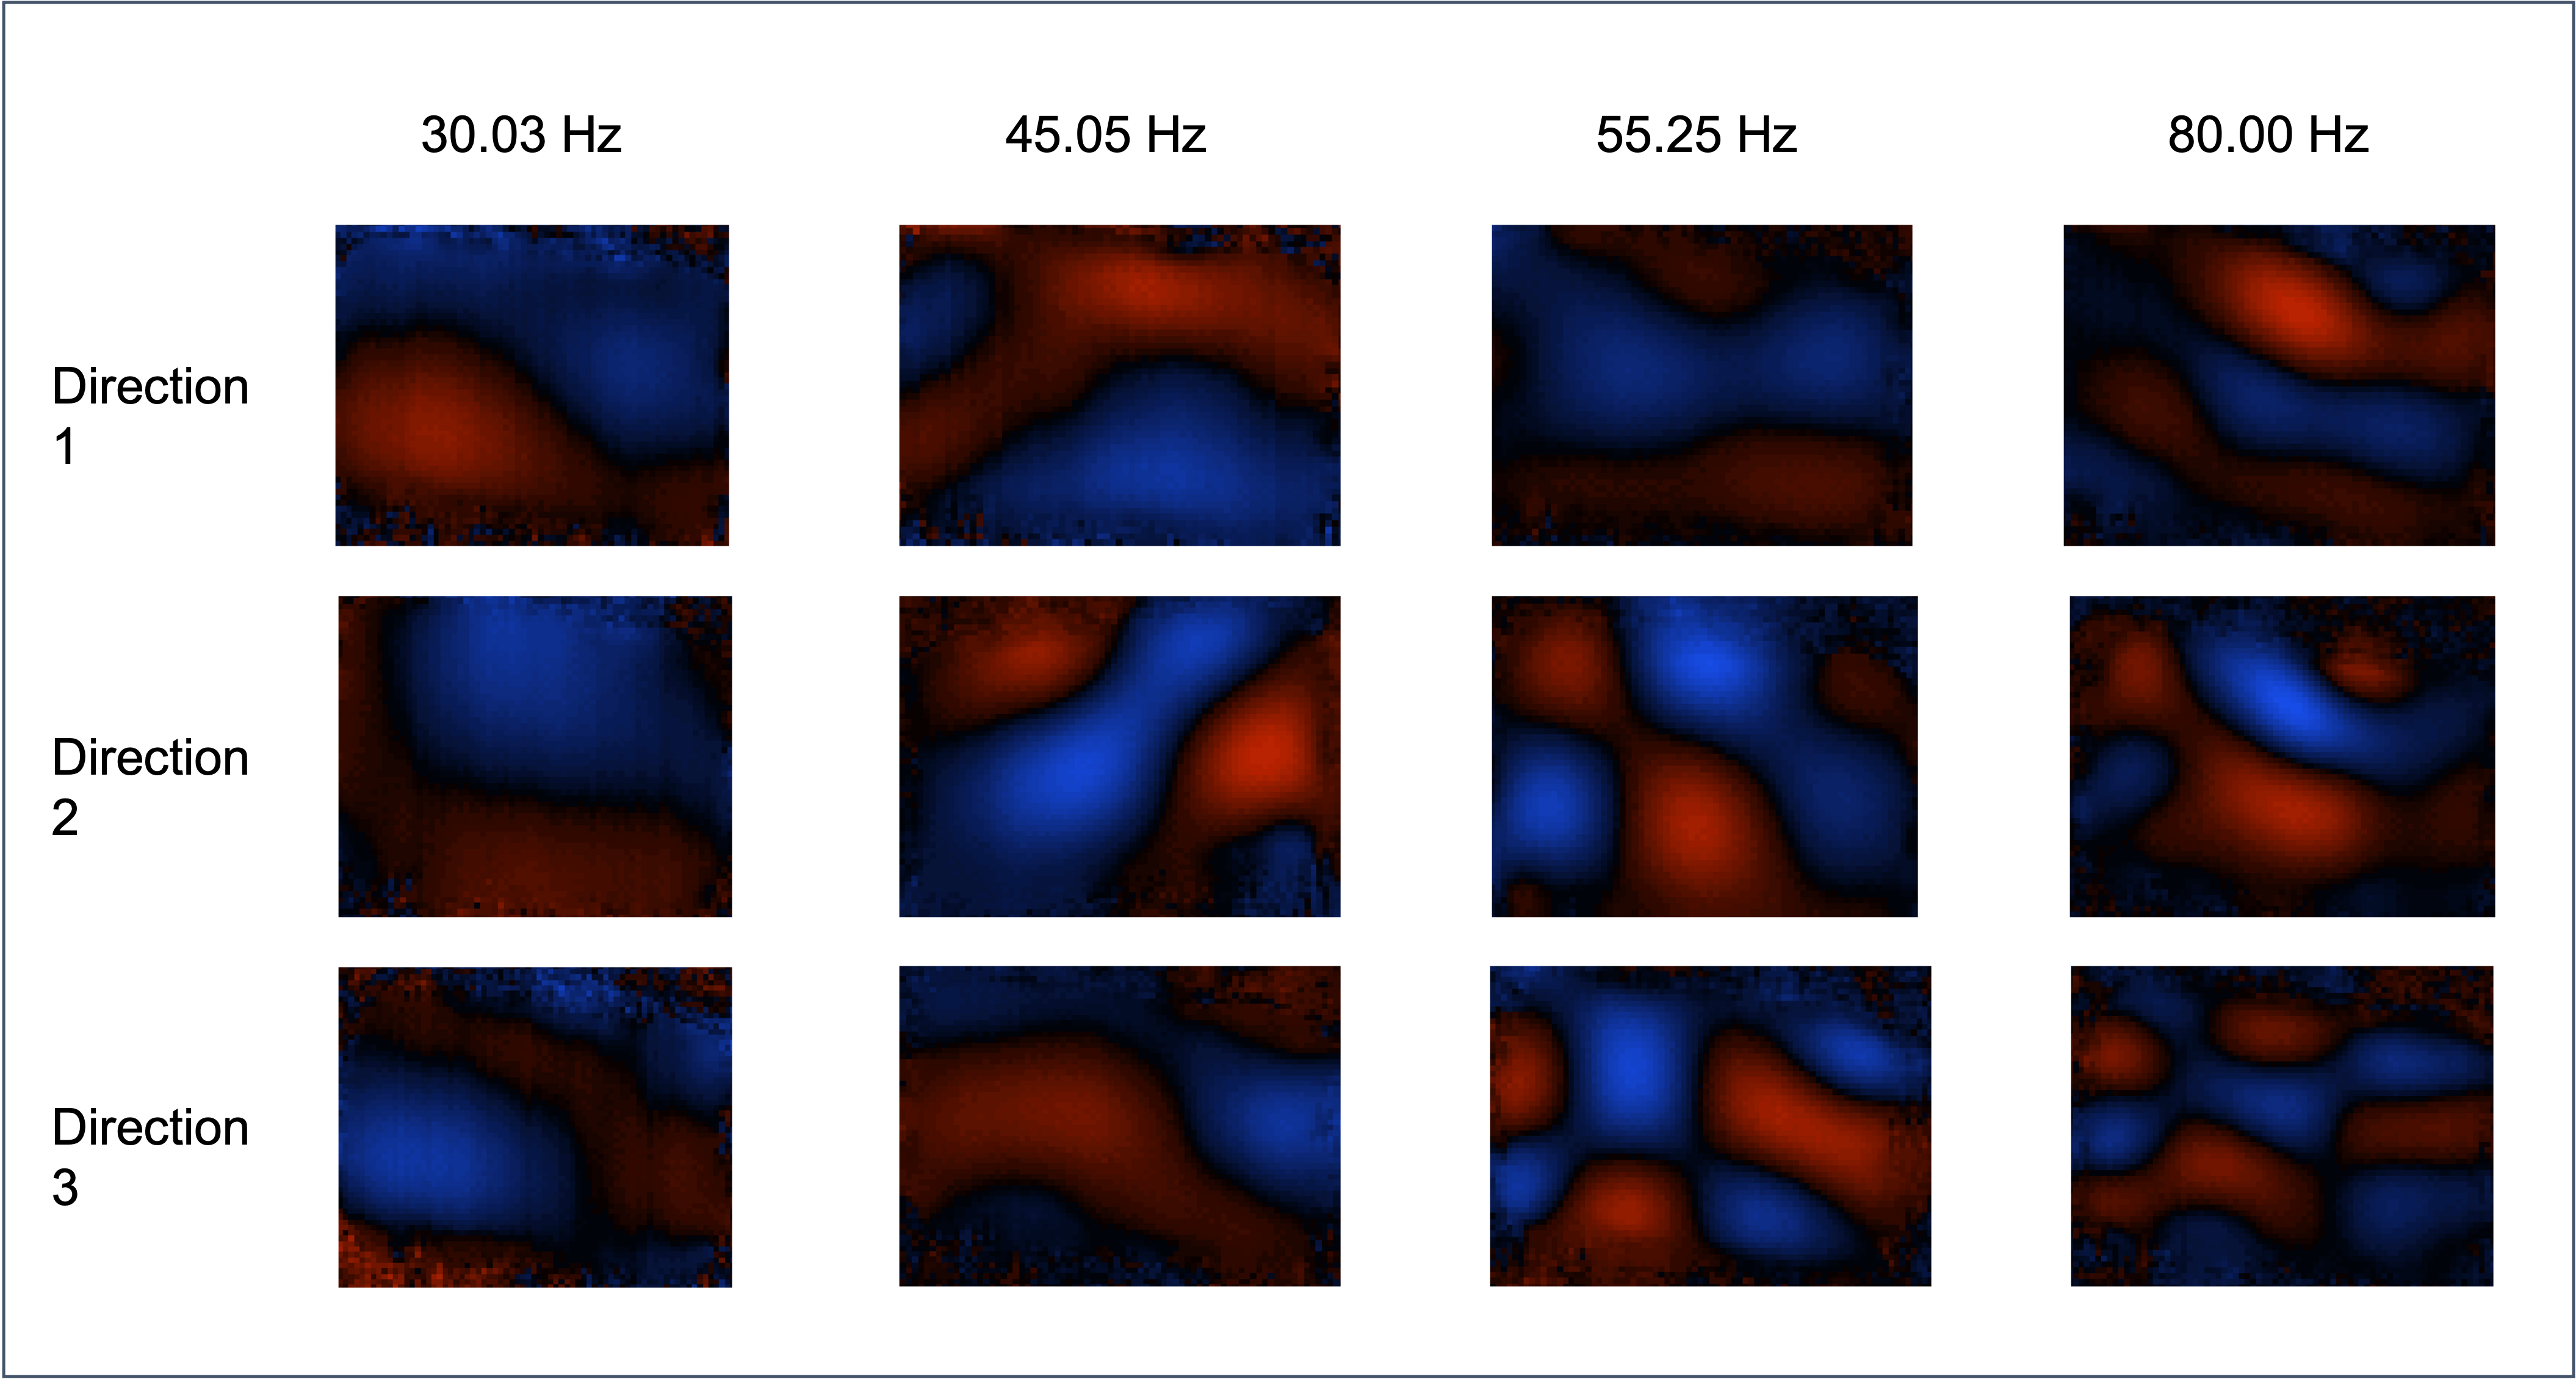
A soft gelatin phantom was developed by mixing 42.5g gelatin and 25.5g agar with 850ml water, chosen to match expected stiffness values seen in soft tissues tumours such as sarcomas1. The water was heated in a microwave until the temperature reached 76 degrees Celsius, it was then removed and the gelatin was stirred in by spatula followed by agar. The mixture was stirred using a magnetic stirrer and, once cooled to the consistency of honey, poured in a cuboid mould and left to cool further in a fridge overnight.Images of the phantom were acquired using a 1.5T MR scanner (MAGNETOM, Aera, Siemens Healthcare, Germany) and MMRE set up (Figure 1) with a 2D spin-echo EPI sequence7. Placing one actuator centred on top of the phantom, shear waves were applied to the phantom at 4 frequencies (30.03,45.05,55.25,80.0 Hz) at a pressure of 200mbar and 11 slices [field-of-view: 270mm * 253mm, slice-thickness: 5mm, pixel spacing: 1.7mm x 1.7mm] taken at 8 time points during the wave cycle with 3 motion-encoding gradient directions (Figure 2). Without moving the phantom, a set of repeat measurements was taken.
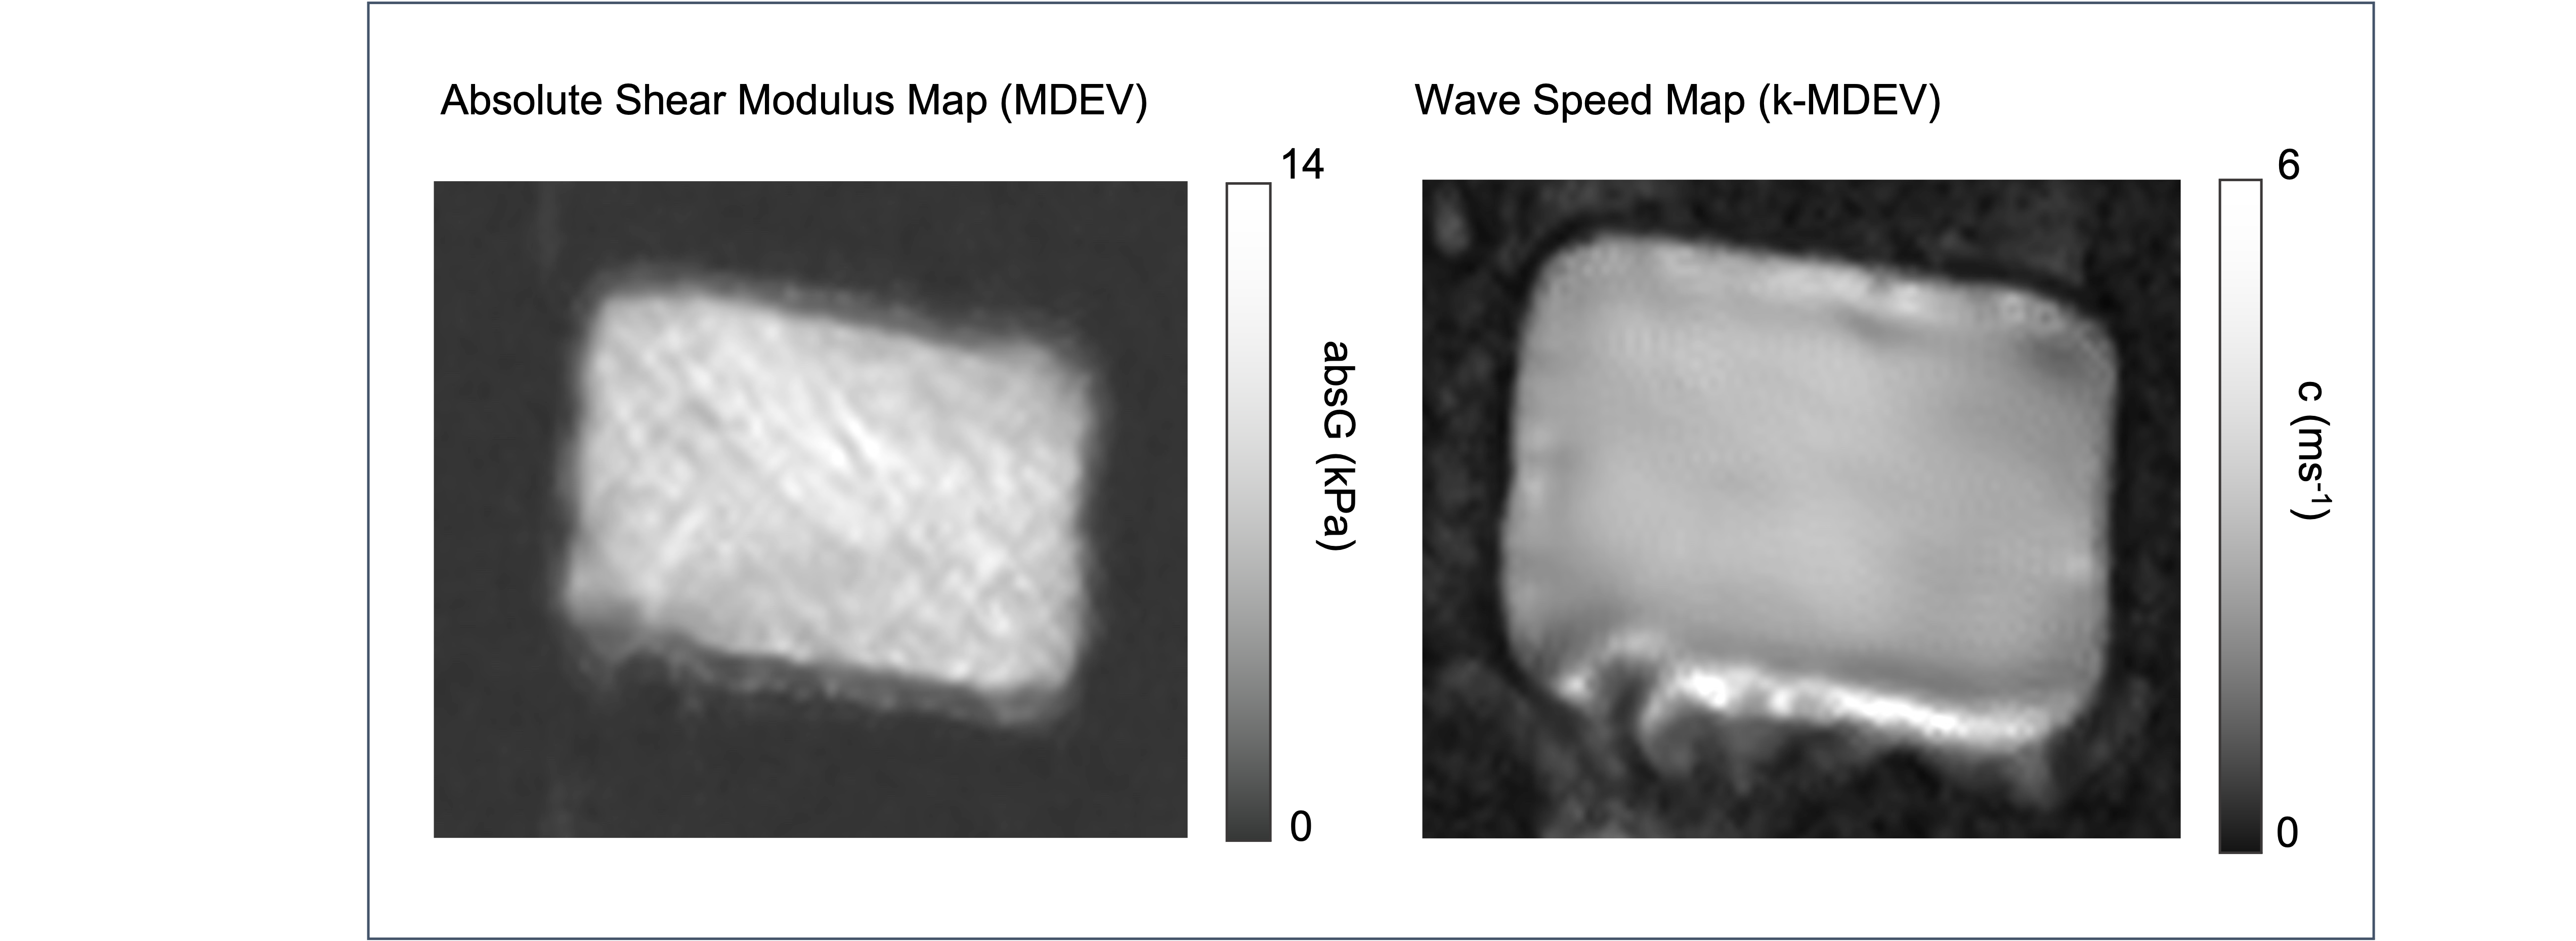
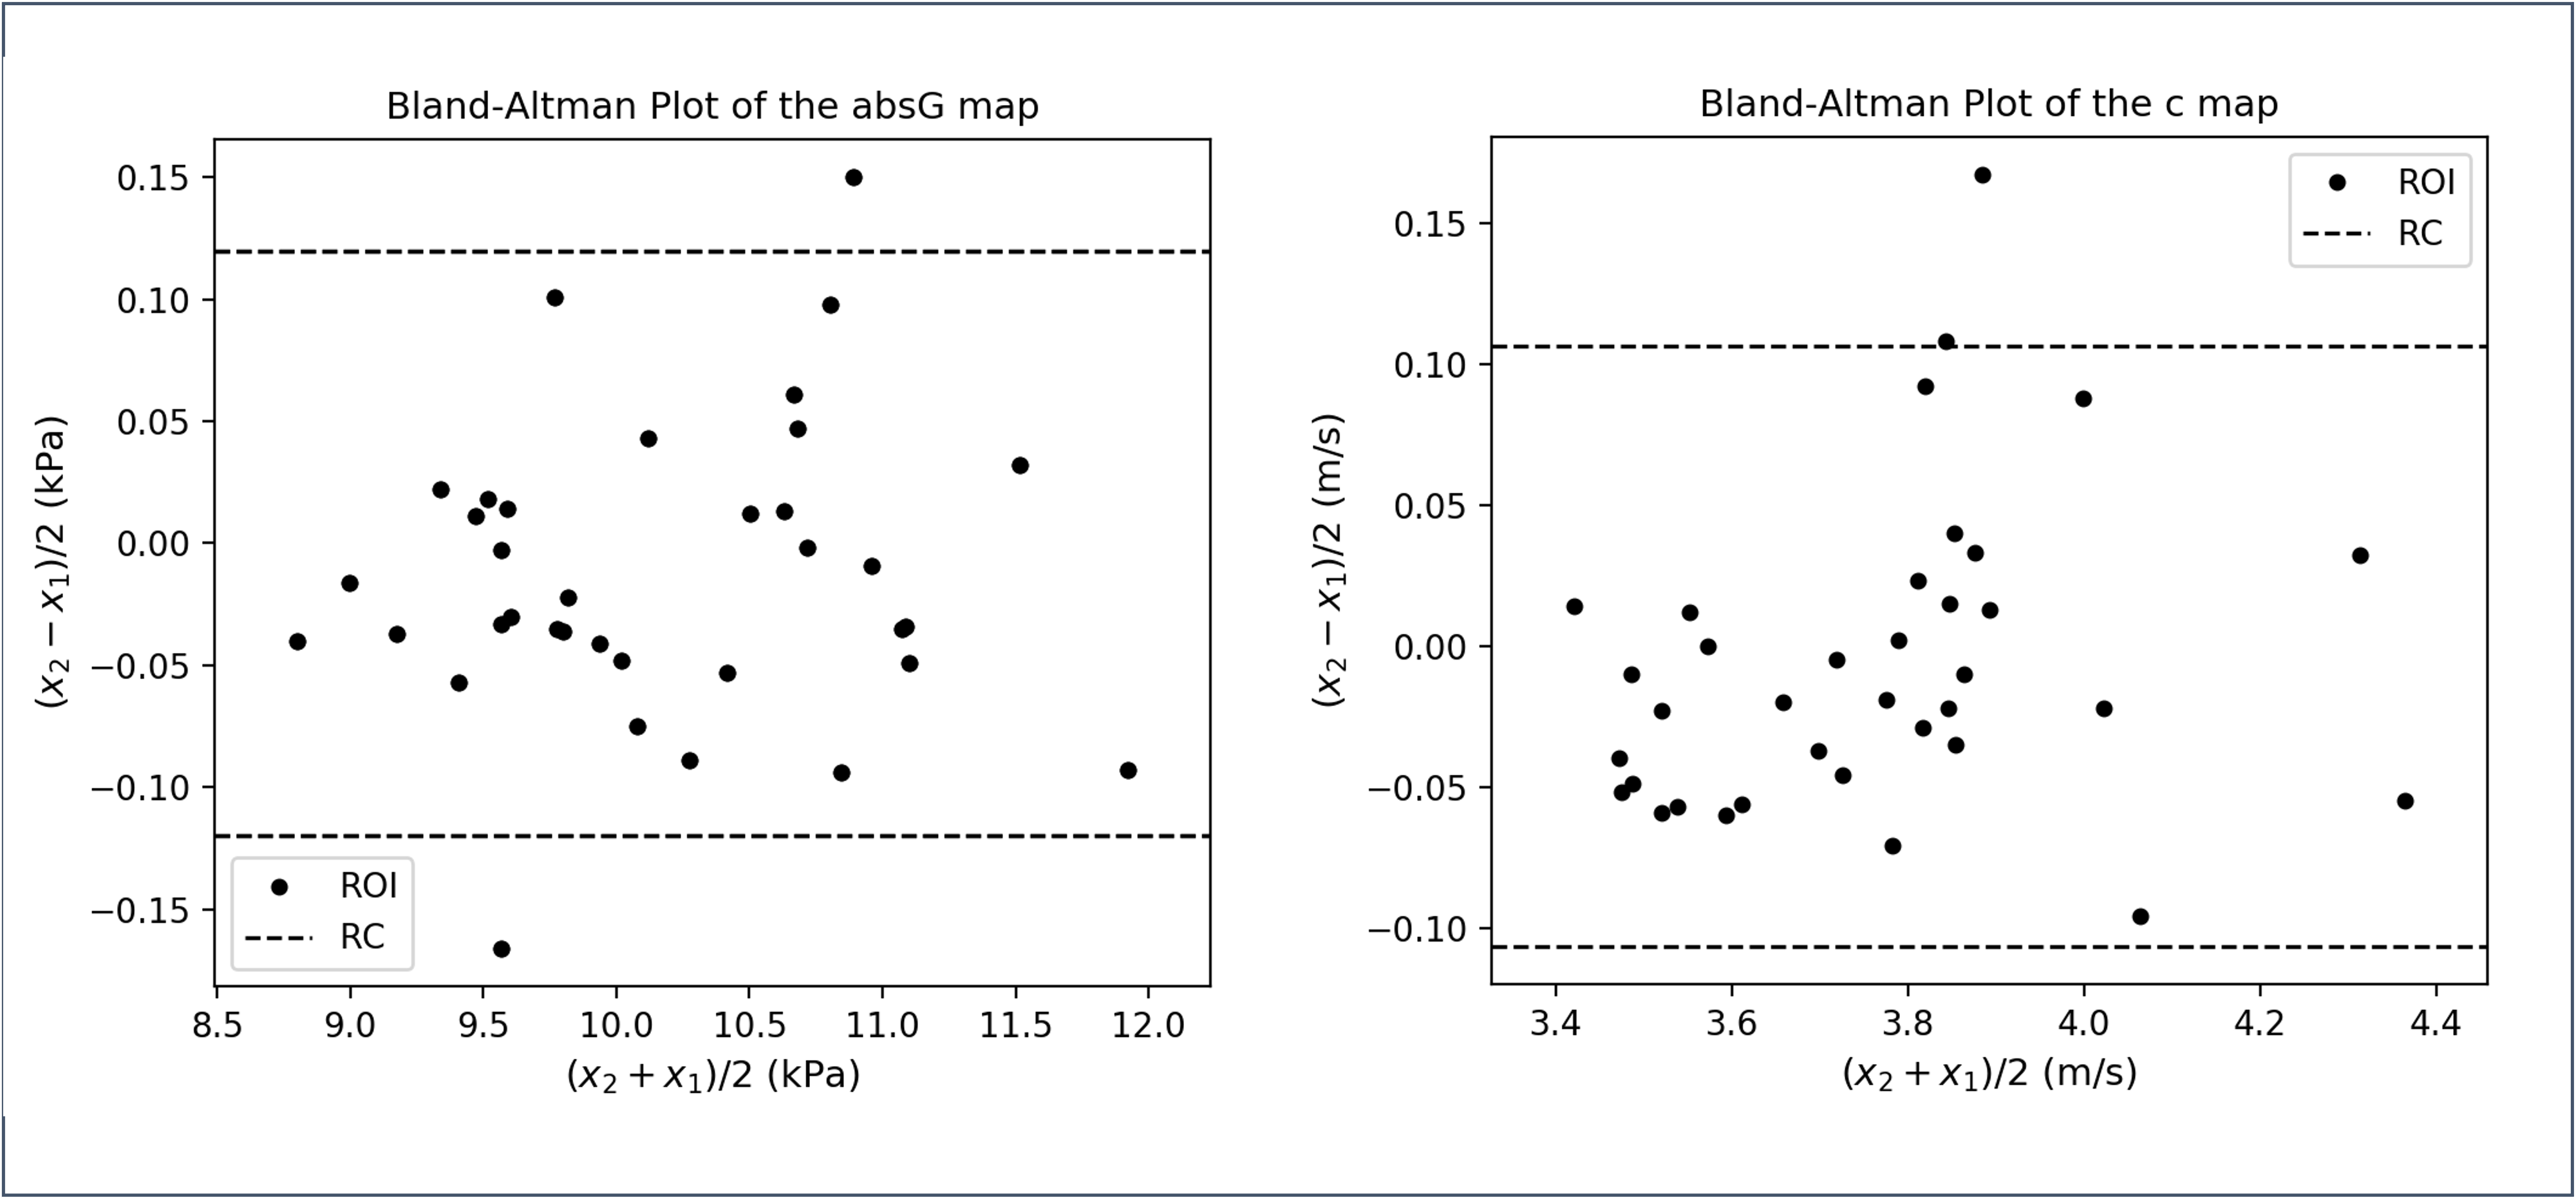
The MRI data using all 4 frequencies were analysed with two inversion algorithms, MDEV5 and k-MDEV4, using Bioqic8 software to calculate maps of both the absolute shear modulus (absG) and shear wave speed (c) respectively (Figure 3). Four rectangular regions-of-interest (ROI) [Area: 1.359 cm2] were drawn on the calculated absG and c maps, using Horos9 software, and copied across each of the 9 central slices (the first and last slices were omitted due to the presence of artefacts and a drop in signal at the end slices). The mean value in each ROI was extracted for both original and repeated measurements, generating 36 paired points of repeatability data for both the absG and c maps separately. For both map types the intra-class correlation (ICC) coefficient values were calculated as $$$ ICC = \frac{s_b^2}{s_b^2 + s_w^2} $$$ where sb is the standard deviation of mean values between different ROIs, and sw the estimated standard deviation of differences of means between repeat scans for the same ROI. Bland-Altman10 plots were derived with the repeatability coefficient (RC) shown (Figure 4).
Results
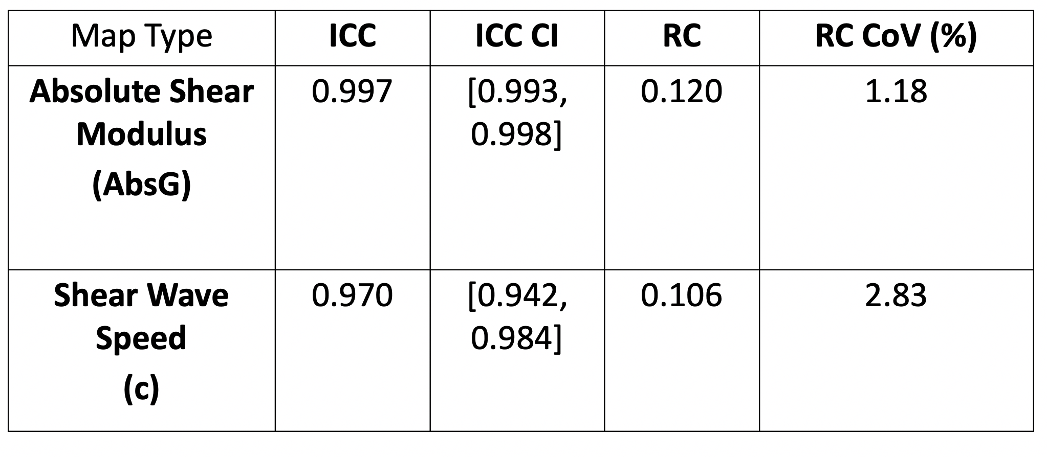
In (Figure 3) a map of the absolute shear modulus (absG) of the central slice is shown on the left and a corresponding map of the shear wave speed (c) on the right. The c map is visually much smoother than the absG map. The Bland-Altman plots for both map types are shown in (Figure 4), both displaying a slight bias. The ICC values for the shear wave speed (c) maps and the absolute shear modulus (absG) are 0.970 and 0.997 respectively. The ICC 95% confidence intervals, repeatability coefficient (RC) and RC Coefficient of Variation (CoV) are shown in (Figure 5).Discussion
This study investigated the repeatability of MMRE when applied to a soft phantom, identifying good repeatability across both the absG and c maps. Comparing the two different algorithms visually, the c maps are smoother, whereas the absG maps show more heterogeneity. If the c-map smooths out true heterogeneity inherent to the phantom structure then this may suggest the absG map is more appropriate for capturing tumour heterogeneity. The absG maps had a higher ICC, but this may be due to the greater variation between points within the same map (due to the heterogeneity) resulting in a higher sb. The Bland-Altman plots demonstrate a weak bias. It is possible the MMRE causes a temperature change resulting in change in the physical properties of the gelatin phantom between the repeated scans resulting in the shift in the values seen in the Bland-Altman plots.In conclusion, our results encourage further investigation of MMRE for soft tissue tumours due to good repeatability and potential for capturing heterogeneity. The next step would be to run repeatability measurements in human volunteers, which would capture additional factors arising from working within a clinical environment.
Acknowledgements
We acknowledge support from The David and Ruth Lewis Family Charitable Trust.References
1. Pepin, K.; Grimm, R.; Kargar, S.; Howe, B.M.; Fritchie, K.; Frick, M.; Wenger, D.; Okuno, S.; Ehman, R.; McGee, K.; et al. Soft Tissue Sarcoma Stiffness and Perfusion Evaluation by MRE and DCE-MRI for Radiation Therapy Response Assessment: A Technical Feasibility Study. Biomedical Physics & Engineering Express 2019, 5, doi:10.1088/2057-1976/ab2175.
2. Papazoglou, S.; Hirsch, S.; Braun, J.; Sack, I. Multifrequency Inversion in Magnetic Resonance Elastography. Physics in Medicine and Biology 2012, 57, 2329–2346, doi:10.1088/0031-9155/57/8/2329.
3. O’Connor, J.P.B.; Aboagye, E.O.; Adams, J.E.; Aerts, H.J.W.L.; Barrington, S.F.; Beer, A.J.; Boellaard, R.; Bohndiek, S.E.; Brady, M.; Brown, G.; et al. Imaging Biomarker Roadmap for Cancer Studies. Nature Reviews Clinical Oncology 2017, 14, 169–186, doi:10.1038/nrclinonc.2016.162.
4. Tzschätzsch, H.; Guo, J.; Dittmann, F.; Hirsch, S.; Barnhill, E.; Jöhrens, K.; Braun, J.; Sack, I. Tomoelastography by Multifrequency Wave Number Recovery from Time-Harmonic Propagating Shear Waves. Medical Image Analysis 2016, 30, 1–10, doi:10.1016/j.media.2016.01.001.
5. Streitberger, K.J.; Reiss-Zimmermann, M.; Freimann, F.B.; Bayerl, S.; Guo, J.; Arlt, F.; Wuerfel, J.; Braun, J.; Hoffmann, K.T.; Sack, I. High-Resolution Mechanical Imaging of Glioblastoma by Multifrequency Magnetic Resonance Elastography. PLoS ONE 2014, 9, doi:10.1371/journal.pone.0110588.
6. Dittmann, F.; Reiter, R.; Guo, J.; Haas, M.; Asbach, P.; Fischer, T.; Braun, J.; Sack, I. Tomoelastography of the Prostate Using Multifrequency MR Elastography and Externally Placed Pressurized-Air Drivers. Magnetic Resonance in Medicine 2018, 79, 1325–1333, doi:10.1002/mrm.26769.
7. Dittmann, F.; Hirsch, S.; Tzschätzsch, H.; Guo, J.; Braun, J.; Sack, I. In Vivo Wideband Multifrequency MR Elastography of the Human Brain and Liver. Magnetic Resonance in Medicine 2016, 76, 1116–1126, doi:10.1002/mrm.26006.
8. Bioqic Apps. [Online]. Available: https://bioqic-apps.charite.de/
9. Nimble Co LLC d/b/a Purview Horos. Annapolis, MD USA. [Online]. Available: Horosproject.org
10. Bland, J.M.; Altman, D.G. Statistical Methods for Assessing Agreement between Two Methods of Clinical Measurement. International Journal of Nursing Studies 2010, 47, 931–936, doi:10.1016/j.ijnurstu.2009.10.001.
Figures