2239
Shear stiffness measured by MR elastography correlates with compression modulus in ex vivo rat livers subjected to increasing portal pressure.1Radiology, Charité – Universitätsmedizin Berlin, Berlin, Germany, 2Radiology, Charité - Universitätsmedizin Berlin, Berlin, Germany
Synopsis
To investigate the effect of perfusion pressure on liver stiffness, 13 ex-vivo rat livers were studied by volumetric MRI, MR elastography (MRE) and diffusion MRI under controlled portal pressures between 0 and 15 cmH2O. Liver volume, tissue-vascular volume fraction, stiffness and bulk modulus decreased while water diffusivity increased with increasing portal pressure. Collectively, our findings suggest that liver softening is caused by a relative increase in fluid volume while an increased vascular pressure, potentially increasing liver stiffness, is of minor importance when tissue can freely expand, as in our scenario.
Introduction
Magnetic Resonance Elastography (MRE) non-invasively maps shear-wave speed (SWS) as a surrogate of stiffness of soft tissues[1]. MRE is used to diagnose and stage the progression of diffuse liver diseases, which are characterized by pathological changes such as extracellular matrix accumulation or an altered blood flow including portal pressure[2, 3]. So far, the relationship between tissue stiffness, diffusion and perfusion[4] parameters which are related to tissue compression and pressure have been insufficiently studied. Our aim was to investigate the effect of portal pressure under ex-vivo conditions on liver stiffness, water diffusion and liver volume. Rat livers were subjected to different portal pressures while measuring stiffness, apparent diffusion coefficient (ADC), tissue volume, vascular volume and bulk modulus. Patients with portal hypertension showed a positive correlation between portal pressure and stiffness[5]. Our hypothesis is that liver stiffness increases with increasing portal pressure[4].Methods
Liver preparation: Livers were harvested from 13 young adult male Wistar rats which were anesthetized with isoflurane vapor then sacrificed by bleeding out[6]. After cannulation of the portal vein (PV), a solution of 2500U/L of Heparin (Heparin-Natrium-250000-ratiopharm)[7] diluted to 1/10 in PBS was injected into the liver through the PV then washed out with PBS pumped into the same inlet with a flowrate value of 1mL/min/g of liver weight to prevent post-mortem blood coagulation[6, 8]. Liver outflow from remaining vessels was blocked[9].Setup: The liver was embedded in a 0.5% concentrated agar-agar gel to suppress liver degradation from air exposure and susceptibility artifacts in the MRI. The PV was connected to a PBS solution bottle[4, 8]. For each of the hydrostatic heights (0, 10, 12.5 and 15 cm)[8] the liver was perfused with continuous PBS inflow. After three minutes, the flow was stopped to maintain a static pressure.
Imaging protocol: Imaging was performed on a 3-Tesla MRI scanner (Lumina, Siemens, Germany) with a multichannel transmit/knee coil. Coronal T2 slices covering the full liver volume with 0.5×0.5×1.0mm³ resolution (TR=2740ms, and TE=64ms) were acquired. MRE was performed using pressure pads to induce time harmonic shear-waves of 130, 140, 150, and 160Hz frequency encoded with a single-shot, spin-echo EPI sequence. 29 coronal slices of 1.5mm thickness and 1.5x1.5mm² in-plane resolution were acquired. Diffusion weighted imaging was performed with similar image orientation and resolution as MRE (TE=85ms and TR=1500ms). 0, 50, 400 and 800s/mm2 b-values were acquired to calculate the apparent diffusion coefficient (ADC).
Data processing: SWS maps were reconstructed using k-MDEV inversion[10]. SWS maps and ADC maps were registered to anatomical T2-weighted images for each portal pressure step. The total liver volume was segmented manually for each pressure. Vessel volume was determined based on a T2-threshold and normalized by total liver volume to obtain the tissue-vascular volume fraction (fig1). Bulk modulus was estimated by portal pressure divided by volumetric strain[11], i.e. volume increase upon pressure normalized with initial liver volume.
Results
An increase of the portal pressure results in a decrease in SWS (10%, fig2A, P=0.02), increase in ADC (83%, fig 2B, P=4.76e-04), decrease in tissue-vascular volume fraction (72%, fig3, P<0.001) and decrease in bulk modulus (60%, fig4, P=0.0351). Percentage values refer to the change of pressure from 0 to 15 cmH2O.Pearson correlations: Between SWS and ADC, negative (fig5A, R=-0.5, p=1.5e-05). Between SWS and bulk modulus, established from 12.5 to 15cmH2O, positive (fig5B, R=0.63, p =1.5e-05). Between tissue-vascular volume fraction and SWS, positive (fig5C, R=0.32, p=0.021).
Discussion
To our knowledge, this study presents first experiments on the influence of portal pressure on liver shear stiffness, compression modulus, vascular volume and water diffusion in a well-defined ex-vivo setup. Previous studies reported stiffening of liver tissue upon increased portal pressure[4, 12] and an increased liver stiffness with increased blood volume[5, 12, 13]. Contrary to these in-vivo experiments and studies on larger specimens, we observed that the liver softens with increasing portal pressure. This contradictory result, at first glance, can be explained by a significant increase of tissue volume, vascular volume and ADC. All these parameters indicated an increase of fluid volume within the liver across different length scales from interstitial fluid to micro and macro vascular expansion. Unlike larger liver specimens, our rat liver specimens were not fully encapsulated and thus, free to expand upon portal pressure increase. As a result, the overall content of water increases leading to increasing total volume of the liver such that the overall bulk modulus of the effective medium (made of a permeable solid matrix with fluid-filled vessels and cavities) decreases[14]. We consider our experiments to be an important step towards understanding the relationship between MRE-measured shear stiffness and tissue pressure. In future experiments, we will embed the liver in a stiffer gel matrix in order to prevent volumetric expansion and bulk-modulus decrease as observed herein.Conclusion
We showed that MRE could detect stiffness changes in rat liver correlated with decreases in bulk modulus when inducing different portal pressure values. Our findings suggest that the effect of portal pressure on liver stiffness is influenced by tissue volume and vascular expansion, fluid accumulation and compression properties of the liver. In future experiments, boundary conditions such as the liver capsule and vascular compliance should be considered.Acknowledgements
We acknowledge support from the German Research Foundation (DFG)- BIOQIC and SFB1340 Matrix in Vision.References
1. Manduca, A., et al., MR elastography: Principles, guidelines, and terminology. Magn Reson Med, 2021. 85(5): p. 2377-2390.
2. Yin, M., et al., Distinguishing between hepatic inflammation and fibrosis with MR elastography. Radiology, 2017. 284(3): p. 694-705.
3. Reiter, R., et al., Diagnostic performance of tomoelastography of the liver and spleen for staging hepatic fibrosis. Eur Radiol, 2020. 30(3): p. 1719-1729.
4. Hirsch, S., et al., Towards compression‐sensitive magnetic resonance elastography of the liver: Sensitivity of harmonic volumetric strain to portal hypertension. Journal of Magnetic Resonance Imaging, 2014. 39(2): p. 298-306.
5. Ipek-Ugay, S., et al., Time Harmonic Elastography Reveals Sensitivity of Liver Stiffness to Water Ingestion. Ultrasound Med Biol, 2016. 42(6): p. 1289-94.
6. Garczyńska, K., et al., Effect of Post-mortem Interval and Perfusion on the Biophysical Properties of ex vivo Liver Tissue Investigated Longitudinally by MRE and DWI. Front Physiol, 2021. 12: p. 696304. 7. Inokawa, H., et al., Effects of postmortem heparinization in canine lung transplantation with non–heart-beating donors. The Journal of thoracic and cardiovascular surgery, 2005. 129(2): p. 429-434. 8. Nösser, M., et al., Development of a Rat Liver Machine Perfusion System for Normothermic and Subnormothermic Conditions. Tissue Eng Part A, 2020. 26(1-2): p. 57-65.
9. Martins, P.N.A. and P. Neuhaus, Surgical anatomy of the liver, hepatic vasculature and bile ducts in the rat. Liver international, 2007. 27(3): p. 384-392.
10. Tzschätzsch, H., et al., Tomoelastography by multifrequency wave number recovery from time-harmonic propagating shear waves. Medical image analysis, 2016. 30: p. 1-10.
11. Sarvazyan, A.P., M.W. Urban, and J.F. Greenleaf, Acoustic waves in medical imaging and diagnostics. Ultrasound in medicine & biology, 2013. 39(7): p. 1133-1146.
12. Piecha, F., et al., Arterial pressure suffices to increase liver stiffness. American Journal of Physiology-Gastrointestinal and Liver Physiology, 2016. 311(5): p. G945-G953.
13. Dittmann, F., et al., Tomoelastography of the abdomen: Tissue mechanical properties of the liver, spleen, kidney, and pancreas from single MR elastography scans at different hydration states. Magn Reson Med, 2017. 78(3): p. 976-983.
14. Parker, K., A microchannel flow model for soft tissue elasticity. Physics in Medicine & Biology, 2014. 59(15): p. 4443.
Figures
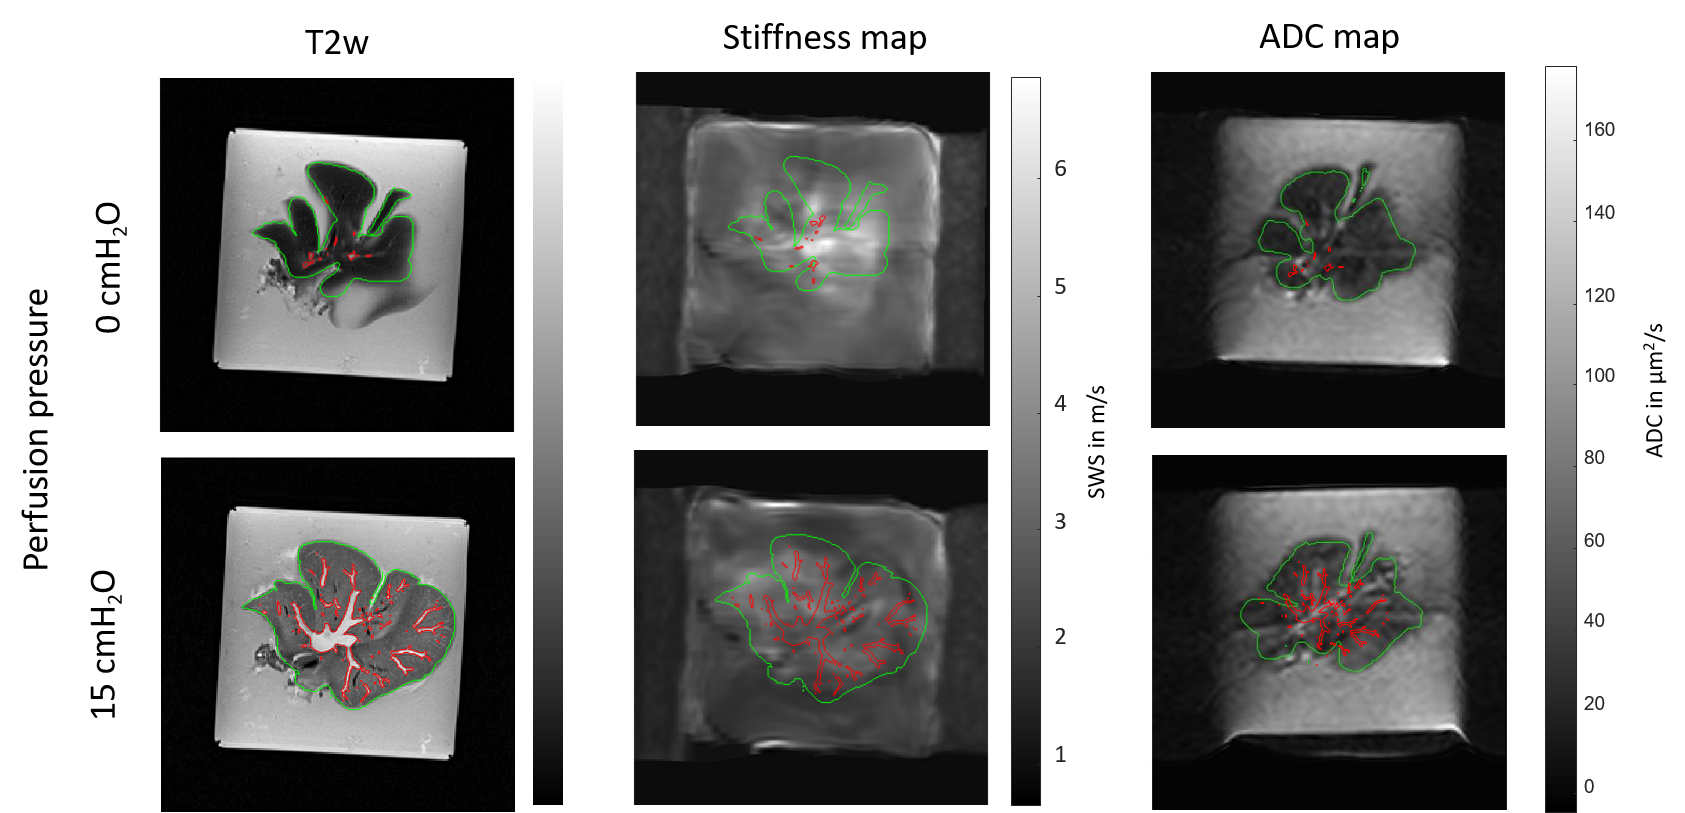
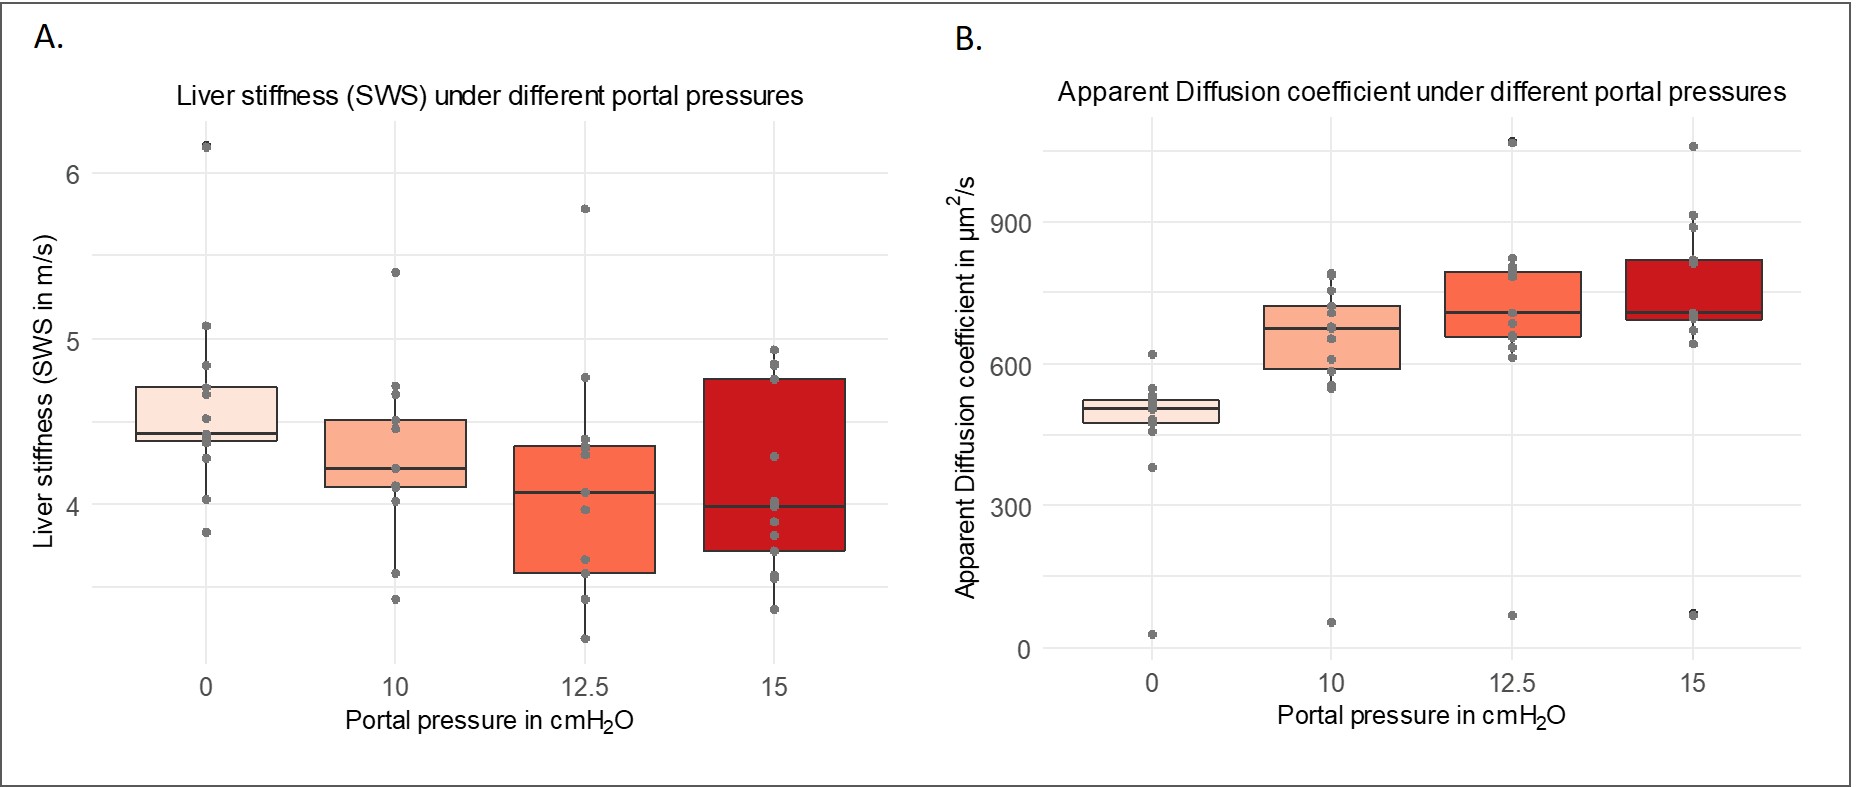
Figure 2A: Decreasing SWS values at increasing portal pressures: 0 cmH2O (4.59 ± 0.5), 10 cmH2O (4. 29 ± 0.5), 12.5 cmH2O (4.11 ± 0.6) and 15 cmH2O (4.12 ± 0.5).
Figure2B: Increasing ADC at increasing portal pressures: 0 cmH2O (466 ± 143), 10 cmH2O (625 ± 190), 12.5 cmH2O (699 ± 224) and 15 cmH2O (732 ± 232).


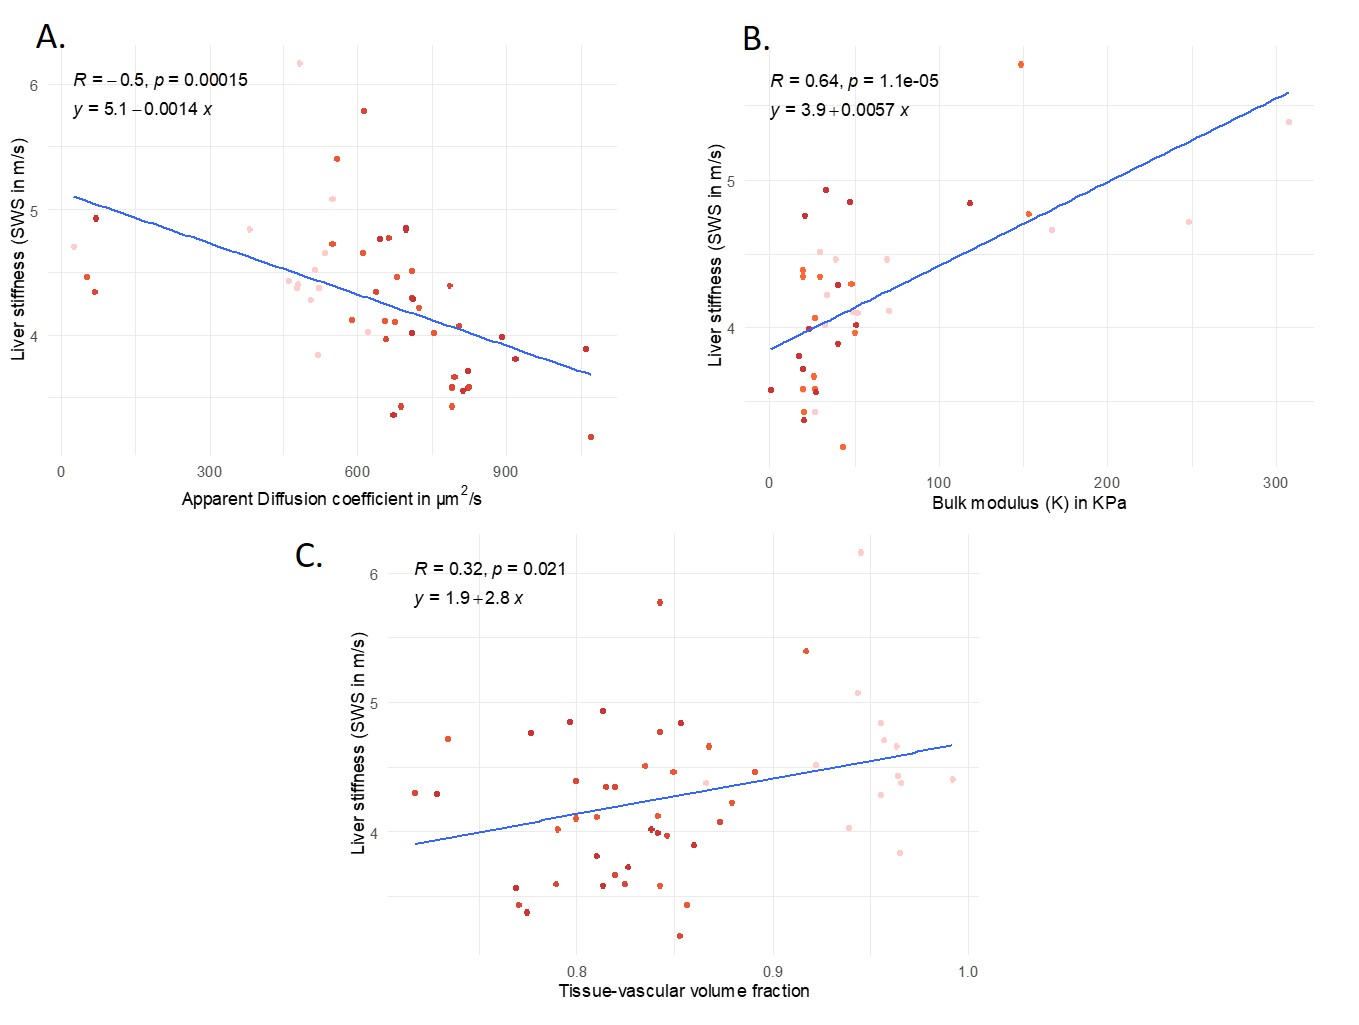
Figure 5: Pearson correlations:
A: between ADC and SWS of the liver showing a negative correlation (R = -0.5, p = 15e-03).
B: between the bulk modulus and SWS of the liver showing a positive correlation (R=0.64, p=1.1e-05).
C: between the tissue-volume vascular fraction showing a positive correlation (R = 0.32, p=0.021).