2238
Multiresolution MR elastography reconstruction and comparison of different direct inversion algorithms in the liver1Laboratory of imaging biomarkers, INSERM UMR 1149, Paris, France, 2Center for research on inflammation, INSERM UMR 1149, Paris, France, 3Department of Radiology, University Hospital Paris Nord, Clichy, France, 4Hepatology service, University Hospital Paris Nord, Clichy, France
Synopsis
In this study we propose using a MR elastography reconstruction method adjust the ratio between wavelength and spatial resolution, by resampling the matrix of shear displacement locally, to optimize the quality of the reconstruction. This reconstruction algorithm was compared to existing direct inversion algorithms in phantoms, healthy volunteers and patients with liver fibrosis. We observed that the algorithm k-MDEV showing the best performance in phantoms and patients did not have the best repeatability. Our proposed method improved the diagnostic performance for advanced fibrosis, compared to classical direct inversion method, without a negative effect on repeatability.
Introduction
Various MR elastography algorithms were developed for the reconstruction of tissue mechanical parameters [1,2]. In order to evaluate the quality of MR elastography reconstructions, several criteria were described, such as, where is the shear wavelength and the voxel size [3]. A range of between 6 and 9 was described where discretization errors (low wavelength limit) and noise-driven errors (high wavelength limit) were minimal [4-6]. To improve reconstruction quality after the acquisition, we propose here an adaptative algorithm which resamples the shear wave displacements locally under the constraint of an optimal value based on the estimated shear wavelength at each pixel. The proposed method, called adaptative-AIDE, is compared with multimodel direct inversion (MMDI) [7] (available as commercial tool), multifrequency dual elastovisco inversion (MDEV) [8] and k-MDEV [9] (freely available).Theory
We implemented a classic algebraic inversion of the differential equation (AIDE) using a spatiotemporal Butterworth bandpass filter [10] to remove the long-wavelength compressional wave of the complex shear displacement $$$u(r)$$$. The stiffness ($$$G^*$$$) was reconstructed by inversion of the Helmholtz wave equation,$$G^*= ρω^2 ∑_n\frac{|u_n |}{|∇^2 u_n |}$$,
where $$$n=0…8$$$ are the directions of the filter. To apply the multiresolution algebraic inversion of the differential equation with the quality factor (adaptive-AIDE) we added three more steps.
1. A multiscale stiffness map was reconstructed according to the resampled matrix of shear displacement $$$u_j$$$, where $$$ j=1,1.25,0.65,0.8$$$ was the multiplication factor of the acquisition matrix size, chosen empirically.
$$G^*_j= ρω^2 ∑_n\frac{|(u_{j})_{n}|}{|∇^2 (u_j)_n | }$$,
2. A multiscale wavelength map was reconstructed using
$$λ_j=\sqrt{\frac{‖G^* ‖_j}{(ρ⋅ω^2 )}}$$.
3. A final stiffness map was produced at the acquisition resolution under the constraint of s value closest to 7:
$$G^{*}(\vec{r})=\left\{G^{*}_{j}(\vec{r})|\min\limits_{j}\left(abs\left(\frac{\lambda_{j}(\vec{r})}{a}-7\right)\right)\right\}$$
Methods
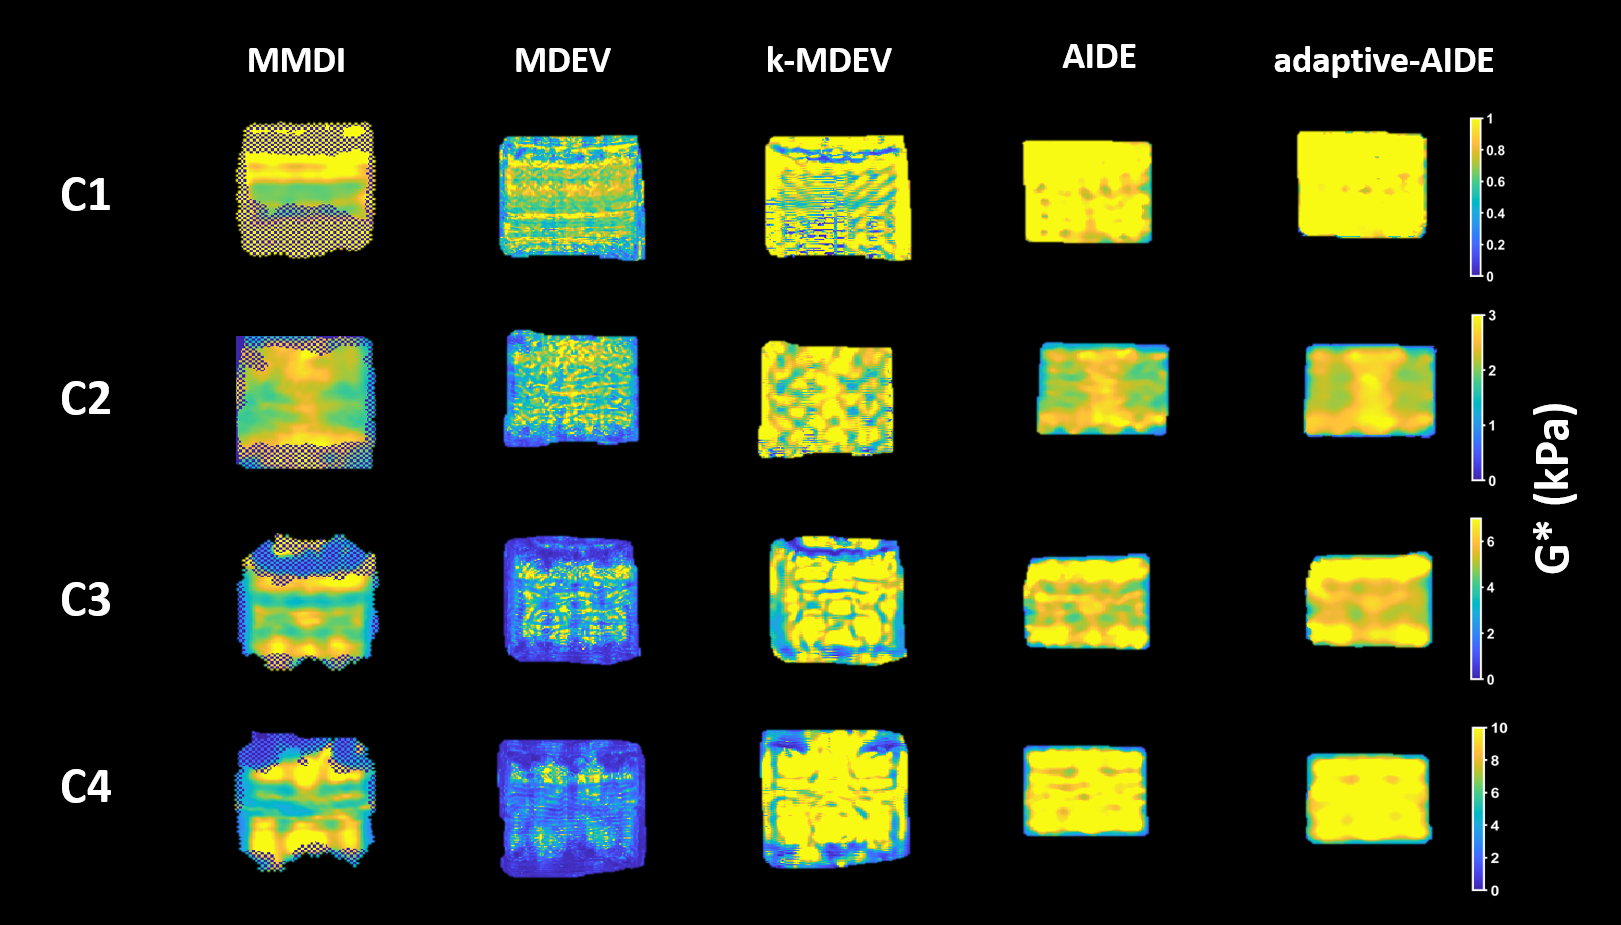
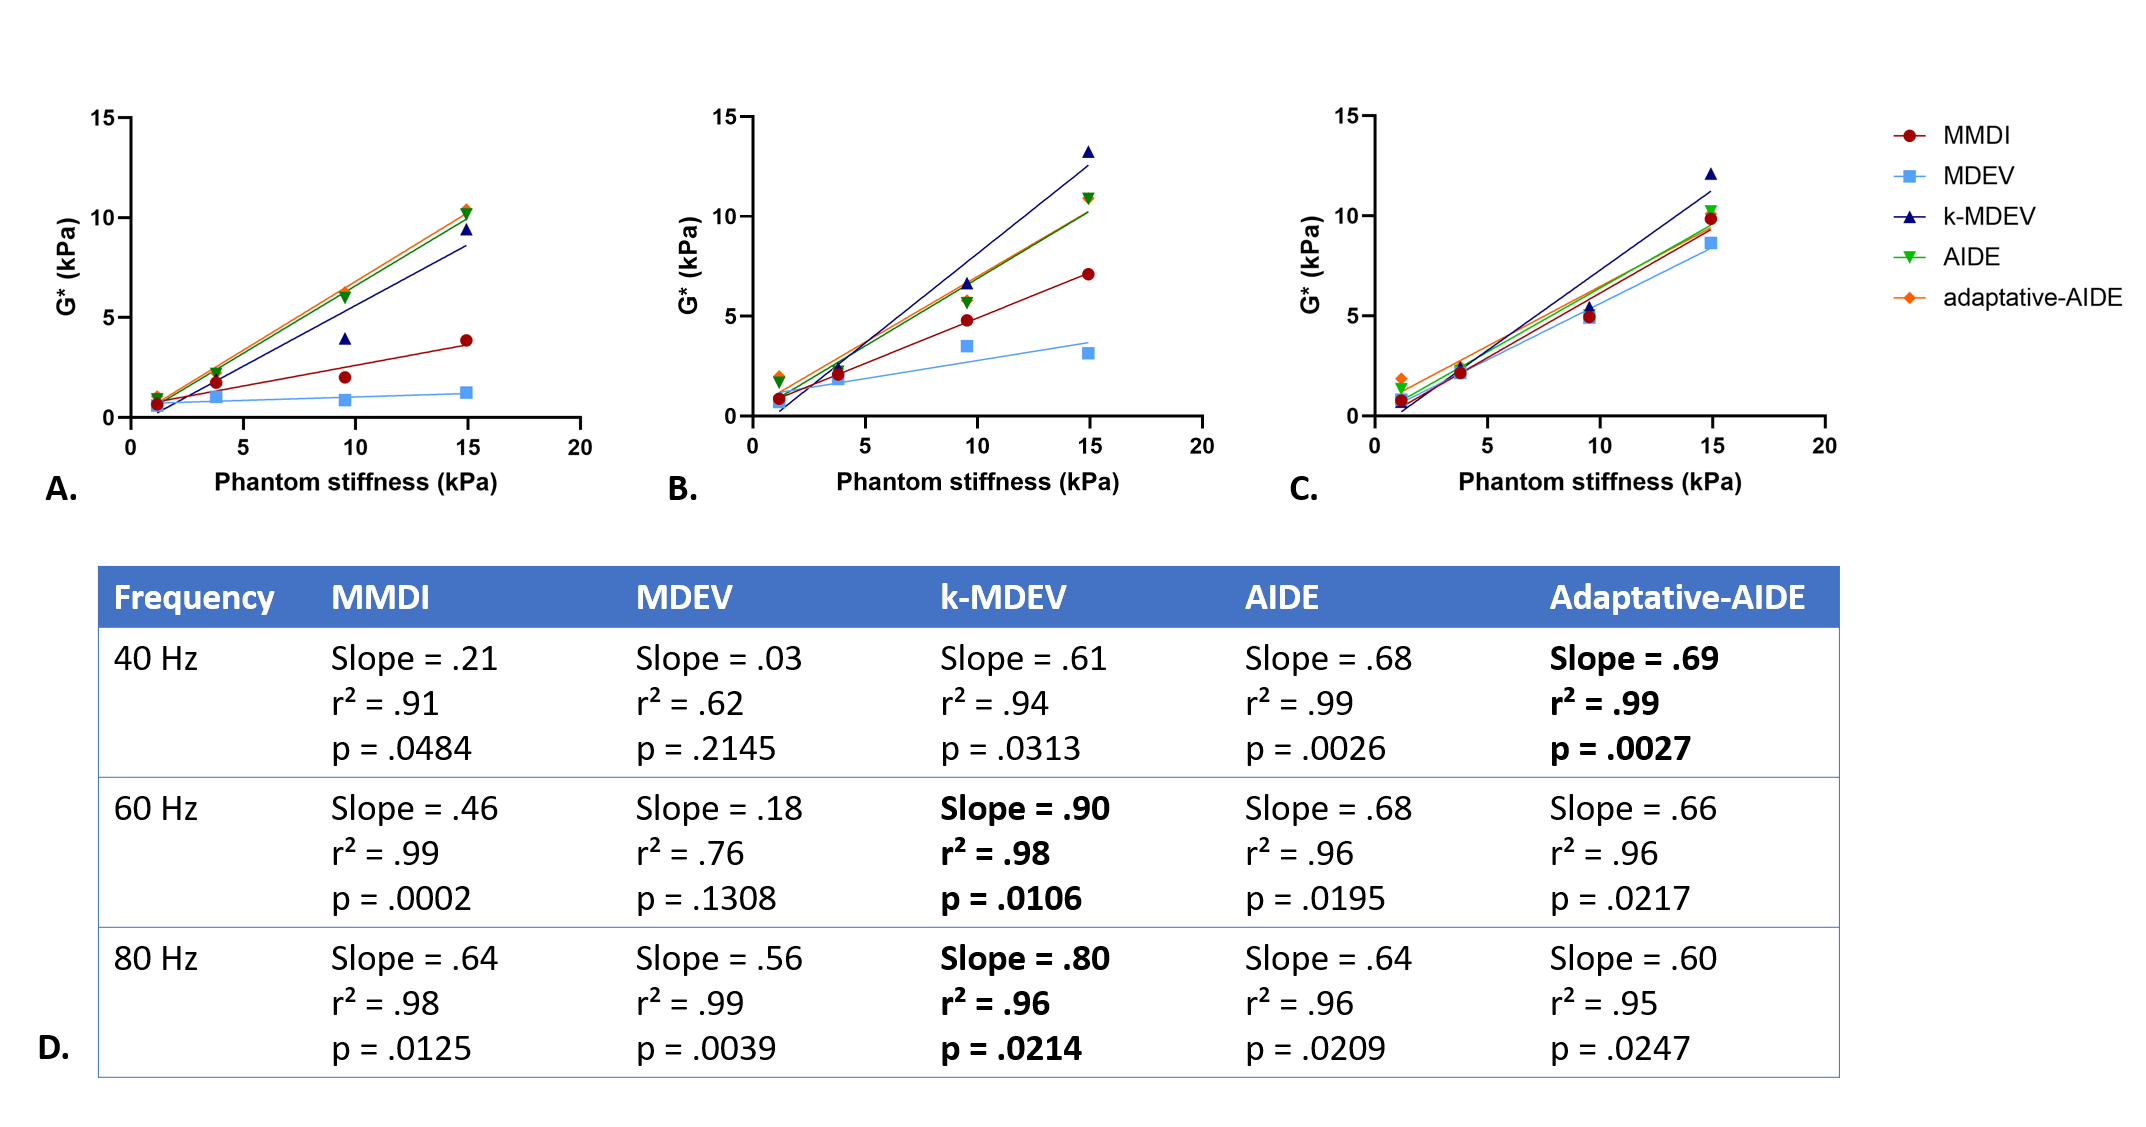
Five different direct inversion algorithms were compared: MMDI, MDEV, k-MDEV and our direct inversion algorithm with and without the quality factor optimization. MR elastography was performed on a 3T MR scanner (Ingenia, Philips, Eindhoven, The Netherlands) with the following parameters TR/TE: 50/20 ms, spatial resolution: 1.2 x 1.2 x 10 mm3, FOV: 400 x 450 mm2, 3 slices and 4 temporal steps. The acquisition sequence was repeated three times with a frequency of 40, 60 and 80Hz. For phantoms, volunteers and patients, the regions of interest used for processing were identical between all tested reconstruction methods. All human studies were performed in full compliance with ethical guidelines, with regulatory authorization from the local IRB and after having obtained informed consent.Phantom: We performed MR elastography in four homogeneous Zerdine solid hydrogel phantoms (Model 0369, CIRS, Arlington, VA, USA). The four phantoms (C1, C2, C3, C4) provided respective stiffnesses of 1.7, 3.8, 9.5 and 14.9 kPa. Linear regression was used to estimate the agreement between the stiffness values obtained with each tested reconstruction algorithm and the calibrated phantom stiffnesses.
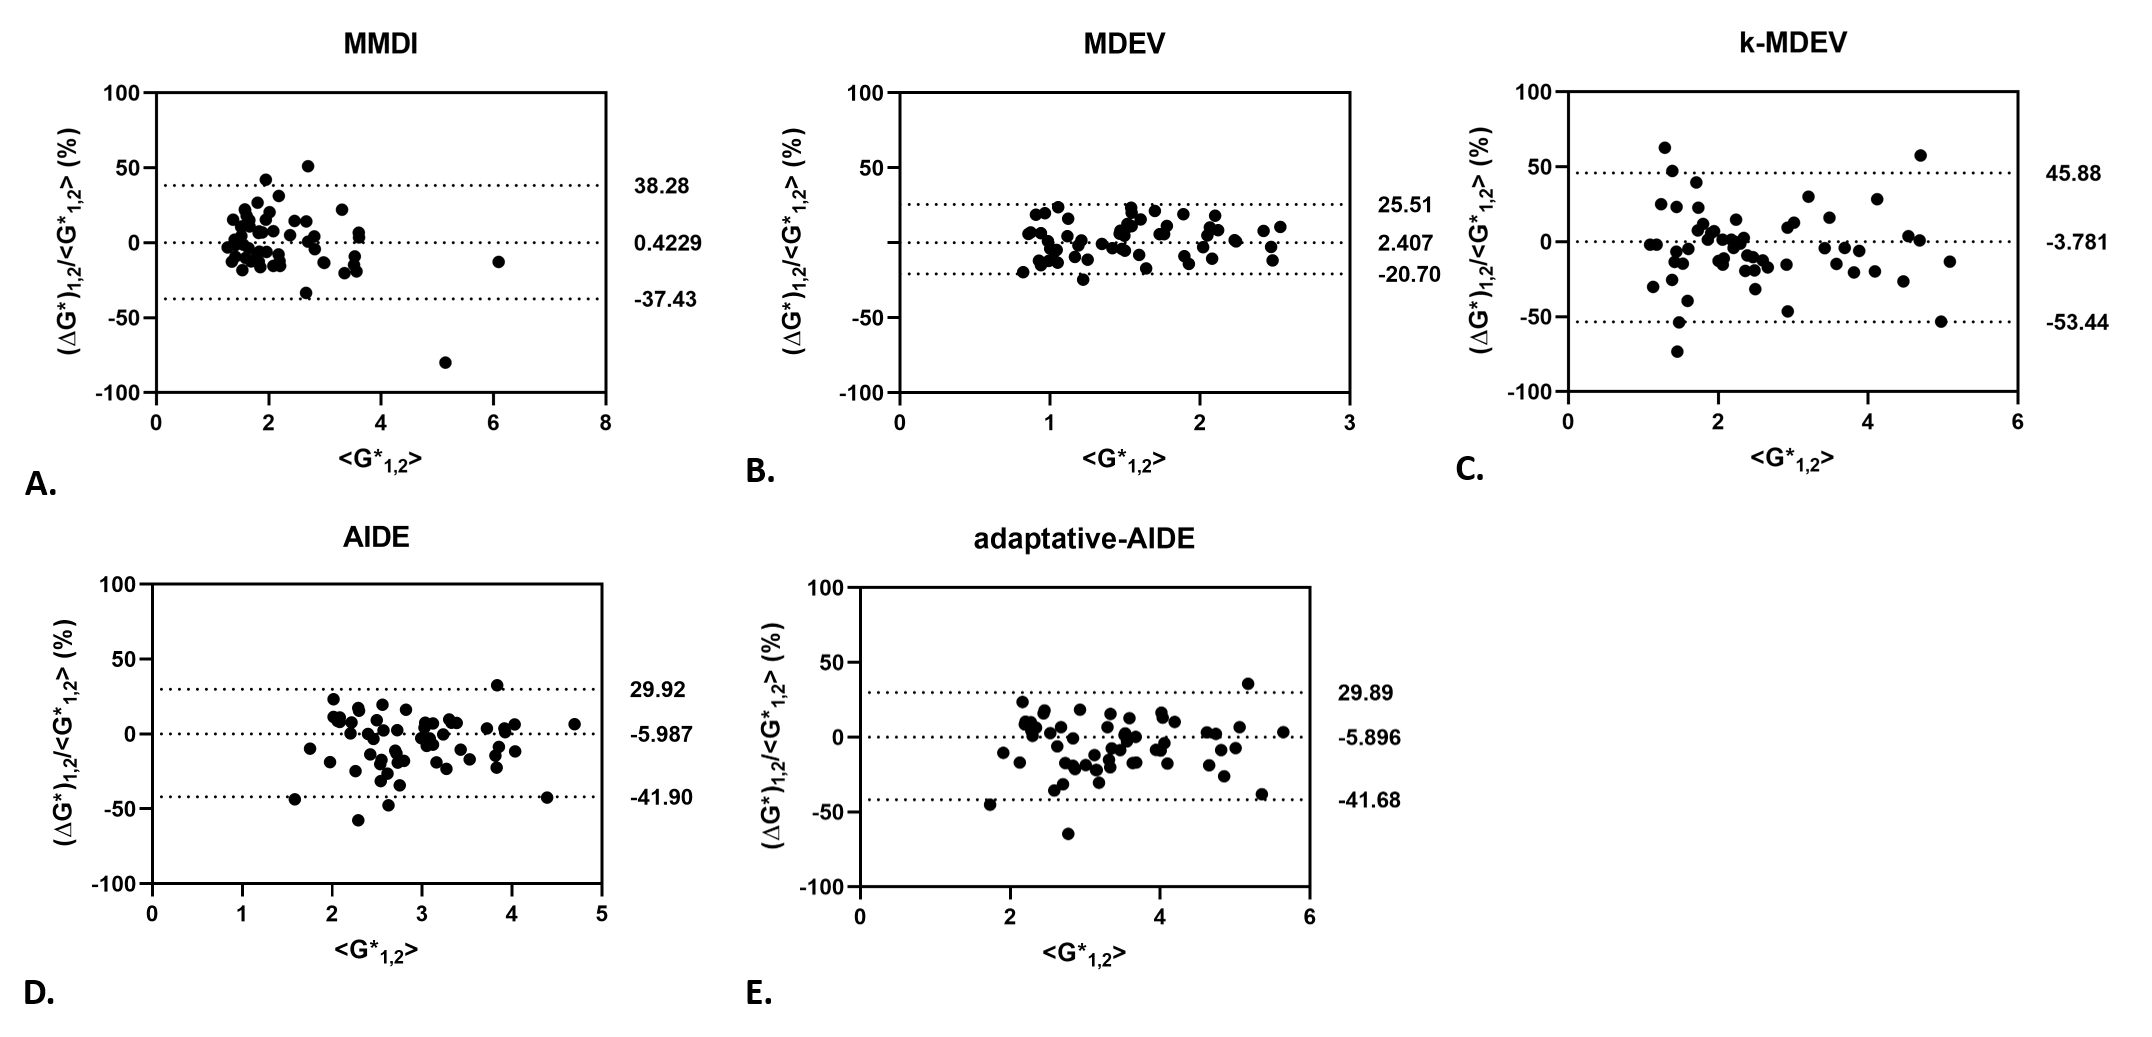
Healthy volunteers: The repeatability of each reconstruction algorithm was assessed in 20 healthy volunteers in a test-retest setting with patient repositioning (30 minutes interval between acquisitions). Bland-Altman was used to evaluate the repeatability of each algorithm and the repeatability index (RI) was calculated as RI = 1.96 x standard deviation of bias (%).
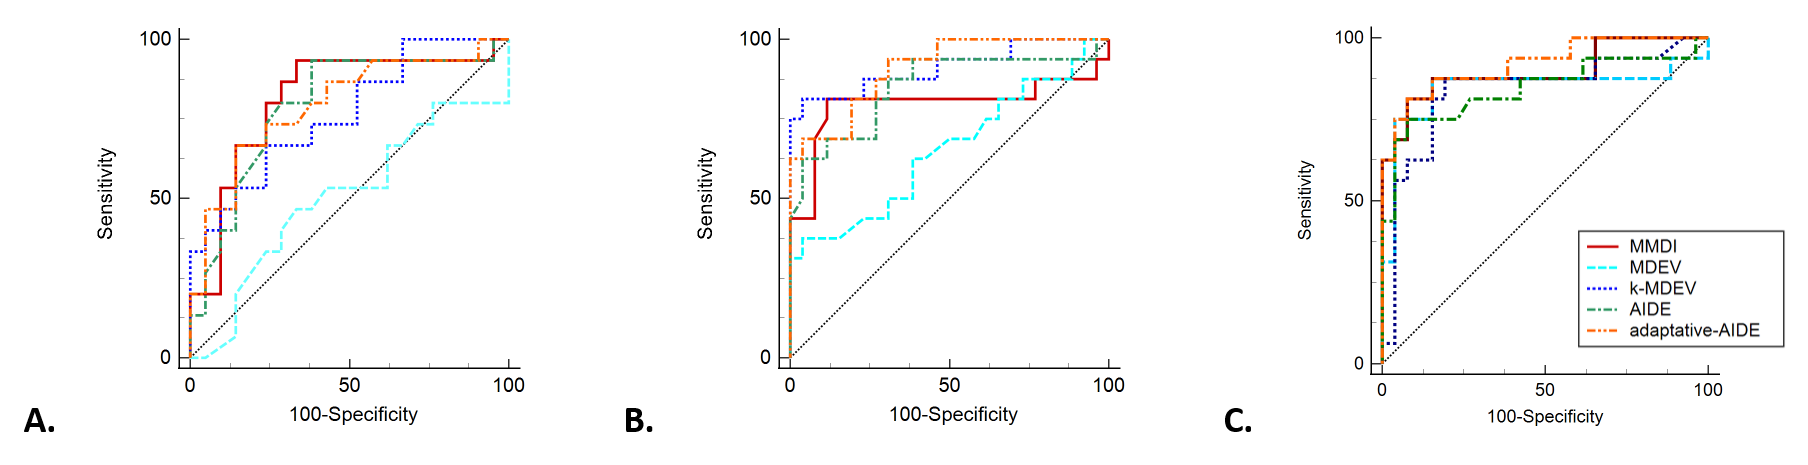
Patients: The ability to diagnose advanced liver fibrosis (fibrosis ≥ F3 as determined at histopathology) with each reconstruction algorithm was assessed in 46 patients with non-alcoholic fatty liver disease. The performance for diagnosing advanced fibrosis was assessed with the areas under the receiver operating curve (AUCs).
Results
Stiffness maps of the phantoms obtained at 60Hz are shown in Figure 1. From the linear regression between stiffness measured with the reconstruction method and the stiffness provided by the manufacturer (Figure 2), adaptative-AIDE provided the slope closest to 1 at 40Hz, whereas k-MDEV provided a slope closest to 1 at 60Hz and 80Hz.From the Bland-Altman analysis (Figure 3), repeatability indexes of 38%, 23%, 50%, 38% and 38% were found for MMDI, MDEV, k-MDEV, AIDE and adaptive-AIDE, respectively.
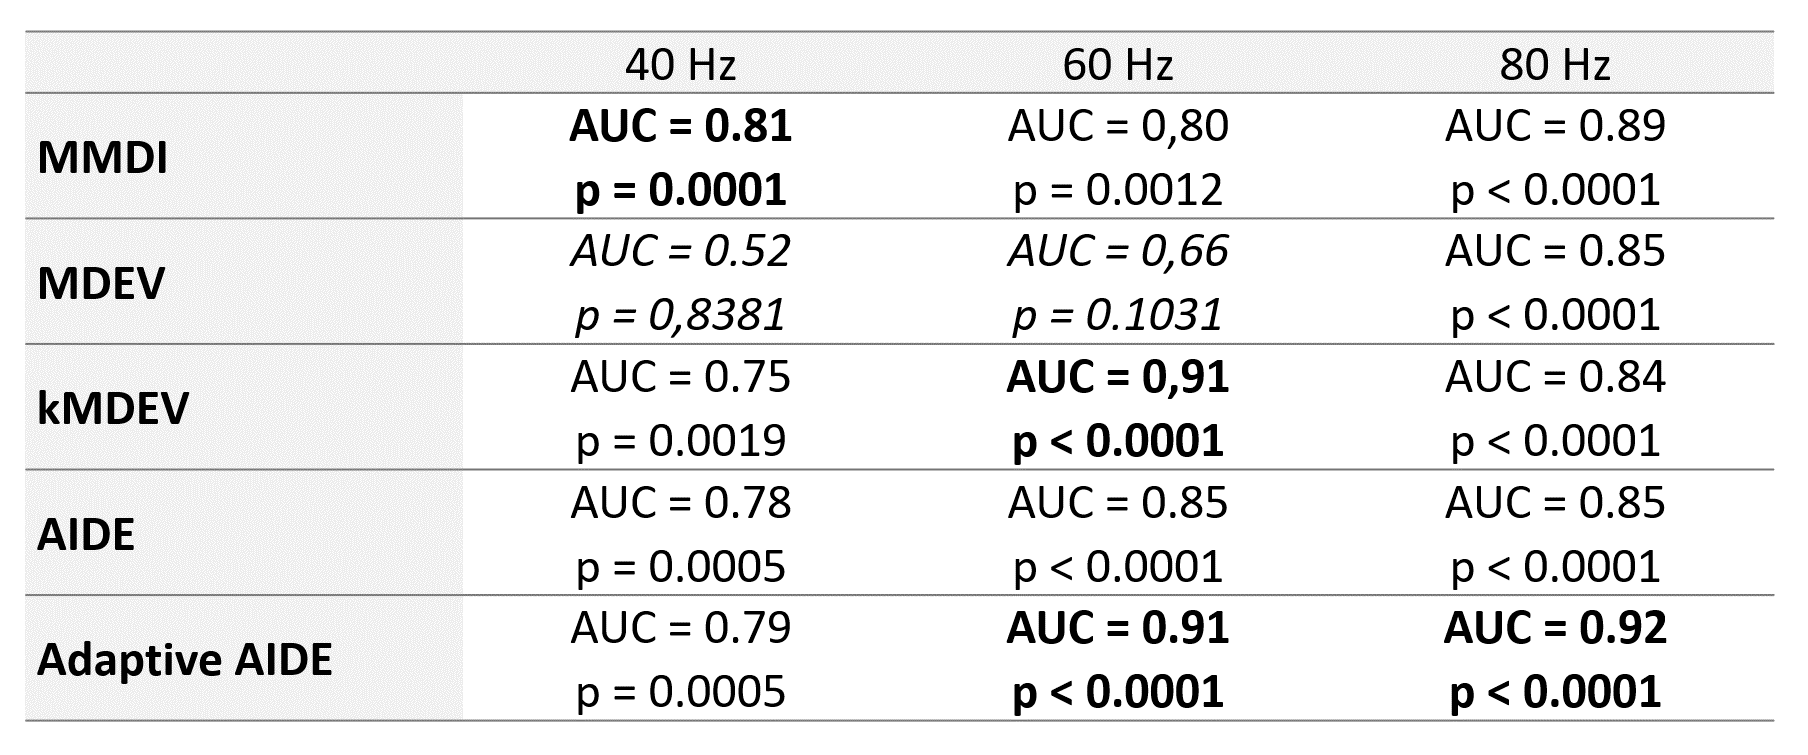
In diagnosing advanced fibrosis, 12 patients at 40Hz and 4 patients at 60Hz and 80Hz were not analyzed because the confidence area provided by the MMDI algorithm [7] was not sufficient to put a region of interest. At 40Hz, MMDI showed the best diagnostic performance in detecting advanced fibrosis (AUC=0.81, p=0.0001), whereas at 60Hz k-MDEV and adaptive-AIDE had the best diagnostic performance (AUC=0.91, p<0.0001 for both methods) and at 80Hz, adaptive-AIDE had the best AUC (AUC=0.92, p<0.0001), (Table and Figure 4).
Discussion
No reconstruction method showed the best performance in all tested settings. MDEV had the lowest agreement with calibrated values and the lowest diagnostic performance, but it showed the highest repeatability in volunteers, while k-MDEV showed good performance in phantoms and in diagnosing advanced liver fibrosis, but it had the lowest repeatability. The proposed adaptation of the spatial resolution to the local wavelength did not negatively impact the agreement with calibrated phantom values or the repeatability. However, it increased the diagnostic performance in detecting advanced fibrosis.Conclusion
Among already available algorithms, k-MDEV had the best performance in phantoms and patients. However, it had poor repeatability. Our results suggest that taking into consideration the spatial sampling by locally matching the resolution to the wavelength may improve the diagnostic performance of MRE for advanced liver fibrosis without negative impact on repeatability.Acknowledgements
This work was funded by the French National Research Agency (grant ANR-17-RHUB-0009) for the RHU Quid-Nash projectReferences
1. Fovargue, D.; Nordsletten, D.; Sinkus, R. Stiffness reconstruction methods for MR elastography. NMR Biomed 2018, 31, e3935, doi:10.1002/nbm.3935.
2. Manduca, A.; Bayly, P.J.; Ehman, R.L.; Kolipaka, A.; Royston, T.J.; Sack, I.; Sinkus, R.; Van Beers, B.E. MR elastography: Principles, guidelines, and terminology. Magn Reson Med 2021, 85, 2377-2390, doi:10.1002/mrm.28627.
3. Papazoglou, S.; Hamhaber, U.; Braun, J.; Sack, I. Algebraic Helmholtz inversion in planar magnetic resonance elastography. Phys Med Biol 2008, 53, 3147-3158, doi:10.1088/0031-9155/53/12/005.
4. Yue, J.L.; Tardieu, M.; Julea, F.; Boucneau, T.; Sinkus, R.; Pellot-Barakat, C.; Maitre, X. Acquisition and reconstruction conditions in silico for accurate and precise magnetic resonance elastography. Phys Med Biol 2017, 62, 8655-8670, doi:10.1088/1361-6560/aa9164.
5. Andoh, F.; Yue, J.L.; Julea, F.; Tardieu, M.; Noûs, C.; Pagé, G.; Garteiser, P.; Van Beers, B.E.; Maitre, X.; Pellot-Barakat, C. Multifrequency magnetic resonance elastography for elasticity quantitation and optimal tissue discrimination: A two-platform liver fibrosis mimicking phantom study. NMR Biomed 2021, 34, e4543, doi:10.1002/nbm.4543.
6. Mura, J.; Schrank, F.; Sack, I. An analytical solution to the dispersion-by-inversion problem in magnetic resonance elastography. Magn Reson Med 2020, 84, 61-71, doi:10.1002/mrm.28247.
7. Silva, A.M.; Grimm, R.C.; Glaser, K.J.; Fu, Y.; Wu, T.; Ehman, R.L.; Silva, A.C. Magnetic resonance elastography: evaluation of new inversion algorithm and quantitative analysis method. Abdom Imaging 2015, 40, 810-817, doi:10.1007/s00261-015-0372-5.
8. Hirsch, S.; Guo, J.; Reiter, R.; Papazoglou, S.; Kroencke, T.; Braun, J.; Sack, I. MR elastography of the liver and the spleen using a piezoelectric driver, single‐shot wave‐field acquisition, and multifrequency dual parameter reconstruction. Magnetic resonance in medicine 2014, 71, 267-277.
9. Tzschatzsch, H.; Guo, J.; Dittmann, F.; Hirsch, S.; Barnhill, E.; Johrens, K.; Braun, J.; Sack, I. Tomoelastography by multifrequency wave number recovery from time-harmonic propagating shear waves. Med Image Anal 2016, 30, 1-10, doi:10.1016/j.media.2016.01.001.
10. Manduca, A.; Lake, D.S.; Kruse, S.A.; Ehman, R.L. Spatio-temporal directional filtering for improved inversion of MR elastography images. Medical image analysis 2003, 7, 465-473.
Figures