2232
Deep learning-based tumor segmentation from postoperative MRI1Computational Radiology and Artificial Intelligence, Oslo University Hospital, Oslo, Norway, 2Department of Physics, University of Oslo, Oslo, Norway, 3The Intervention Centre, Oslo University Hospital, Oslo, Norway, 4Faculty of Medicine, University of Oslo, Oslo, Norway
Synopsis
To accurately detect and localize postoperative tumor after surgery is of critical importance to postoperative patient management and survial rate. We propose a fully automated end-to-end coarse-to-fine segmentation approach for the segmentation of posoperative tumor.
Introduction
In spite of recent advances in therapeutic options, the extent of surgical resection remains the most important predictor of both progression-free survival and overall survival in glioblastoma patients1. Automated methods to quantify the extent of resection could aid in postoperative patient management, and deep learning (DL) has proved successful in a range of tumor segmentation tasks2-4. However, robust classification of postoperative changes from MRI is challenging due to significant deformation in the overall geometry and surgically induced signal components mimicking tumors. To this end, the aim of this study was to develop a DL model for robust segmentation and classification of the tumor, edema, and postoperative changes from early postoperative MRIs.Methods
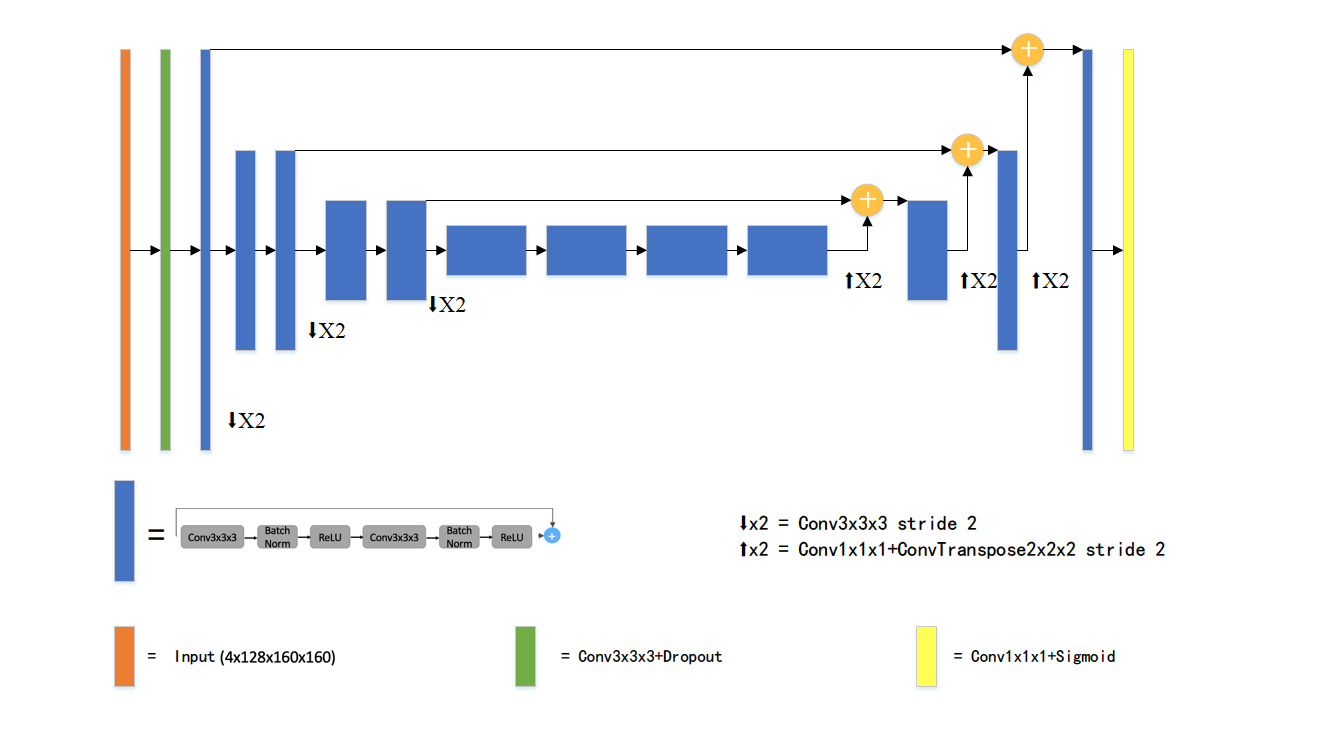
Postoperative MRI series from 20 glioblastoma patients obtained 2 weeks after surgery were included in the analysis. The four MRI series used were volumetric T1-weighted pre- and post- contrast, FLAIR and T2-weighted series. The whole dataset consists of all modalities from 17 patients. A separate test set of three patients is reserved for evaluation of the model. The four sequences were concatenated along channel dimension and were normalized to have zero mean and unit variance based on brain region only. The input data were randomly cropped to a fixed size of 128x160x160.The proposed network was based on an asymmetric 3D U-net variant. The network consists of an asymmetric encoder-decoder structure2,3. The network has a larger encoder part to extract complex image features, and a smaller decoder to reconstruct a segmentation mask with the same input size. The encoder is composed of several pre-activated residual blocks5,6, each of which consists of two 3x3x3 convolution with Bach Normalization and Rectified Linear Unit (ReLU) activation, followed by additive identity skip connection. During training, we first train the network to predict a coarse binary segmentation, which gives a bounding box of the whole tumor region7. The copped patch of the original input is used as the input of the fine segmentation.The output of the network has three channels, representing tumor sub-regions. The average Dice similarity was used as the loss function. All the experiments are implemented in Pytorch8. Adam optimizer was used with an initial learning rate of 0.0001 which decayed with a polynomial schedule. The number of training epochs is set to 300.Extensive data augmentation was applied on-the-fly during training to artificially enlarge the training set. We randomly flip along each spatial axes with a probability of 0.5 and apply a small random intensity shift and scale on input image channels. Five-fold cross validation is performed as an ensemble to evaluate the model performance. Ensemble of models are trained to reduce the variance and further improve the segmentation results. At test time, a sliding window approach was applied to obtain whole volume prediction. Test-time augmentation (TTA) including flipping and rotation were used9.Results and Discussion
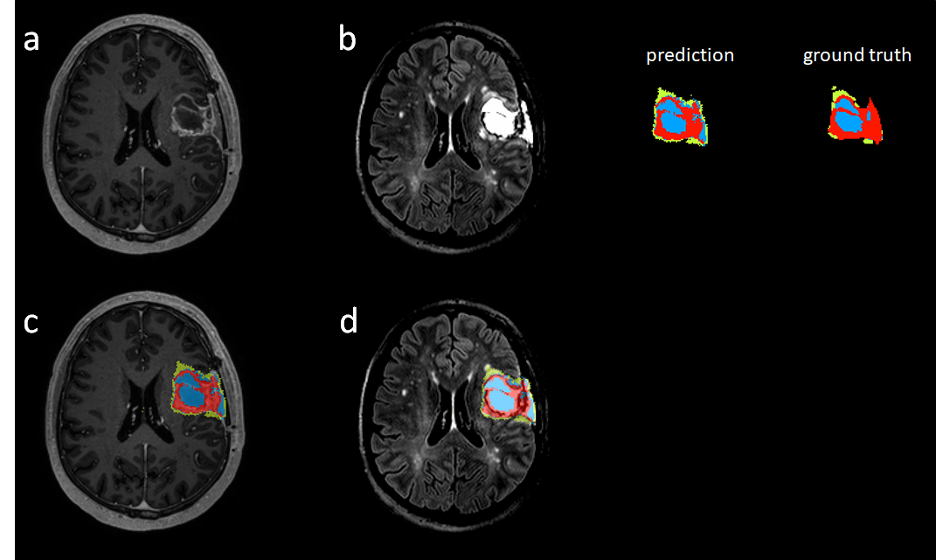
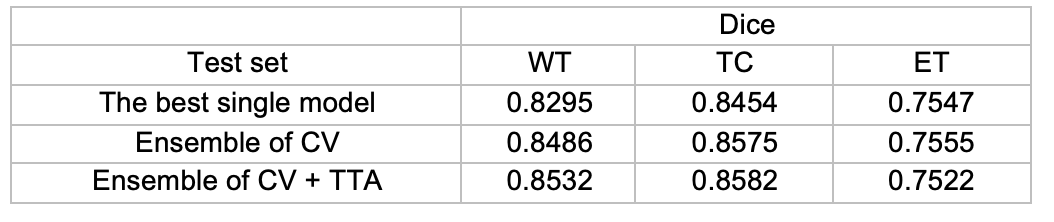
DSC scores of the test set for each tumor region are reported in Table 1. By aggregating the probability maps from cross-validation (CV), the dice results are increased for all three regions with whole tumor improves most. Test-time augmentation gently boosts the performance for WT and TC at the cost of slightly worse ET results. Figure 2 shows the visual segmentation results of the proposed method, where T1 post-contrast and FLIAR segmentation results are compared.CONCLUSION
The proposed deep learning architecture can predict accurate segmentations of postoperative tumor despite the limited amount of available data. A coarse segmentation localize the tumor site, thus gives a ‘focus’ to the network, preserving the spatial resolution. By performing extensive data augmentation and ensemble strategy, the segmentation results can be further improved.Acknowledgements
No acknowledgement found.References
1. Keles GE, Chang EF, Lamborn KR, et al.: Volumetric extent of resection and residual contrast enhancement on initial surgery as predictors of outcome in adult patients with hemispheric anaplastic astrocytoma. J Neurosurg 2006; 105:34–40.
2. Myronenko A: 3D MRI brain tumor segmentation using autoencoder regularization. Lect Notes Comput Sci (including Subser Lect Notes Artif Intell Lect Notes Bioinformatics) 2019; 11384 LNCS:311–320.
3. Jiang Z, Ding C, Liu M, Tao D: Two-stage cascaded u-net: 1st place solution to brats challenge 2019 segmentation task. Lect Notes Comput Sci (including Subser Lect Notes Artif Intell Lect Notes Bioinformatics) 2020; 11992 LNCS(May):231–241.
4. Isensee F, Jaeger PF, Full PM, Vollmuth P, Maier-Hein KH: nnU-Net for Brain Tumor Segmentation. 2020:1–15.
5. He K, Zhang X, Ren S, Sun J: Deep Residual Learning for Image Recognition. Proc IEEE Comput Soc Conf Comput Vis Pattern Recognit 2015; 2016-December:770–778.
6. He K, Zhang X, Ren S, Sun J: Identity Mappings in Deep Residual Networks. Lect Notes Comput Sci (including Subser Lect Notes Artif Intell Lect Notes Bioinformatics) 2016; 9908 LNCS:630–645.
7. Wang G, Li W, Ourselin S, Vercauteren T: Automatic brain tumor segmentation using cascaded anisotropic convolutional neural networks. Lect Notes Comput Sci (including Subser Lect Notes Artif Intell Lect Notes Bioinformatics) 2018; 10670 LNCS:178–190.
8. Paszke A, Gross S, Chintala S, et al.: Automatic differentiation in PyTorch.
9. Lee K, Zung J, Li P, Jain V, Seung HS: Superhuman Accuracy on the SNEMI3D Connectomics Challenge. 2017(Nips):1–11.
Figures