2229
Cross-sectional robustness of 6 freely available software packages for brain volume measurements in multiple sclerosis1Radiology and nuclear medicine, Amsterdam UMC, location VUmc, Amsterdam, Netherlands, 2Neuroscience research center, Kerman University of Medical Sciences, Kerman, Iran (Islamic Republic of), 3Anatomy and Neurosciences, Amsterdam UMC, location VUmc, Amsterdam, Netherlands, 4Institutes of Neurology and Healthcare Engineering, UCL London, London, United Kingdom
Synopsis
Automated segmentation of brain MR images has paved the way for large cohort atrophy studies in multiple sclerosis (MS). A variety of automated software packages is available. Here we aimed to quantify brain volume differences measured by six freely available software packages on data from 21 MS patients all scanned thrice on three different MR scanners. While intra-class correlation coefficients were high, systematic differences between scanners were found for every software. This suggests that direct comparison of volumes acquired with different scanners is not possible and standardization is needed.
Introduction
Brain atrophy measurement using magnetic resonance imaging (MRI) is an important way to assess disease progression in multiple sclerosis (MS)1, 2. Automated brain segmentation techniques enable effective processing of images instead of the time-consuming manual segmentation. However, brain volumetry in MS is still challenging, e.g. due to differences in acquisition protocols, analysis software and disease-related factors such as lesions3. Furthermore, segmentation is also affected by technological differences between scanner vendors, models or field strength4. These effects are more pronounced in multi-center trials and especially in the clinical setting, where MR scanners and acquisition protocols can vary frequently. Quantifying differences will provide an improved understanding of the resulting variability in atrophy measures, as well as mitigation of that variability. For the segmentation, several automated methods have been proposed, applying different approaches. Here we perform a comparison of reliability and repeatability between three different MR-scanners applying six freely available brain volume segmentation techniques. Additionally, we analyze the effect of lesion-filling on robustness in MS-brain volumetry.Method
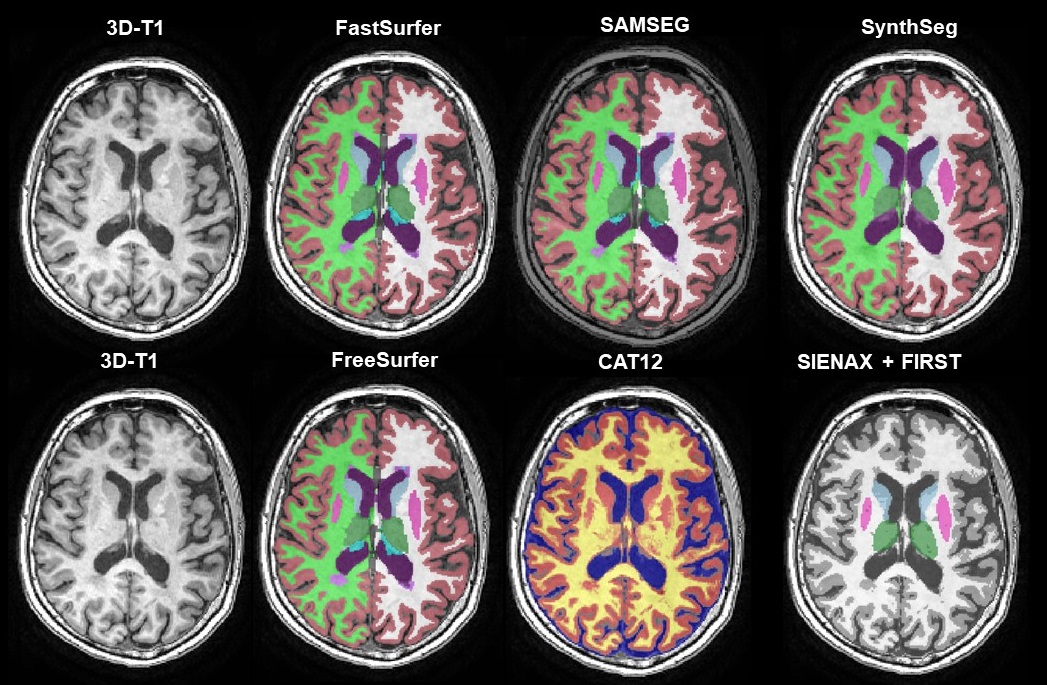
21 subjects with MS (relapsing remitting MS n=16; secondary progressive MS n=1; and primary progressive MS n=4), underwent a scan and rescan on three 3T MRI scanners (GE MR750, Philips Ingenuity, Toshiba Vantage Titan). The acquired images were 3D T1-weighted and on the GE an additional 3D FLAIR was scanned, using locally optimized acquisition protocols. Details of the acquisition have been described elsewhere5. Lesion segmentation on the FLAIR images was performed with nicMS lesions using an optimal threshold of 0.56, 7. The lesion probability maps were registered to the vendor-specific T1 space with FLIRT8. Thereafter, lesion filling was performed using LEAP3. Both filled and un-preprocessed 3D T1 images were segmented with FreeSurfer (v7.1), FSL (SIENAX & FIRST), Sequence Adaptive Multimodal SEGmentation (SAMSEG), FastSurfer (a deep learning approach based on FreeSurfer), CAT-12 and SynthSeg (a deep learning approach trained on synthetic data) (Figure 1)9-16. For all software packages the latest version and the recommended options were used (e.g. in FreeSurfer -3T –all). Both repeatability and reproducibility were assessed cross-sectionally using the intra-class correlation coefficient (ICC) based on the 95% confidence interval for absolute agreement and for consistency, respectively. The ICC-values were classified according to the standards of Koo and Li (2016)17. Reproducibility was additionally assessed with repeated measures ANOVA or Friedmann test for non-parametric data. If appropriate, post-hoc testing was performed using pairwise t-tests or Wilcoxon signed rank tests. Reported p-values are Bonferroni corrected.Results
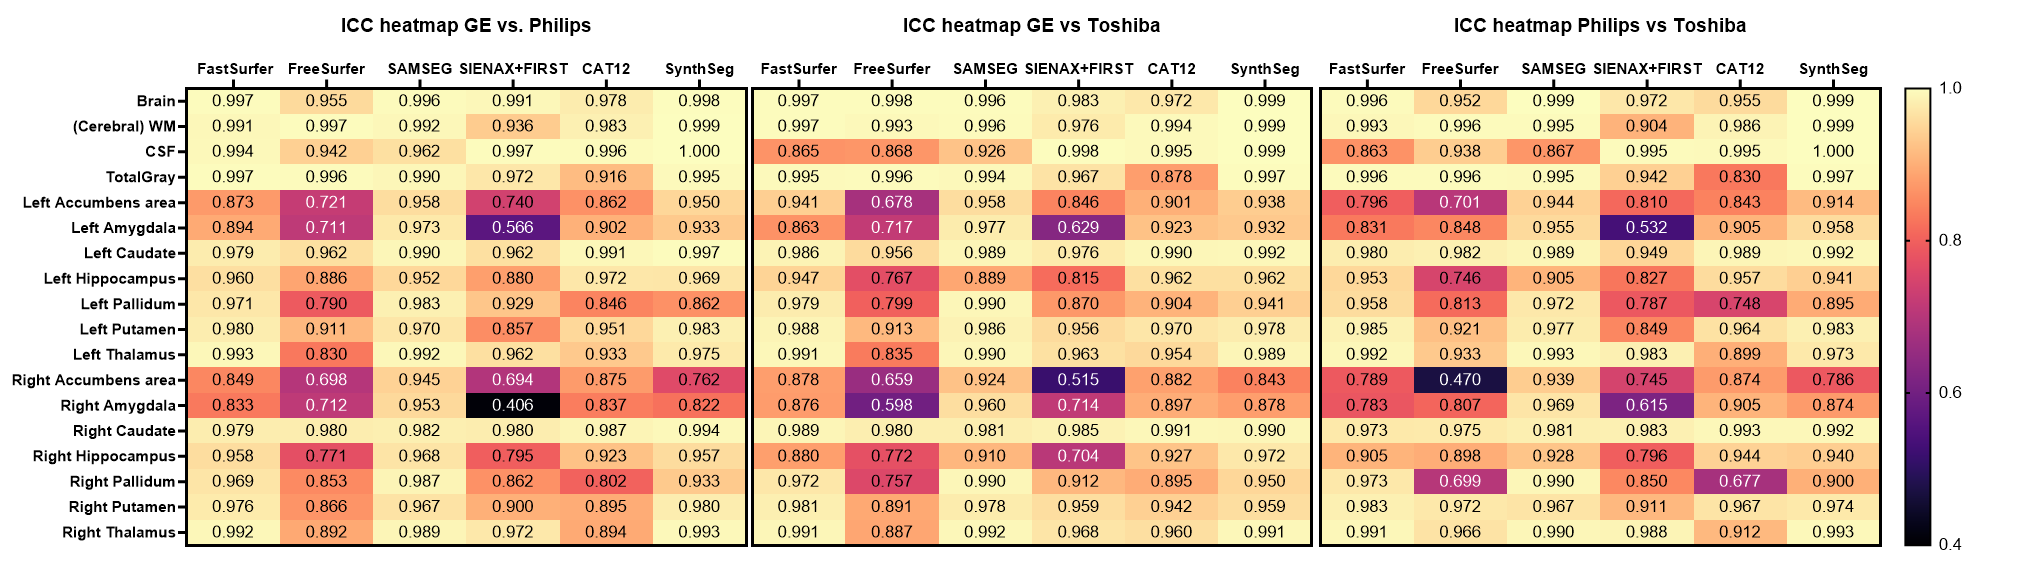
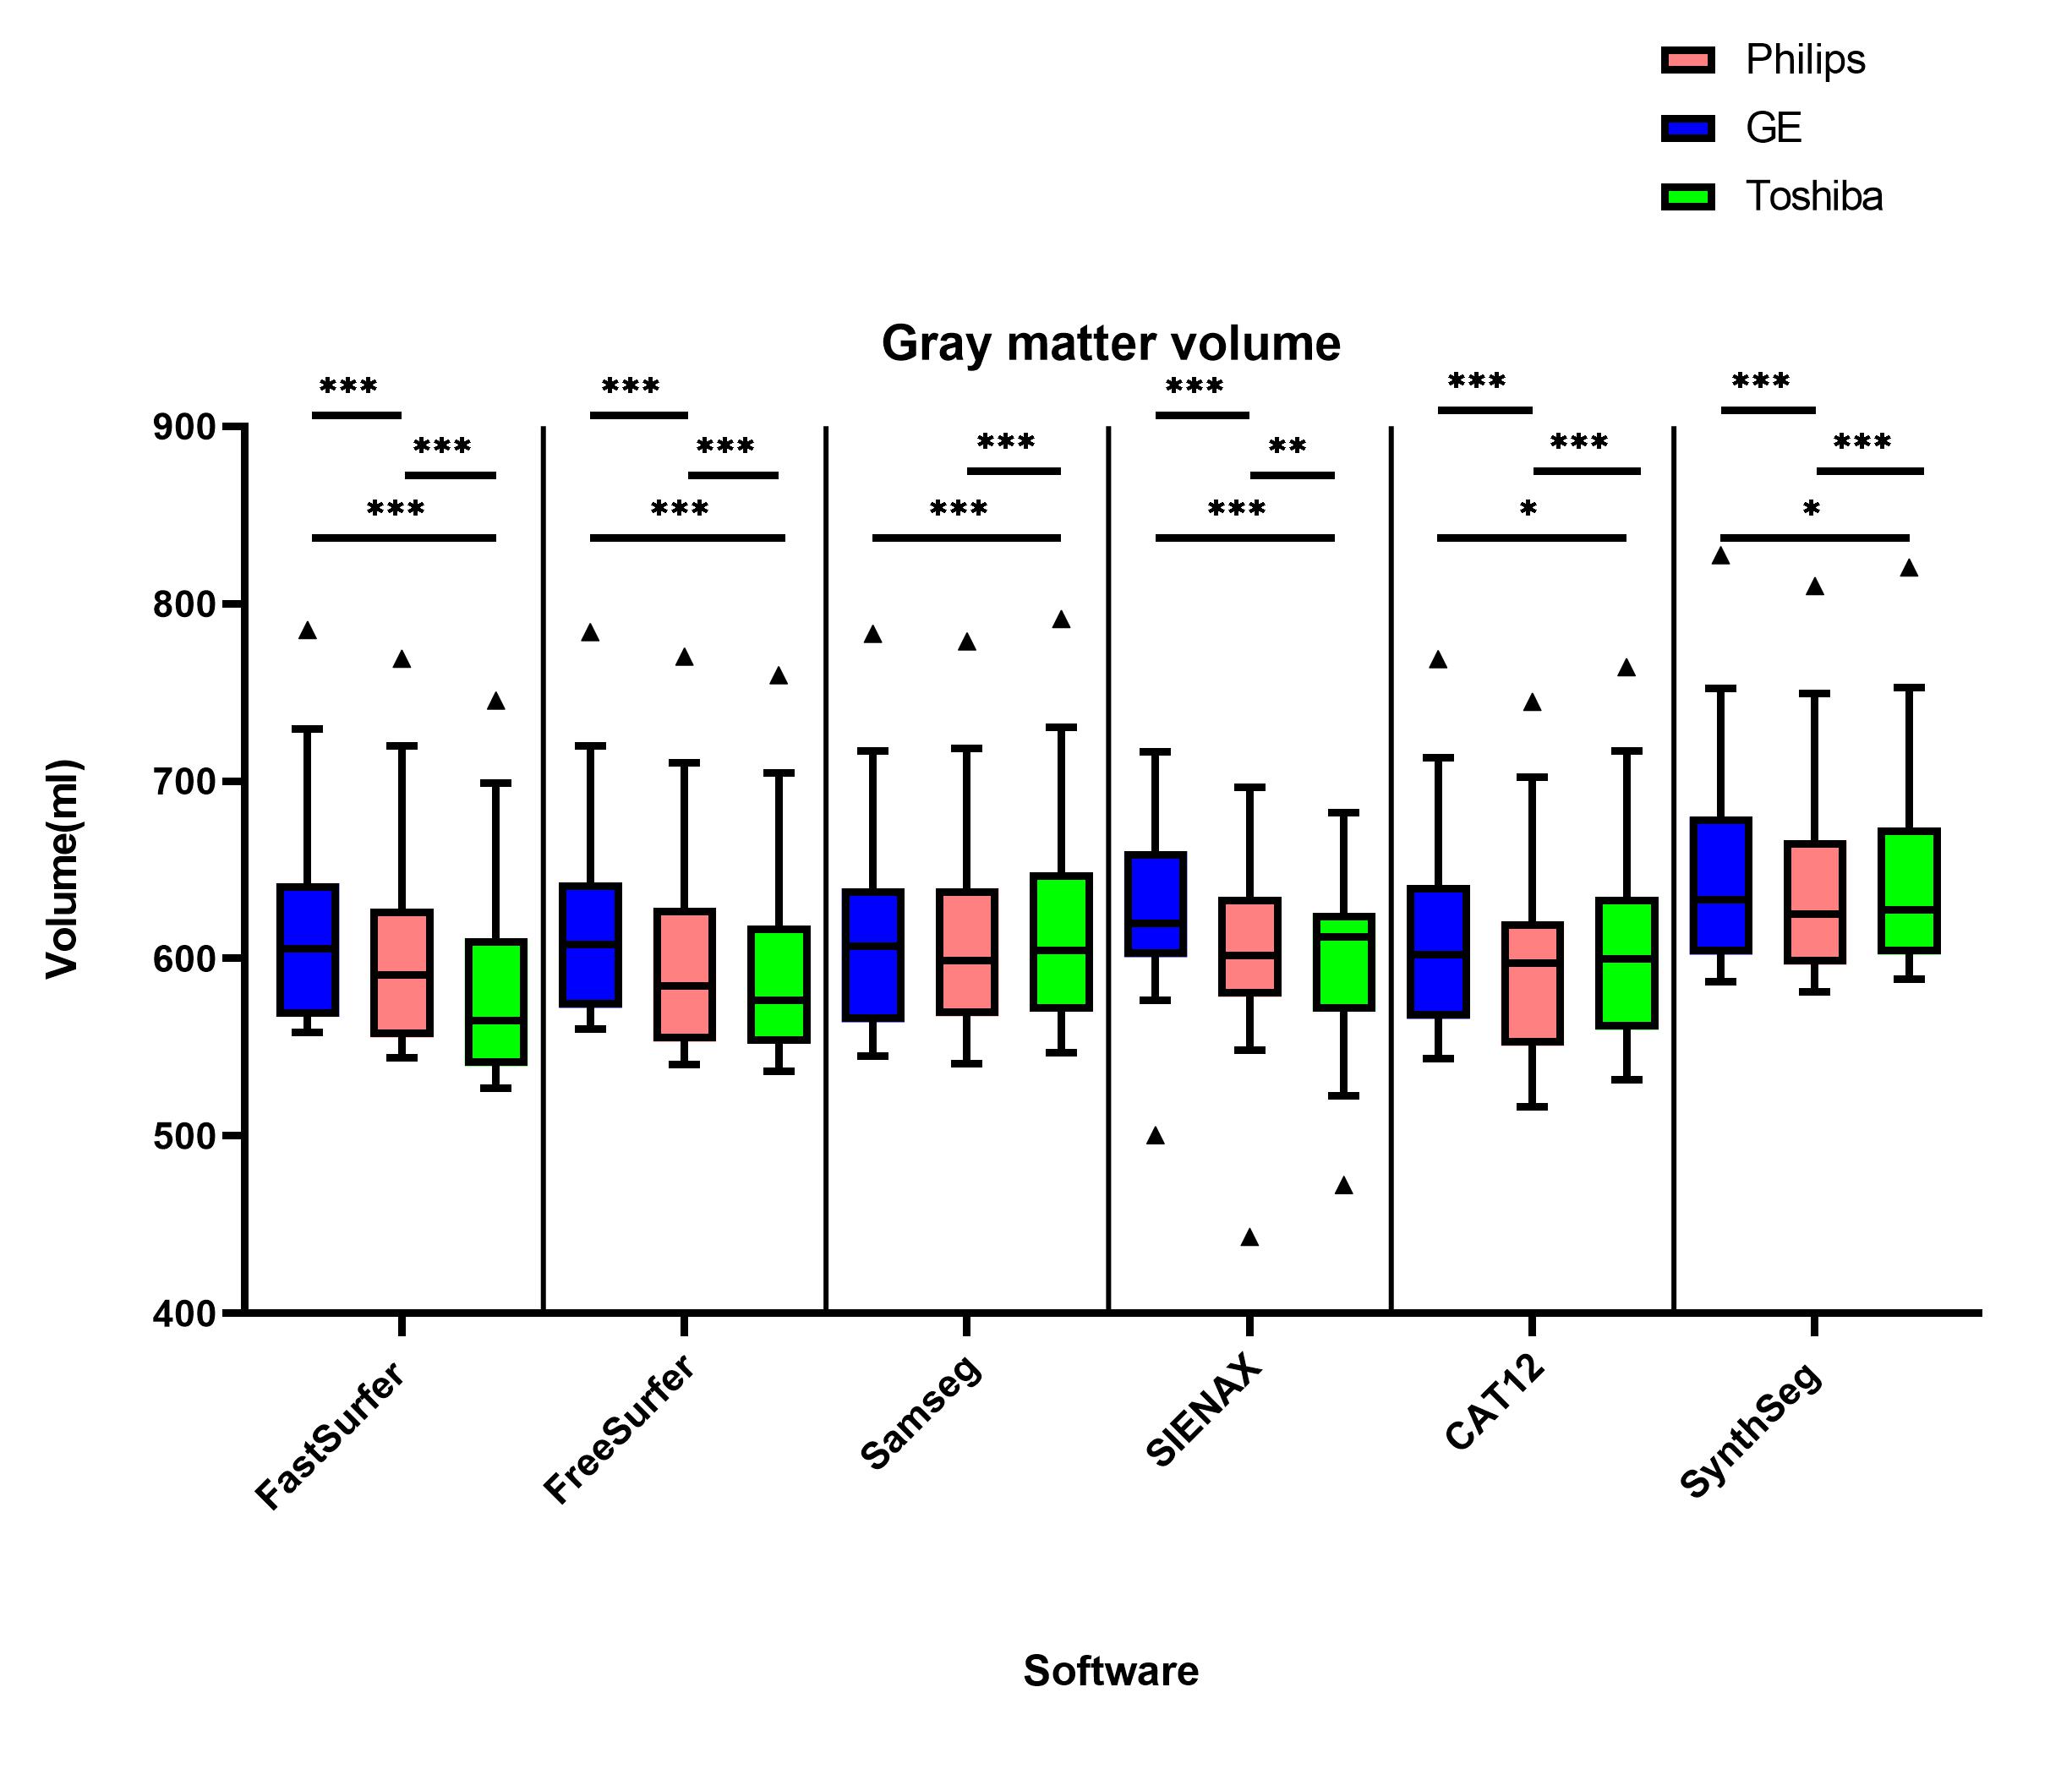
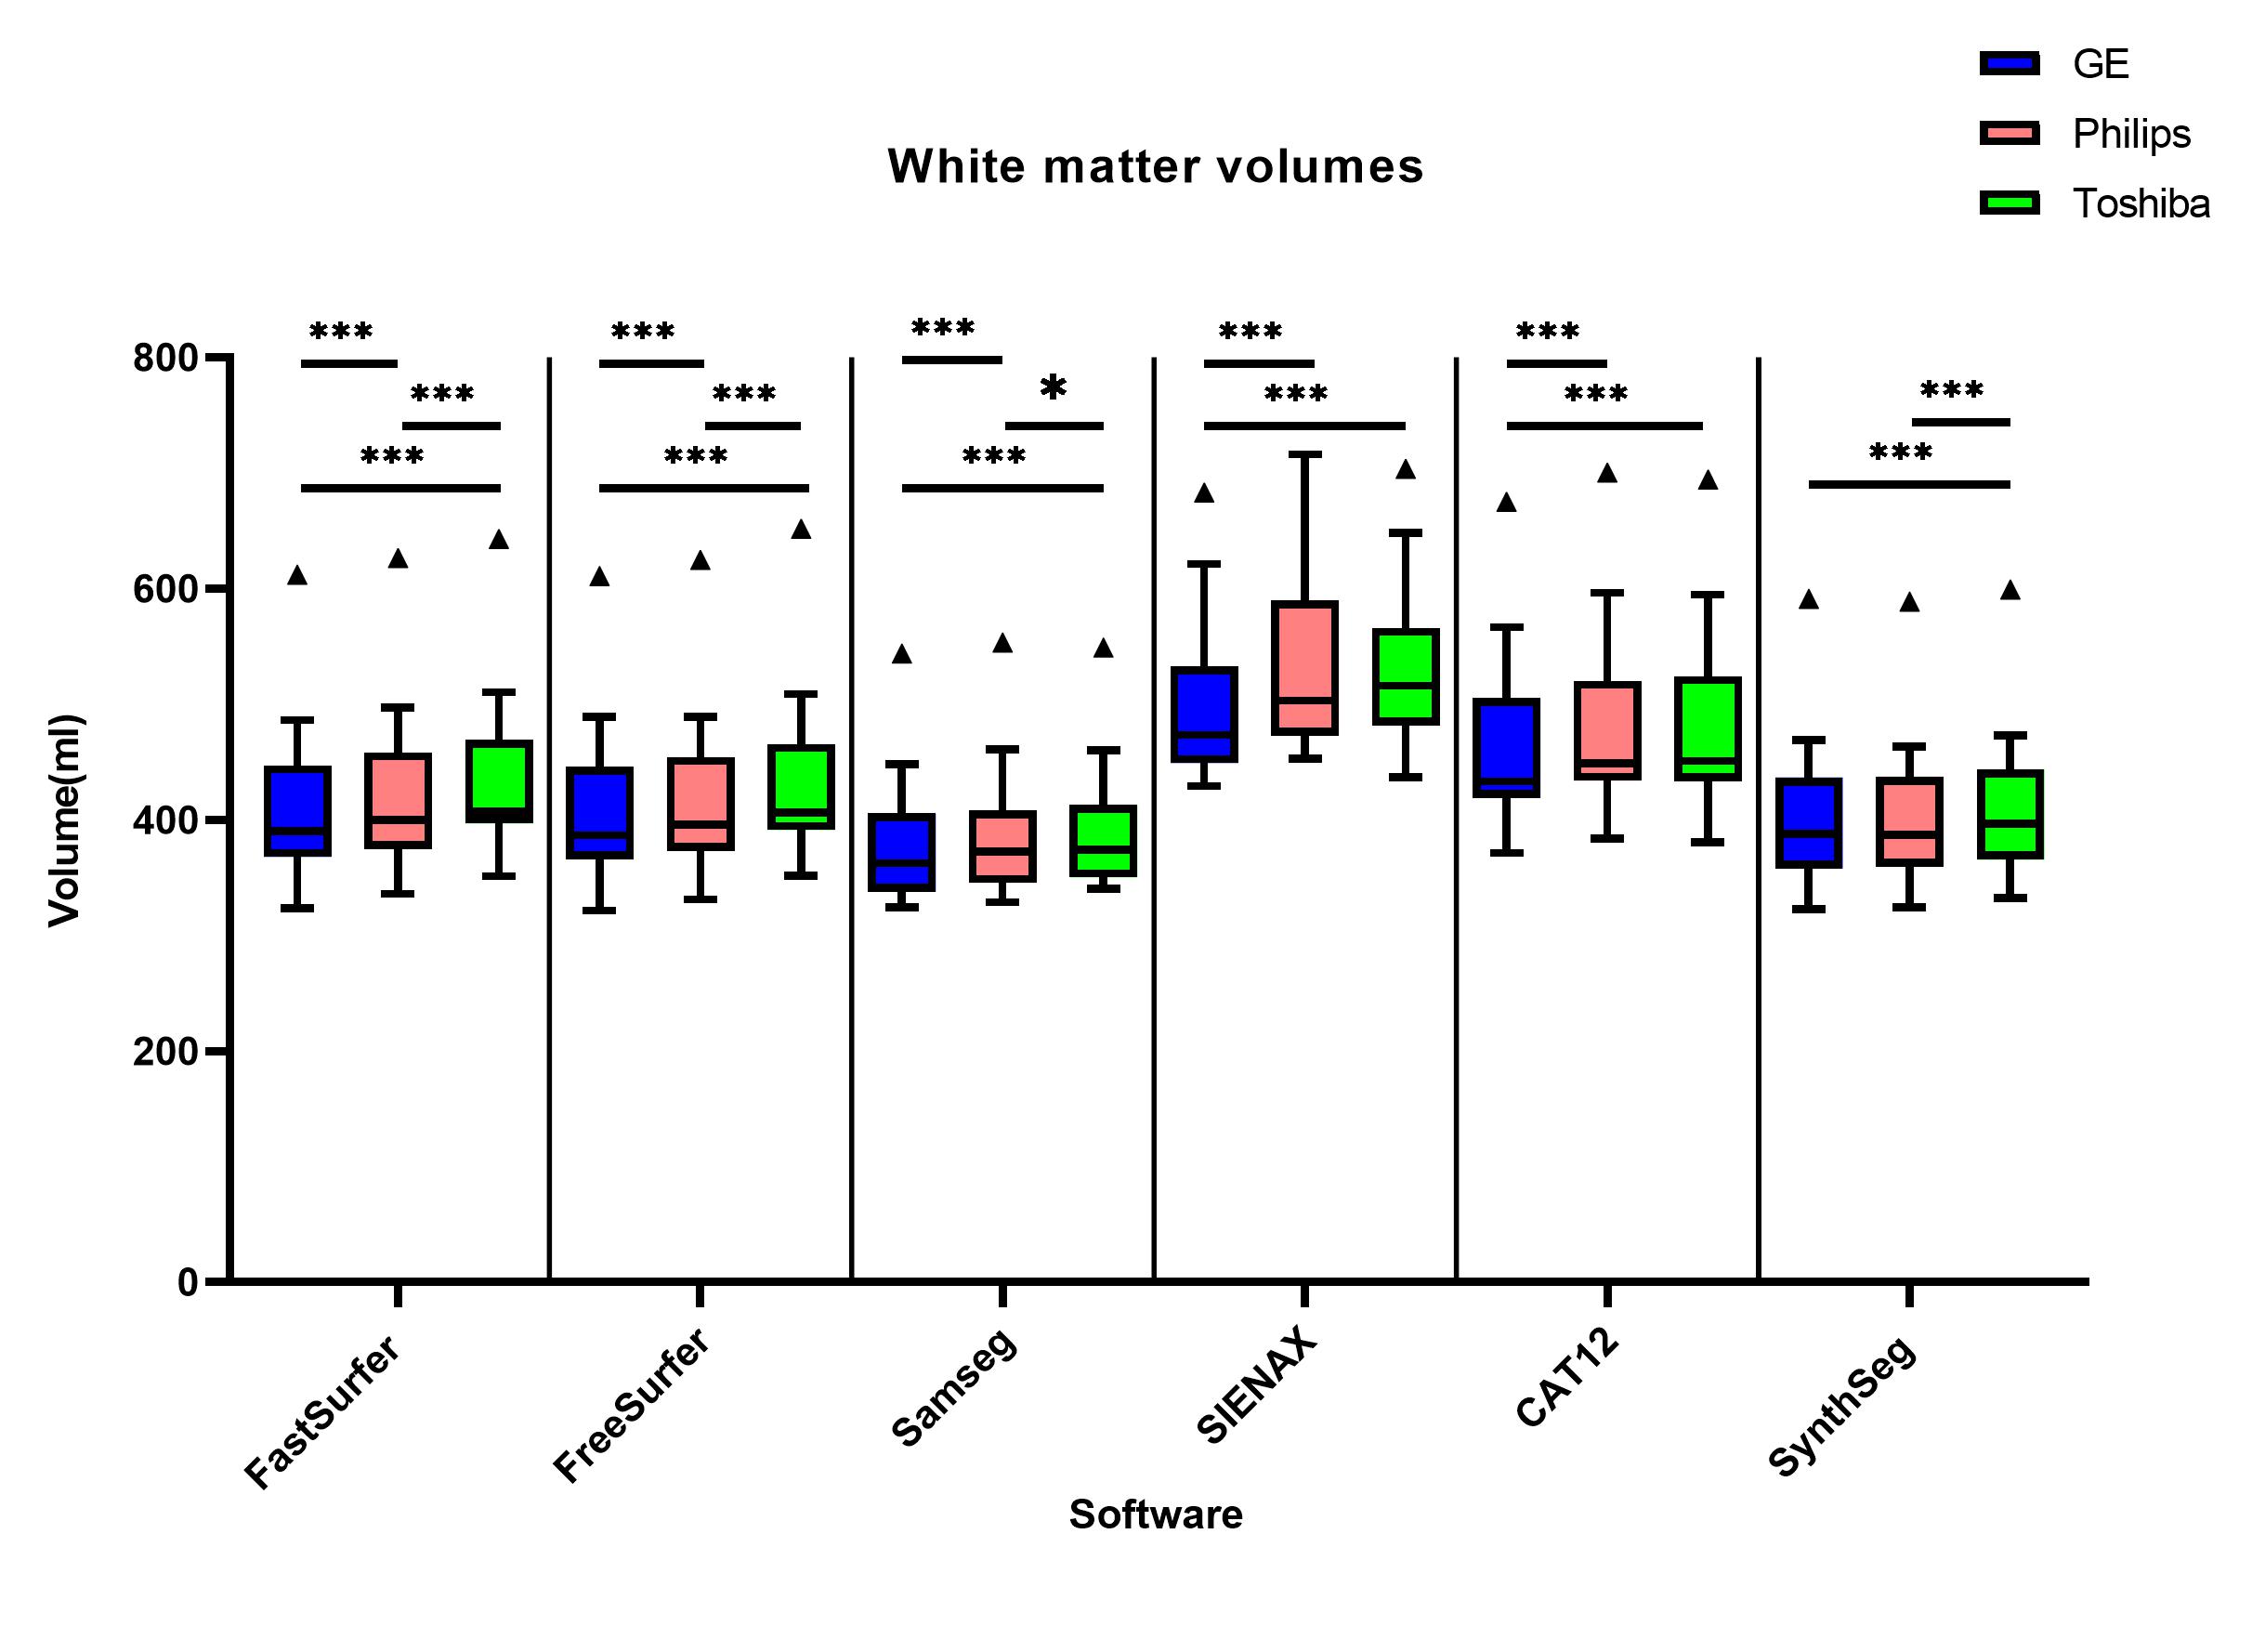
The overall between-scanner ICC for consistency was good to excellent (>0.7) for all the software, except for some small structures such as the accumbens. Figure 2 shows that SAMSEG seems to have the highest ICC for between scanner agreement, followed by FastSurfer and SynthSeg. The within-scanner agreement is on average higher than the between-scanner agreement. However, systematic differences in volume measurements between-scanners are found in all the software in both gray and white matter (Figure 3 and Figure 4). For every software package the white matter for GE has a lower volume compared to Toshiba and Philips (p<0.001, except for SynthSeg). Conversely, the volume of gray matter segmented from GE scans was significantly higher compared to both Toshiba and Philips scanners (p<0.001 and for SynthSeg p<0.05). Lesion filling did not significantly improve the ICC score, but we did see an increase in WM volumes, as expected.Discussion
In this study we compared the repeatability and reliability of 6 freely available software packages on three different 3T MR-scanners. The within-scanner agreement was higher than the between-scanner agreement. Furthermore, systematic differences exist between scanners for each software. This implies that in a clinical setting or a cross-sectional multi-center/multi-scanner trial the patients have to be scanned on the same scanner to detect relatively small yearly atrophy rate in MS18. Our results concerning between-scanner differences are consistent with previous similar studies in MS19, 20. On average the between-scanner ICC scores are higher in SAMSEG suggesting that sequence adaptive software has a better reproducibility for multi-scanner studies. The FSL and FreeSurfer ICC scores were lower compared to other software. Noticeably, FastSurfer ICCs were higher than FreeSurfer, even though FastSurfer has been trained on FreeSurfer segmentation output instead of manual segmentations. A disadvantage of CAT-12 is that it does not explicitly segment the deep gray matter structures, but uses an atlas to get white matter and gray matter volumes. We unfortunately did not have manually outlined segmentations to check the quality of the segmentation of the images. In addition, not every segmentation was visually inspected for correctness, but abnormal volumes were excluded from the analyses.Conclusion
Although both between- and within ICCs are high, systematic differences between scanners are present suggesting the need for standardization for between-scanner volume-measurements. It is worth mentioning that there are several more available software packages and that their accuracy assessment is warranted.Acknowledgements
This research was supported by ZonMW and the Dutch MS Research Foundation. Data acquisition was part of a project funded by Novartis.References
1. Andravizou, A., et al., Brain atrophy in multiple sclerosis: mechanisms, clinical relevance and treatment options. Autoimmunity Highlights, 2019. 10(1): p. 7.
2. Liu, Y., et al., Different patterns of longitudinal brain and spinal cord changes and their associations with disability progression in NMO and MS. Eur Radiol, 2018. 28(1): p. 96-103.
3. Chard, D.T., et al., Reducing the impact of white matter lesions on automated measures of brain gray and white matter volumes. J Magn Reson Imaging, 2010. 32(1): p. 223-8.
4. Amiri, H., et al., Urgent challenges in quantification and interpretation of brain grey matter atrophy in individual MS patients using MRI. Neuroimage Clin, 2018. 19: p. 466-475.
5. Weeda, M.M., et al., Validation of mean upper cervical cord area (MUCCA) measurement techniques in multiple sclerosis (MS): High reproducibility and robustness to lesions, but large software and scanner effects. Neuroimage Clin, 2019. 24: p. 101962.
6. Weeda, M.M., et al., Comparing lesion segmentation methods in multiple sclerosis: Input from one manually delineated subject is sufficient for accurate lesion segmentation. NeuroImage. Clinical, 2019. 24: p. 102074-102074.
7. Valverde, S., et al., One-shot domain adaptation in multiple sclerosis lesion segmentation using convolutional neural networks. Neuroimage Clin, 2019. 21: p. 101638.
8. Jenkinson, M., et al., Improved optimization for the robust and accurate linear registration and motion correction of brain images. Neuroimage, 2002. 17(2): p. 825-41.
9. Dale, A.M., B. Fischl, and M.I. Sereno, Cortical surface-based analysis. I. Segmentation and surface reconstruction. Neuroimage, 1999. 9(2): p. 179-94.
10. Fischl, B., M.I. Sereno, and A.M. Dale, Cortical surface-based analysis. II: Inflation, flattening, and a surface-based coordinate system. Neuroimage, 1999. 9(2): p. 195-207.
11. Smith, S.M., et al., Accurate, robust, and automated longitudinal and cross-sectional brain change analysis. Neuroimage, 2002. 17(1): p. 479-89.
12. Patenaude, B., et al., A Bayesian model of shape and appearance for subcortical brain segmentation. NeuroImage, 2011. 56(3): p. 907-922.
13. Puonti, O., J.E. Iglesias, and K. Van Leemput, Fast and sequence-adaptive whole-brain segmentation using parametric Bayesian modeling. NeuroImage, 2016. 143: p. 235-249.
14. Henschel, L., et al., FastSurfer - A fast and accurate deep learning based neuroimaging pipeline. NeuroImage, 2020. 219: p. 117012.
15. Gaser, C. and R. Dahnke. CAT-A Computational Anatomy Toolbox for the Analysis of Structural MRI Data. 2016.
16. Billot, B., et al., SynthSeg: Domain Randomisation for Segmentation of Brain MRI Scans of any Contrast and Resolution. arXiv e-prints, 2021: p. arXiv: 2107.09559.
17. Koo, T.K. and M.Y. Li, A Guideline of Selecting and Reporting Intraclass Correlation Coefficients for Reliability Research. J Chiropr Med, 2016. 15(2): p. 155-63.
18. De Stefano, N., et al., Establishing pathological cut-offs of brain atrophy rates in multiple sclerosis. Journal of Neurology, Neurosurgery & Psychiatry, 2016. 87(1): p. 93-99.
19. Guo, C., et al., Repeatability and reproducibility of FreeSurfer, FSL-SIENAX and SPM brain volumetric measurements and the effect of lesion filling in multiple sclerosis. Eur Radiol, 2019. 29(3): p. 1355-1364.
20. Biberacher, V., et al., Intra- and interscanner variability of magnetic resonance imaging based volumetry in multiple sclerosis. NeuroImage, 2016. 142: p. 188-197.
Figures