2228
A Framework for Brain Tumor Detection, Classification and Segmentation using Deep Learning1Medical Image Processing Research Group (MIPRG), Dept. of Elect. & Comp. Engineering, COMSATS University Islamabad, Islamabad, Pakistan, 2OncoRay – National Center for Radiation Research in Oncology, Faculty of Medicine and University Hospital Carl Gustav Carus, Technische Universität Dresden, Helmholtz-Zentrum Dresden – Rossendorf, Dresden, Germany, 3German Cancer Research Center (DKFZ), Heidelberg, Germany, 4Service of Radiology, Geneva University Hospitals and Faculty of Medicine, University of Geneva, Geneva, Switzerland
Synopsis
Detection, classification and segmentation of brain tumor simultaneously is challenging due to the heterogeneous nature of the tumor. Limited work has been done in literature in this regard. The present study, therefore, aims to identify an object detection network that would be able to solve multi-class brain tumor classification and detection problem with high accuracy. Furthermore, the best performing detection network has been cascaded with 2D U-Net for pixel level segmentation. The proposed method not only classifies the tumor with high accuracy but also provides improved segmentation results compared to the standard U-Net.
Introduction
Deep learning based object detection algorithms locate the objects within a bounding box and also provide classification scores for the detected objects within an image. Promising results have been shown in literature for brain tumor segmentation and classification [1]–[4] but very limited work has been done for simultaneous brain tumor detection, classification and segmentation [5]. The present study aims to address simultaneous classification and segmentation problem by cascading deep learning based object detection and segmentation algorithms. The classification and detection performance of two state-of-the-art deep learning based object detection models (Faster R-CNN and YOLO) was compared for three tumor types. The best performing object detection model was then paired with 2D U-Net for pixel-wise segmentation of abnormal tumor cells.Method
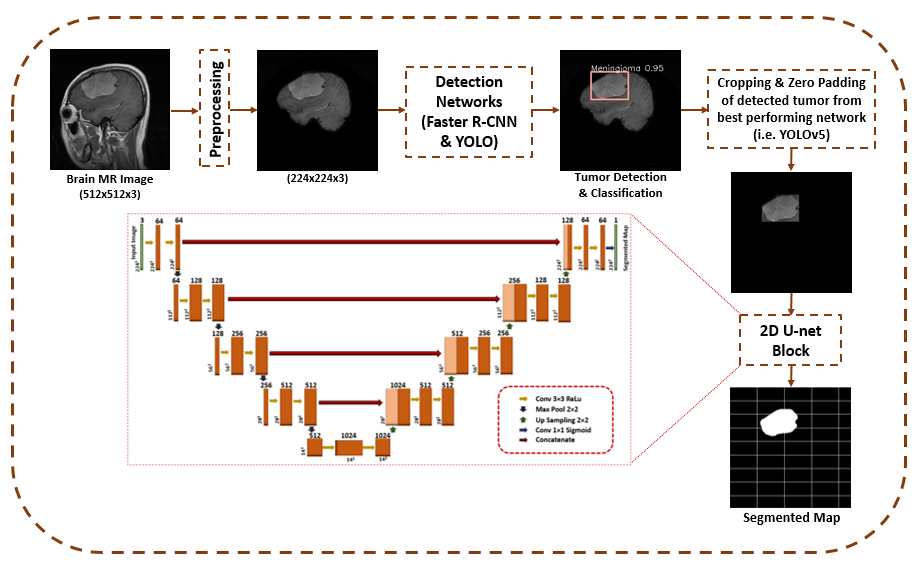
In this work, publically available Brain Tumor Figshare (BTF) dataset version 5 [6] was used. The dataset comprises of T1weighted contrast enhanced (T1-c) MR Images with three kinds of brain tumors namely meningioma, glioma and pituitary tumor. The repository provides a total of 3064 slices of T1-c images for 233 subjects (in-plane resolution = 512×512, pixel size = 0.49×0.49 mm2, slice thickness = 6 mm, slice gap = 1 mm) and the corresponding tumor segmentation binary masks [7].Figure-1 presents block diagram of the proposed method. In data preprocessing step, skull stripping of T1-c images was performed using Brain Extraction Tool (BET) [8]. T1-c images and the corresponding segmentation masks were then resized to 224x224. In order, to provide ground truth bounding boxes for training and testing the detection networks, the binary mask of segmented region was localized by computing bounding box coordinates in x-y plane of each slice using a custom script written in python version 3.8.8.
The dataset was then split into training, validation and test set using stratified splitting so that each of the split has same ratio of three tumor types (training: patient\images = 168\2200, internal validation: patients\images = 19\272, testing: patient\images = 46\592). Faster R-CNN [9] was trained on the training data using three different feature extraction networks i.e. VGG-16 [10], ResNet-50 [11] and DenseNet-121 [12]. Similarly, two variants of YOLO object detection network i.e. Yolov4 [13] and Yolov5 [14] were trained individually on the training data. Each of the above variant of Faster R-CNN and YOLO model was tuned over a range of parameters (learning rate = [0.0001- 0.01], number of epochs = [50-200], (optimizer = [Adam, SGD]) to find the best set of hyperparameters that provide maximum results on the validation data.
In the next step, the detected bounding boxes from the best performing object detection network were cropped and converted to a fixed-size (i.e. 224x224) using zero padding for both the training and validation data. In case of multiple detections in a single slice, only one bounding box with the highest probability was selected for pixel wise segmentation using 2D U-Net. 2D U-Net was also trained using the whole set of training data, as discussed above (no detection involved) for comparative analysis. For segmentation part, the model was trained on training data and losses were optimized on validation data. Hyperparameter search was also carried out for the segmentation network to find the best set of hyperparameters. Finally, the best performing detection and segmentation networks were applied to test data for final predictions.
The performance of detection networks was evaluated using mean Average Precision (mAP) by computing mean of Average Precision (AP) for all the 3 classes i.e. meningioma, glioma and pituitary tumor, while the performance of segmentation network was evaluated with Dice-score coefficient and the results were compared with the standard 2D U-Net [15].
Results and Discussion
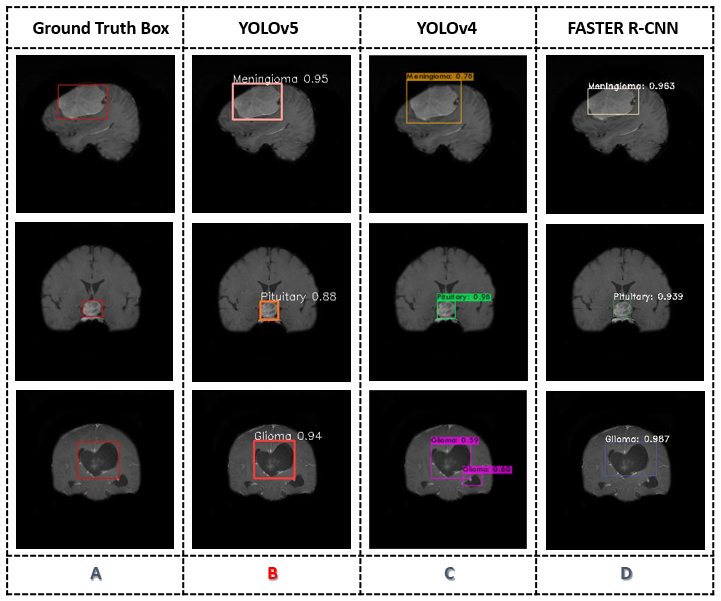
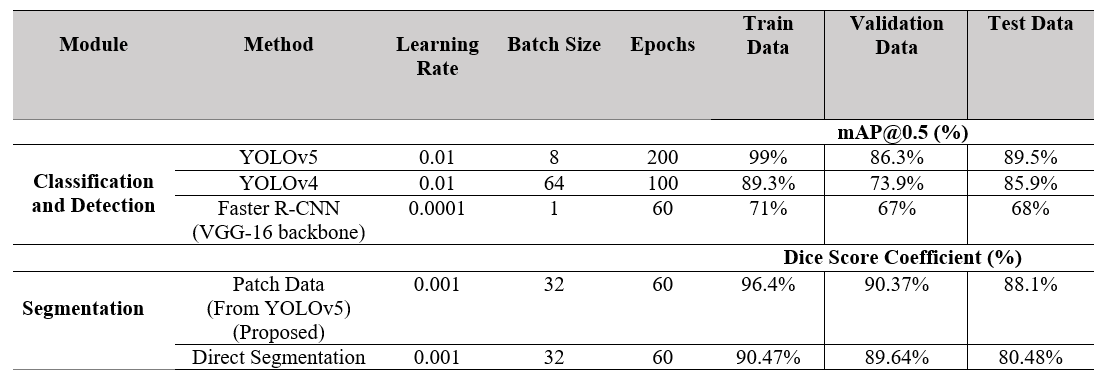
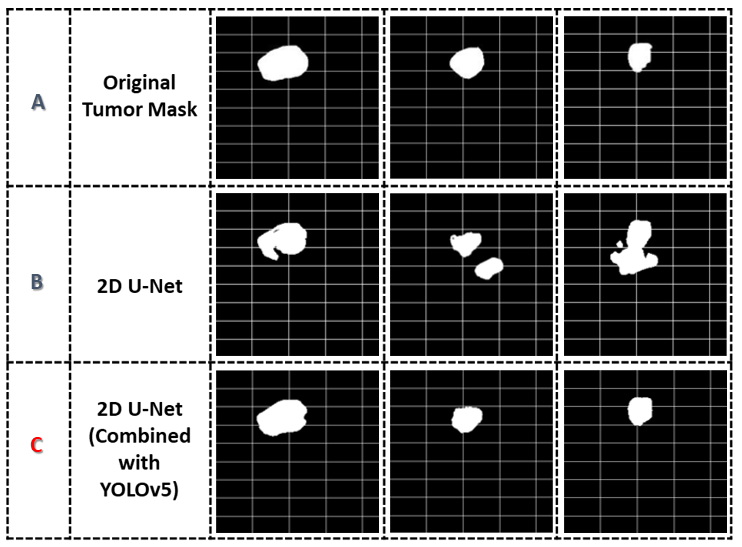
Table-1 shows a comparison of training, validation and test results with the best hyperparameters for the detection and segmentation networks. For simultaneous classification and detection of three tumor types, YOLOv5 achieved the highest mean Average Precision (mAP) of 89.5% on test data. YOLOv4 follows this result with an mAP of 85.9% while Faster R-CNN with VGG-16 as a backbone achieved an mAP of 68% only on the test data. Figure-2 shows the output bounding boxes generated by each detection network along with the ground truth labels on the test data. YOLOv5 localizes the brain tumor more precisely and accurately as compared to the YOLOv4 and Faster R-CNN model. 2D U-Net achieved a dice score coefficient of 80.48% whereas the proposed method that uses patches extracted from YOLOv5 achieved a dice score of 88.1% on the test data as shown in Table-1. The segmented tumor regions by both the segmentation methods are shown in Figure-3. The proposed method performs brain tumor classification and detection accurately via detection network and precisely delineates the tumor region within the extracted region of interest using 2D U-Net as compared to the standard 2D U-Net architecture [15].Conclusion
In this paper, we propose a deep learning based method for multi-class tumor detection, classification and segmentation. The results are compared with standard 2D U-Net [15]. The results show that the proposed method not only detects different types of brain tumor accurately but also delineates the tumor region precisely within the detected bounding box.Acknowledgements
No acknowledgement found.References
[1] R. Pourreza, Y. Zhuge, H. Ning, and R. Miller, “Brain tumor segmentation in MRI scans using deeply-supervised neural networks,” Lect. Notes Comput. Sci. (including Subser. Lect. Notes Artif. Intell. Lect. Notes Bioinformatics), vol. 10670 LNCS, no. February 2018, pp. 320–331, 2018.
[2] K. Pawar, Z. Chen, N. J. Shah, and G. Egan, “Residual encoder and convolutional decoder neural network for glioma segmentation,” Lect. Notes Comput. Sci. (including Subser. Lect. Notes Artif. Intell. Lect. Notes Bioinformatics), vol. 10670 LNCS, no. February, pp. 263–273, 2018.
[3] D. Liu, H. Zhang, M. Zhao, X. Yu, S. Yao, and W. Zhou, “Brain Tumor Segmention Based on Dilated Convolution Refine Networks,” Proc. - 2018 IEEE/ACIS 16th Int. Conf. Softw. Eng. Res. Manag. Appl. SERA 2018, pp. 113–120, 2018.
[4] S. Deepak and P. M. Ameer, “Brain tumor classification using deep CNN features via transfer learning,” Comput. Biol. Med., vol. 111, no. March, p. 103345, 2019.
[5] M. Masood, T. Nazir, M. Nawaz, A. Javed, M. Iqbal, and A. Mehmood, “Brain tumor localization and segmentation using mask RCNN,” Front. Comput. Sci., vol. 15, no. 6, 2021.
[6] J. Cheng, “Brain Tumor Figshare dataset,” 03.04.2017. https://figshare.com/articles/dataset/brain_tumor_dataset/1512427.
[7] J. Cheng et al., “Enhanced performance of brain tumor classification via tumor region augmentation and partition,” PLoS One, vol. 10, no. 10, pp. 1–13, 2015.
[8] S. M. Smith, “Fast robust automated brain extraction,” Hum. Brain Mapp., vol. 17, no. 3, pp. 143–155, 2002.
[9] S. Ren, K. He, R. Girshick, and J. Sun, “Faster R-CNN: Towards Real-Time Object Detection with Region Proposal Networks,” IEEE Trans. Pattern Anal. Mach. Intell., vol. 39, no. 6, pp. 1137–1149, 2017.
[10] K. Simonyan and A. Zisserman, “Very deep convolutional networks for large-scale image recognition,” 3rd Int. Conf. Learn. Represent. ICLR 2015 - Conf. Track Proc., pp. 1–14, 2015.
[11] K. He, X. Zhang, S. Ren, and J. Sun, “Deep residual learning for image recognition,” Proc. IEEE Comput. Soc. Conf. Comput. Vis. Pattern Recognit., vol. 2016-Decem, pp. 770–778, 2016.
[12] G. Huang, Z. Liu, L. Van Der Maaten, and K. Q. Weinberger, “Densely connected convolutional networks,” Proc. - 30th IEEE Conf. Comput. Vis. Pattern Recognition, CVPR 2017, vol. 2017-Janua, pp. 2261–2269, 2017.
[13] A. Bochkovskiy, C.-Y. Wang, and H.-Y. M. Liao, “YOLOv4: Optimal Speed and Accuracy of Object Detection,” 2020, [Online].
[14] “YOLOv5.” https://github.com/ultralytics/yolov5 (accessed Sep. 17, 2021).
[15] W. Weng and X. Zhu, “INet: Convolutional Networks for Biomedical Image Segmentation,” IEEE Access, vol. 9, pp. 16591–16603, 2021.
Figures