2225
Effect of Compressed SENSE on Freesurfer parcellation precision
Michael A Green1,2, Peter Humberg3, Iain K Ball4, and Caroline D Rae1,2
1Neuroscience Research Australia, Sydney, Australia, 2School of Medical Sciences, University of New South Wales, Sydney, Australia, 3Stats Central, Mark Wainwright Analytical Centre, University of New South Wales, Sydney, Australia, 4Philips Australia & New Zealand, Sydney, Australia
1Neuroscience Research Australia, Sydney, Australia, 2School of Medical Sciences, University of New South Wales, Sydney, Australia, 3Stats Central, Mark Wainwright Analytical Centre, University of New South Wales, Sydney, Australia, 4Philips Australia & New Zealand, Sydney, Australia
Synopsis
We employed the commonly used software package, Freesurfer to obtain volume, area and thickness measurements from structural MR imaging data acquired using the Compressed SENSE acceleration technique. We assessed measurement reliability via equivalence testing on a series of increasing acceleration factors to provide guidelines for researchers wanting to reduce scan acquisition time while acquiring high-quality data.
Background
Compressed SENSE1 (CS) enables scan acceleration by combining the compressed sensing principle2 and SENSE technique3 to optimise both image acquisition and reconstruction times. However, Compressed SENSE is susceptible to its own unique set of artifacts including a decrease in signal to noise (SNR) because of less k-space sampling. SNR is spatially variant and reduced as the square root of the acquisition time2,3. Compressed sensing is also penalised at faster acquisition times with a loss of low-contrast features due to under-sampling k-space4. These image artifacts are generally inconsequential in most clinical diagnoses, but the effect, especially at high acceleration factors on image post-processing used in high precision research studies, is unknown.Aim
We assessed the effect of a range of CS acceleration factors on the Freesurfer measurements volume, and cortical thickness and surface area by carrying out a paired equivalence test for each segmented and parcellated brain region. We aimed to establish a guideline for researchers to assess the trade-off between image acquisition time, sample size and the reliability of Freesurfer metrics acquired at high CS acceleration factors.Methods
Five 3D turbo field echo (TFE), T1-weighted images were acquired from 20 participants (10 male, age range 21-50, 10 female, age range 23-54) at 3T (Ingenia CX) using a digital 32-channel head coil at Compressed SENSE acceleration factors of 2, 4, 6, 8, 10 (Figure 1). A repeat set of images was acquired on a different day, yielding two image sets for each participant. Images were post-processed with the default “recon-all” Freesurfer v6.0.0 pipeline using the Desikan-Killiany atlas to obtain measures of volume, mean cortical thickness and surface area for 34 cortical structures in each hemisphere. Subcortical regions were segmented to extract volumetric measures, including the Freesurfer outputs for total gray matter, white matter, CSF and intracranial volume. In total, 200 3D-T1w TFE datasets were acquired and post-processed.We carried out a paired equivalence test for each segmented and parcellated brain region at CS factors of 4, 6, 8 and 10 compared with the chosen baseline factor 2. We chose the equivalence region for this test to correspond to the 95% confidence interval of the difference in baseline measurements acquired each day and considered p-values > 0.05 to not be within the acceptable equivalence region.
Results
Across all brain regions, we found that the percentage of equivalent measures decreased with increasing CS factor (Table 1).All subcortical volumes were found to be statistically equivalent at CS4 compared with the baseline CS2 acquisition with only a number of estimates not equivalent at higher CS factors including cerebral white matter and SupraTentorial volumes.
Volume measurements on the right caudate for example, were equivalent to that at CS2 (p<0.05) at each of the acquired CS factors (Figure 2, top). The variability of the same measurement of right thalamus increased with each acquisition (Figure 2, bottom) and was not equivalent at the highest CS factor acquired.
Measurements of cortical thickness and surface area were found to be equivalent for all regions at CS factor 4. At a CS factor of 10, 80.9% of regions were not equivalent for measures of cortical surface area, and 64.7% for measurements of cortical surface area including both left and right superior frontal, fusiform, entorhinal, parahippocampal and middle temporal areas.
Discussion and Conclusion
This study provides evidence for researchers wishing to take advantage of the time-saving benefits of accelerated imaging using Compressed SENSE while being aware of which brain region measurements are likely to be compromised by its implementation.In general, Freesurfer performs well at higher Compressed SENSE factors. A CS factor of 4 will reduce acquisition time by 50% compared with CS2, while not compromising Freesurfer measurement accuracy and without the need for scanning more participants.
A larger percentage of Freesurfer measurements of volume, cortical thickness and surface area will suffer from increased variance at higher CS factors. Researchers should consider which brain regions are of interest before selecting a Compressed SENSE factor prior to image acquisition.
Acknowledgements
The authors acknowledge the facilities and scientific and technical assistance of the National Imaging Facility, a National Collaborative Research Infrastructure Strategy (NCRIS) capability, at Neuroscience Research Australia and UNSW.References
- Geerts-Ossevoort L, et al. Compressed SENSE. Speed done right. Every time. Philips® healthcare, Netherlands. 2018
- Lustig M, et al. Sparse MRI: the application of compressed sensing for rapid MR imaging. Magn Reson Med. 2007
- Pruessmann K P, et al. SENSE: sensitivity encoding for fast MRI, Magn Reson Med. 1999
- Robson et al. Comprehensive Quantification of Signal-to-Noise Ratio and g-Factor for Image-Based and k-Space-Based Parallel Imaging Reconstructions, Magn Reson Med. 2008
Figures
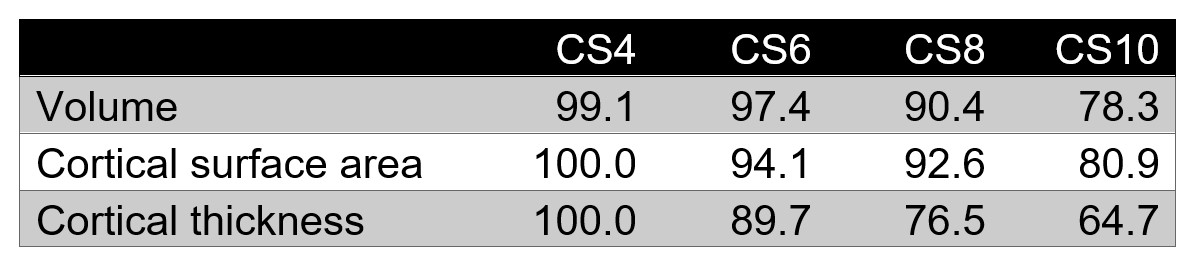
Table 1: Percentage of Freesurfer regions considered to be equivalent
(compared to baseline CS2) for each measure.

Figure 1. Example T1-weighted images acquired at increasing CS factors. Scan times are denoted next to each CS factor. All images were acquired using the following scan parameters: 180 slices (R-L) in the sagittal acquisition plane, 240 mm FOV, 1x1x1 mm acquired voxel size, non-selective excitation, TE/TR = 2.8/5.9 ms, TI = 850 ms, flip angle = 8° with a TFE factor = 117 and TFE shot interval = 2000 ms.

Figure 2. Bland-Altman plots of the mean difference
between the two volume measurements against the absolute difference for each
subject at the four Compressed SENSE factors. The blue line represents the mean
value of the difference in volume measurements and the green dotted lines show
the 95% upper and lower limits of agreement (±1.96 SD). The black dotted line
indicates the zero value on the y-axis for ease of comparison.
DOI: https://doi.org/10.58530/2022/2225